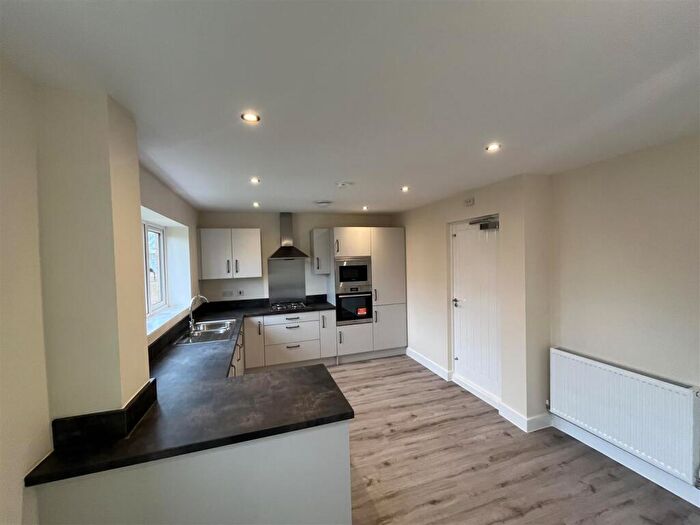
Houses for sale & to rent in Cheadle South East, Stoke-on-trent
House Prices in Cheadle South East
Properties in Cheadle South East have an average house price of £200,104.00 and had 199 Property Transactions within the last 3 years¹.
Cheadle South East is an area in Stoke-on-trent, Staffordshire with 1,556 households², where the most expensive property was sold for £765,000.00.
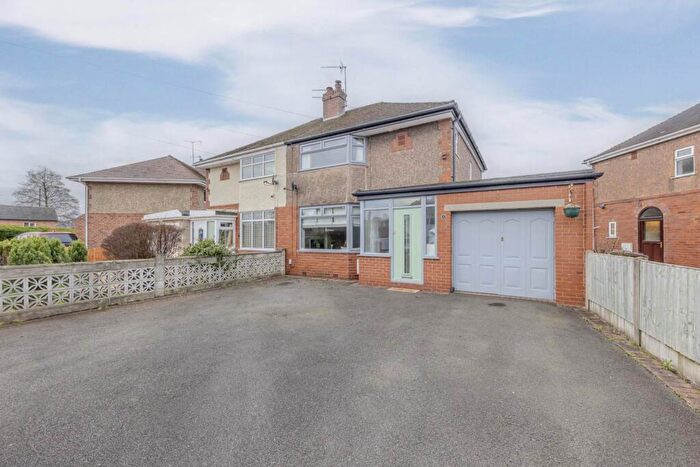
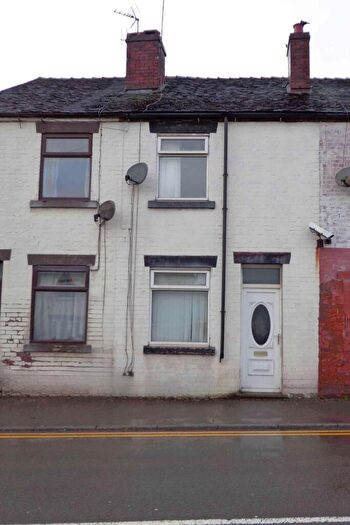
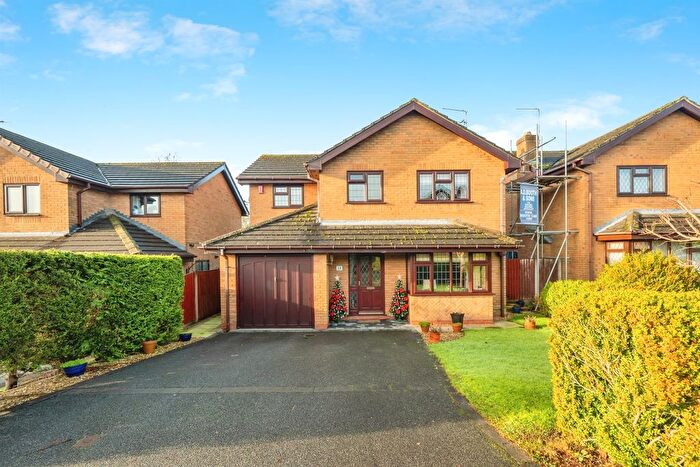
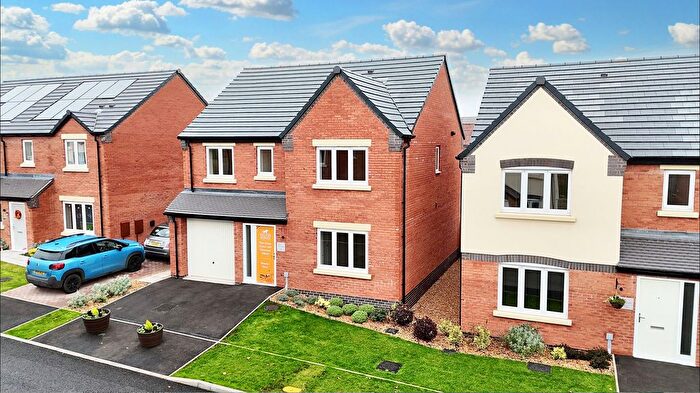
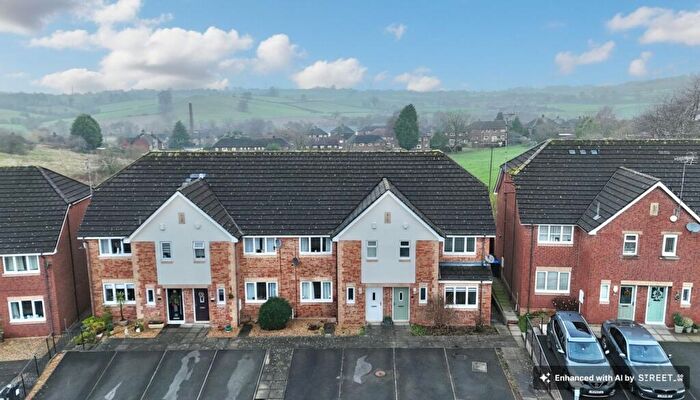
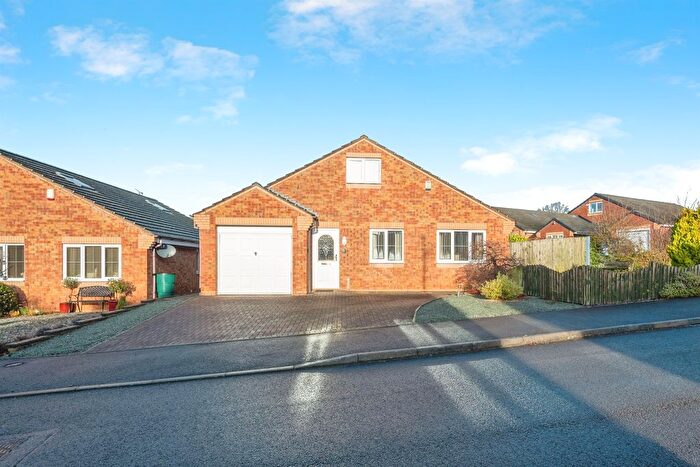
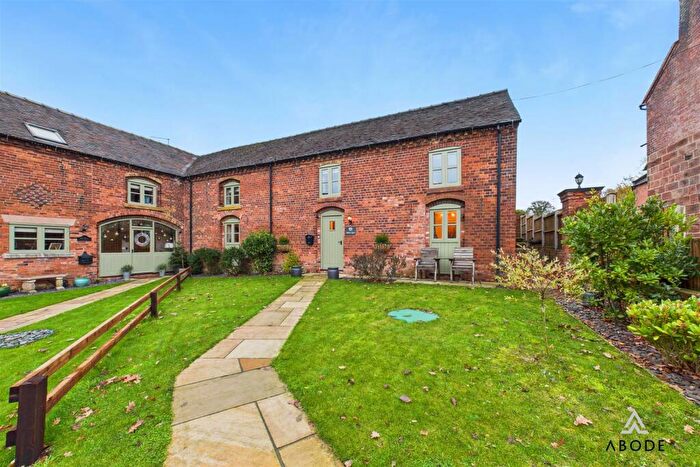
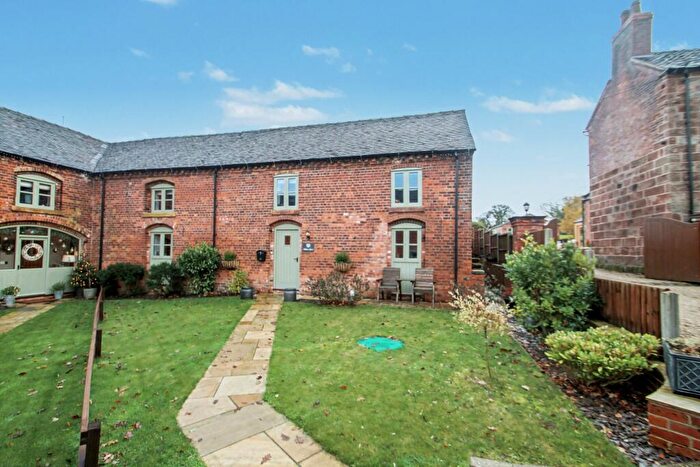
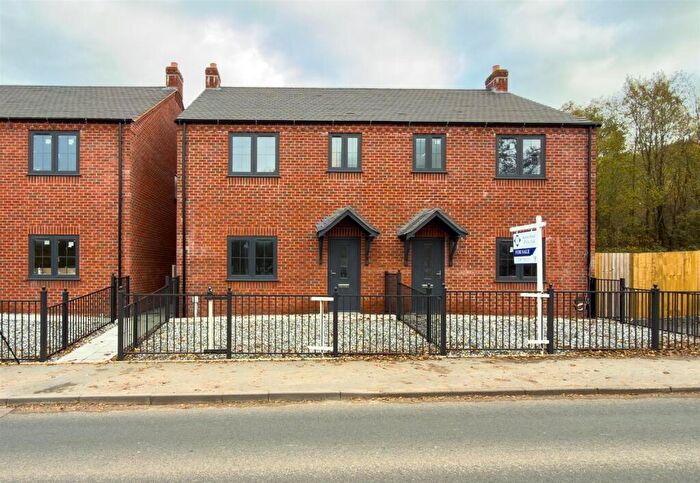
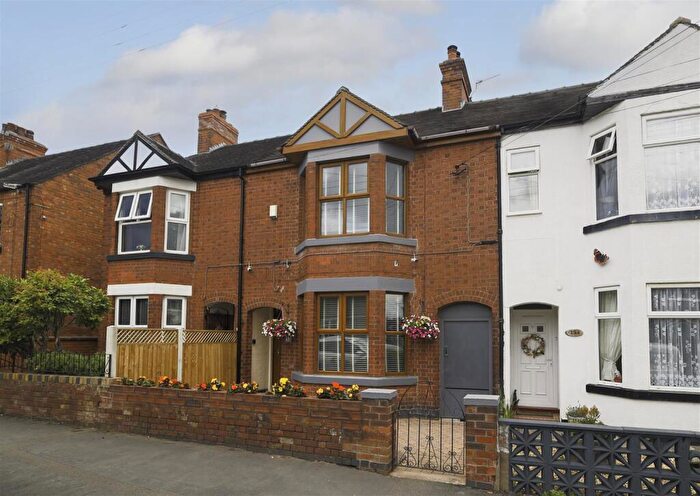
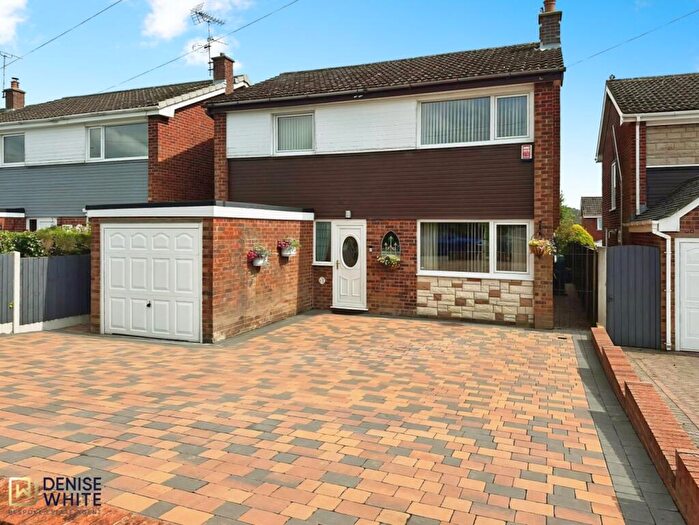
Properties for sale in Cheadle South East
Roads and Postcodes in Cheadle South East
Navigate through our locations to find the location of your next house in Cheadle South East, Stoke-on-trent for sale or to rent.
| Streets | Postcodes |
|---|---|
| Allen Street | ST10 1HJ |
| Arundel Drive | ST10 1YX |
| Ash Close | ST10 1SQ |
| Ashbourne Road | ST10 1HF ST10 1HQ ST10 1RS ST10 1RT ST10 1HG ST10 1SJ ST10 1YJ |
| Augustus Way | ST10 1FS |
| Avon Grove | ST10 1QR |
| Baddeley Street | ST10 1HN |
| Barkers Bank | ST10 1TT |
| Barley Croft | ST10 1NA |
| Beech Close | ST10 1SN |
| Bittern Lane | ST10 1RY |
| Bramley Close | ST10 1PP |
| Bramshaws Acre | ST10 1BE |
| Cecilly Grove | ST10 1GA |
| Cedar Close | ST10 1SE |
| Chapel Lane | ST10 4QZ |
| Churnet Grove | ST10 1QW |
| Conway Grove | ST10 1QG |
| Counslow | ST10 4QY |
| Counslow Road | ST10 1RF |
| Dale Bank Road | ST10 1RE |
| Dale Close | ST10 1SB |
| Dane Grove | ST10 1QS |
| Darley Grove | ST10 1QP |
| Dart Grove | ST10 1QF |
| Derwent Drive | ST10 1QN |
| Eaves Lane | ST10 1RB ST10 1TL ST10 1YL |
| Eden Grove | ST10 1QT |
| Elm Drive | ST10 1SG |
| Freehay | ST10 1RD ST10 1TR ST10 1RH |
| Freehay Road | ST10 1TP |
| Gorsty Hill | ST10 4EL |
| Hawfinch Road | ST10 1RX |
| High Shutt | ST10 4QX |
| Keeling Road | ST10 1HA ST10 1HB ST10 1NU |
| Kestrel Lane | ST10 1RU |
| Kingfisher Crescent | ST10 1RZ |
| Mackenzie Crescent | ST10 1LU |
| Manifold Drive | ST10 1QX |
| Mansion Close | ST10 1QL |
| Maple Close | ST10 1SD |
| Mercian Way | ST10 1FT |
| Mill Grove | ST10 1NF |
| Mill House Drive | ST10 1XL |
| Mill Road | ST10 1ND ST10 1NE ST10 1NG ST10 1NB |
| Millbrook Way | ST10 1XW |
| Millers View | ST10 1XP |
| Millstream Close | ST10 1XN |
| Millwaters | ST10 1XJ |
| Moss Lane | ST10 1QZ ST10 1SL |
| Park Avenue | ST10 1LZ |
| Plant Street | ST10 1HH |
| Rakeway Road | ST10 1QH ST10 1RA |
| Renwick Lane | ST10 1TX |
| Robina Drive | ST10 1HD ST10 1HE |
| Rockingham Drive | ST10 1YT |
| School Lane | ST10 1TS |
| Smithy Lane | ST10 1TN |
| Stanfield Crescent | ST10 1LT |
| Stokesay Drive | ST10 1YU |
| Sun Street | ST10 1EZ |
| Sunwell Gardens | ST10 1YR |
| Tamar Grove | ST10 1QQ |
| Tape Street | ST10 1BG ST10 1ER ST10 1ET |
| Tean Road | ST10 1LG ST10 1LS ST10 1LX |
| Teanford | ST10 4ES |
| Thames Drive | ST10 1QD |
| Thorley Drive | ST10 1SA ST10 1SF |
| Trent Close | ST10 1QU |
| Well Street | ST10 1EX ST10 1EY ST10 1BA |
| Winnothdale | ST10 4HB |
| Wye Close | ST10 1QE |
| Young Street | ST10 1HL |
| ST10 2QR ST10 9BG ST10 9BJ ST10 9BU ST10 9BW ST10 9BZ |
Transport near Cheadle South East
- FAQ
- Price Paid By Year
- Property Type Price
Frequently asked questions about Cheadle South East
What is the average price for a property for sale in Cheadle South East?
The average price for a property for sale in Cheadle South East is £200,104. This amount is 15% lower than the average price in Stoke-on-trent. There are 781 property listings for sale in Cheadle South East.
What streets have the most expensive properties for sale in Cheadle South East?
The streets with the most expensive properties for sale in Cheadle South East are Winnothdale at an average of £350,000, Stokesay Drive at an average of £336,000 and Millstream Close at an average of £317,666.
What streets have the most affordable properties for sale in Cheadle South East?
The streets with the most affordable properties for sale in Cheadle South East are Plant Street at an average of £117,617, Tape Street at an average of £123,857 and Bramshaws Acre at an average of £150,333.
Which train stations are available in or near Cheadle South East?
Some of the train stations available in or near Cheadle South East are Blythe Bridge, Longton and Uttoxeter.
Property Price Paid in Cheadle South East by Year
The average sold property price by year was:
| Year | Average Sold Price | Price Change |
Sold Properties
|
|---|---|---|---|
| 2025 | £228,934 | 11% |
42 Properties |
| 2024 | £202,842 | 10% |
48 Properties |
| 2023 | £181,699 | -7% |
54 Properties |
| 2022 | £193,770 | -7% |
55 Properties |
| 2021 | £207,649 | 1% |
73 Properties |
| 2020 | £205,847 | 15% |
43 Properties |
| 2019 | £175,188 | 8% |
67 Properties |
| 2018 | £161,532 | 8% |
44 Properties |
| 2017 | £147,858 | -1% |
61 Properties |
| 2016 | £149,367 | -4% |
67 Properties |
| 2015 | £155,659 | 12% |
55 Properties |
| 2014 | £137,689 | -7% |
58 Properties |
| 2013 | £147,431 | 13% |
54 Properties |
| 2012 | £128,424 | 2% |
54 Properties |
| 2011 | £126,473 | -4% |
42 Properties |
| 2010 | £131,563 | -19% |
45 Properties |
| 2009 | £156,424 | 4% |
25 Properties |
| 2008 | £150,214 | 1% |
34 Properties |
| 2007 | £148,301 | 6% |
83 Properties |
| 2006 | £139,539 | -6% |
68 Properties |
| 2005 | £147,477 | 21% |
52 Properties |
| 2004 | £116,223 | 11% |
76 Properties |
| 2003 | £103,957 | 25% |
76 Properties |
| 2002 | £78,463 | 10% |
69 Properties |
| 2001 | £70,759 | 2% |
56 Properties |
| 2000 | £69,220 | 3% |
112 Properties |
| 1999 | £67,087 | 16% |
105 Properties |
| 1998 | £56,119 | -6% |
79 Properties |
| 1997 | £59,518 | 17% |
87 Properties |
| 1996 | £49,686 | 3% |
73 Properties |
| 1995 | £48,204 | - |
71 Properties |
Property Price per Property Type in Cheadle South East
Here you can find historic sold price data in order to help with your property search.
The average Property Paid Price for specific property types in the last three years are:
| Property Type | Average Sold Price | Sold Properties |
|---|---|---|
| Semi Detached House | £188,633.00 | 92 Semi Detached Houses |
| Detached House | £295,513.00 | 51 Detached Houses |
| Terraced House | £131,333.00 | 55 Terraced Houses |
| Flat | £172,000.00 | 1 Flat |

