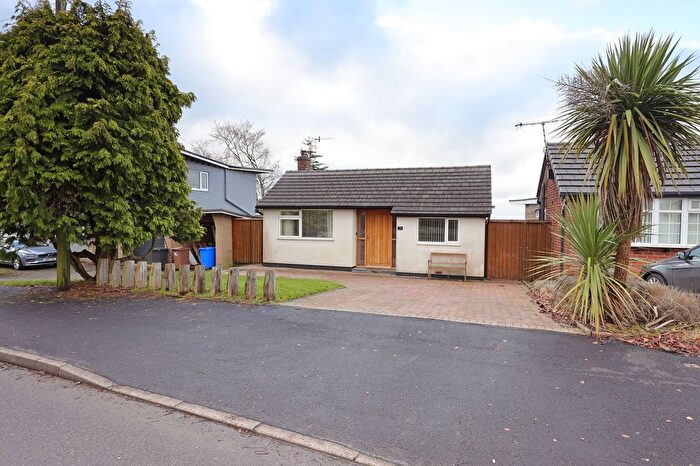
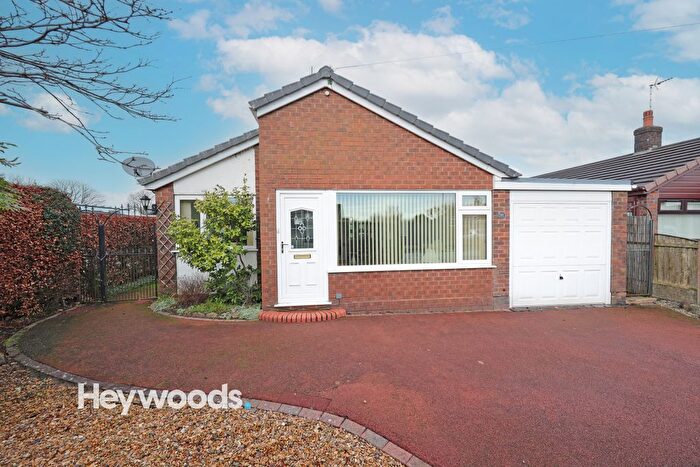
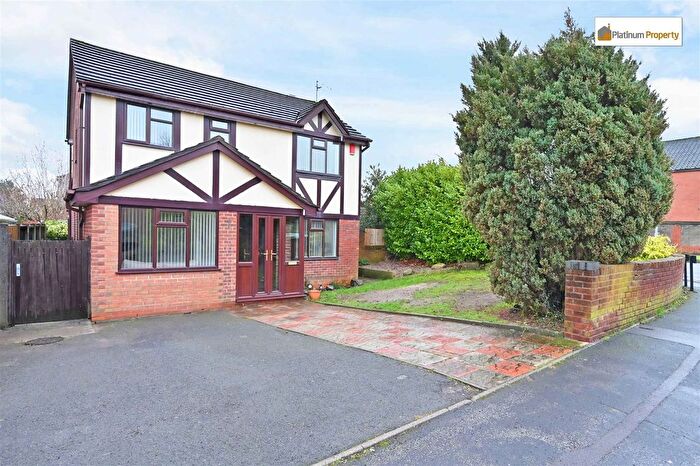
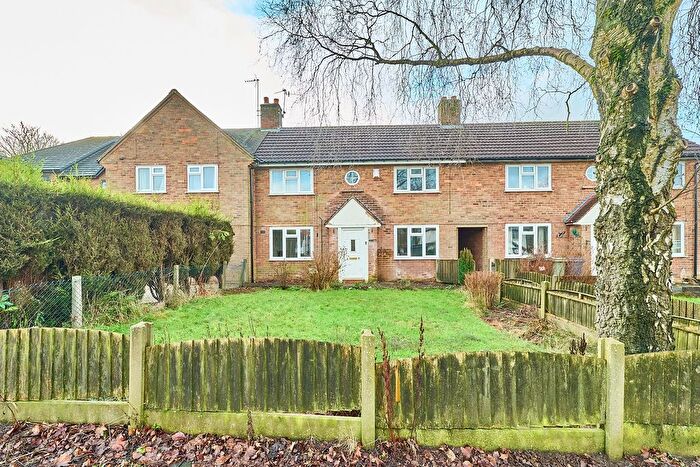
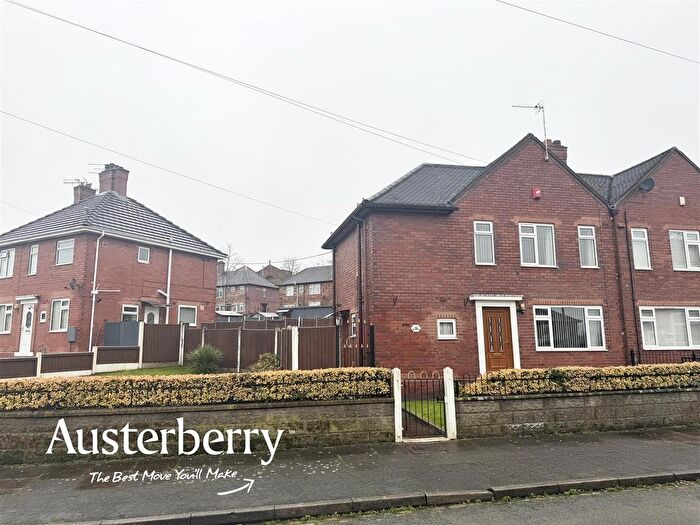
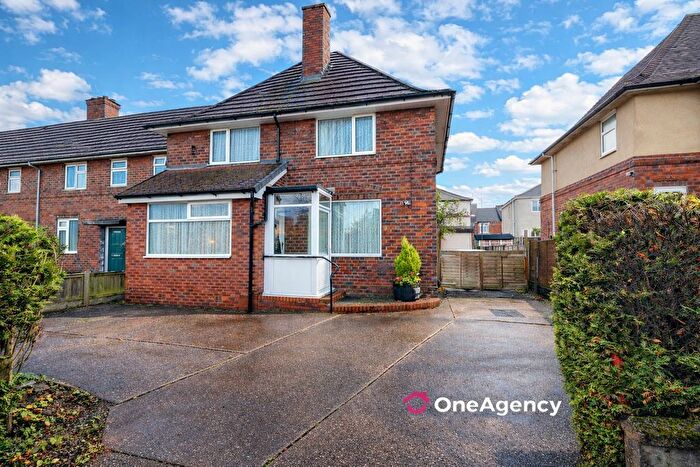
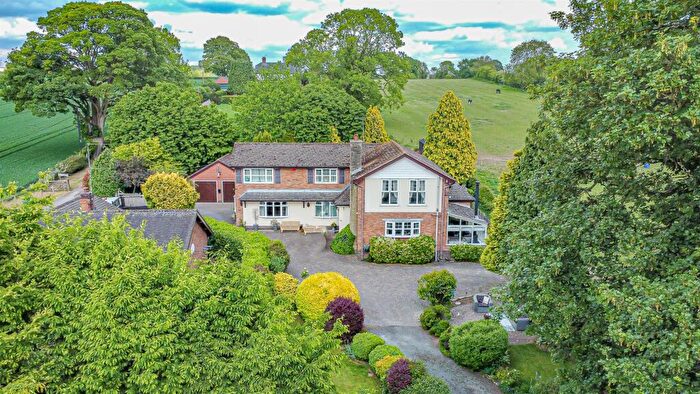
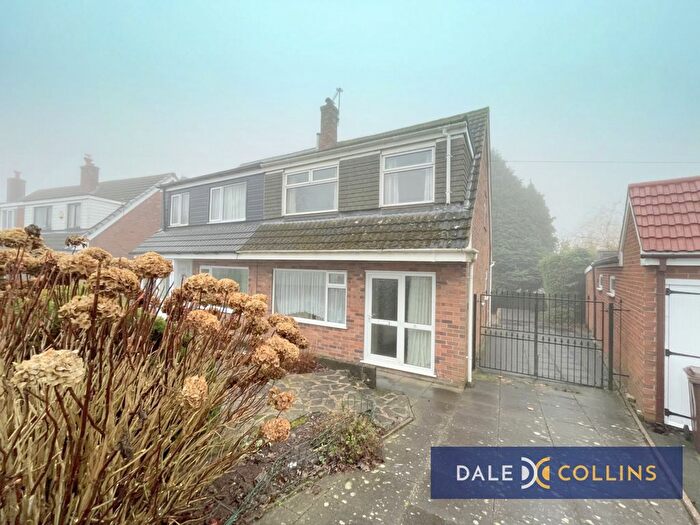
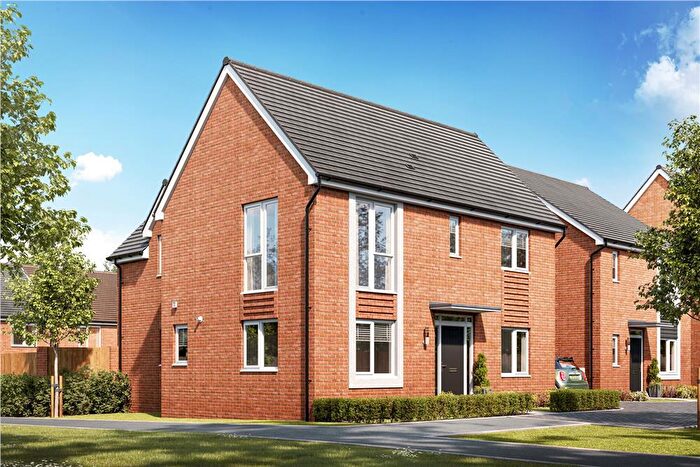
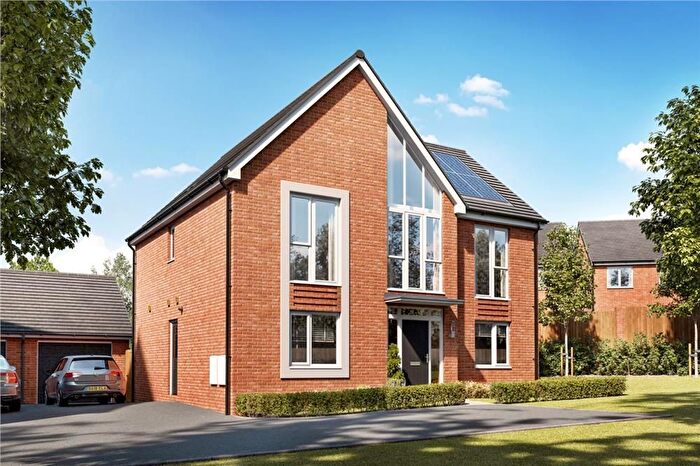
Houses for sale & to rent in Fulford, Stoke-on-trent
House Prices in Fulford
Properties in Fulford have an average house price of £287,295.00 and had 298 Property Transactions within the last 3 years¹.
Fulford is an area in Stoke-on-trent, Staffordshire with 2,432 households², where the most expensive property was sold for £840,000.00.
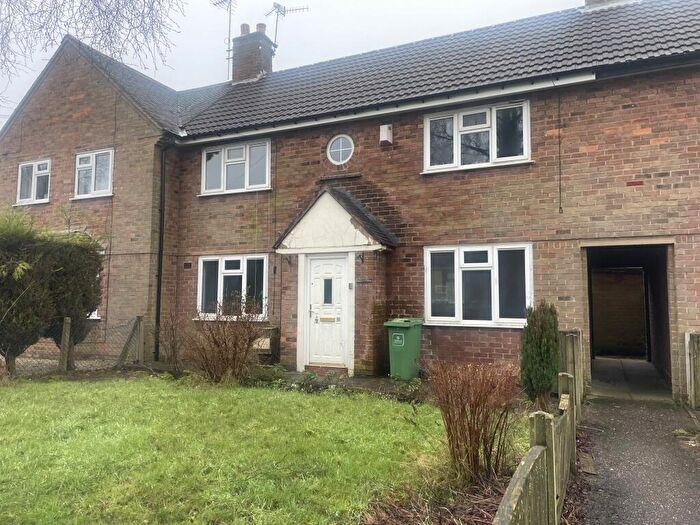
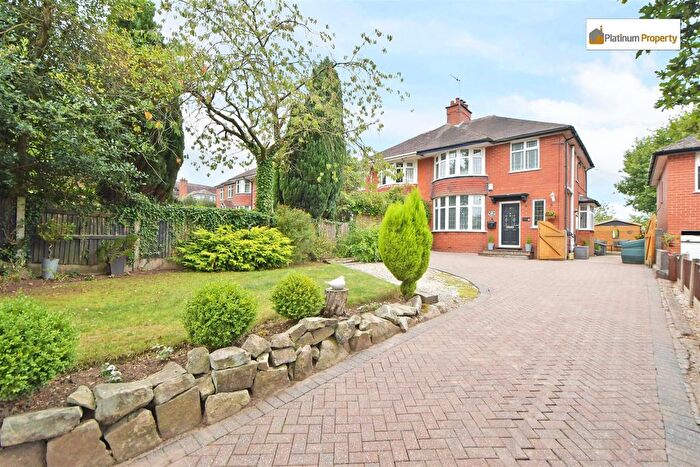
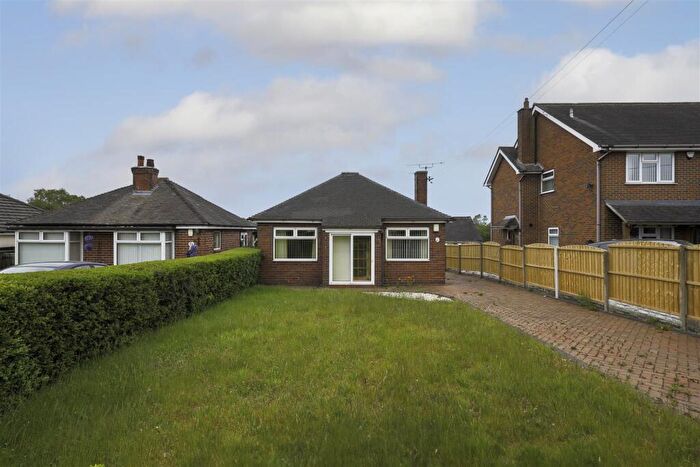
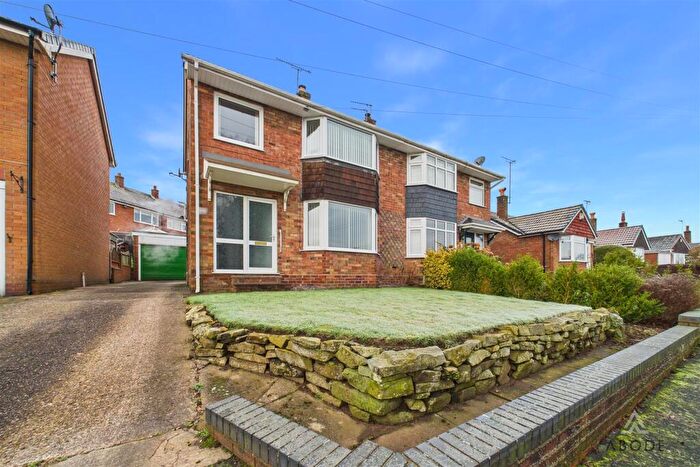
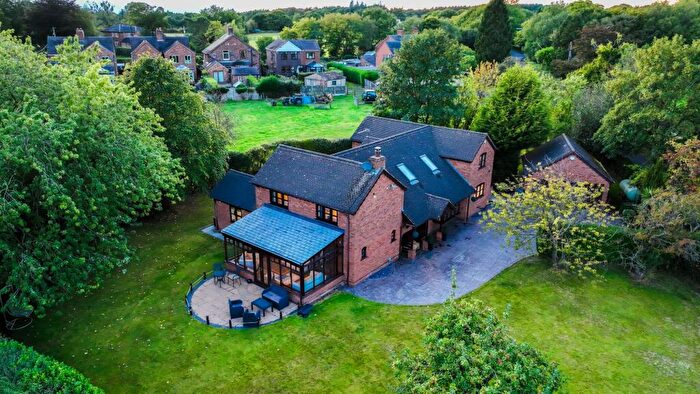
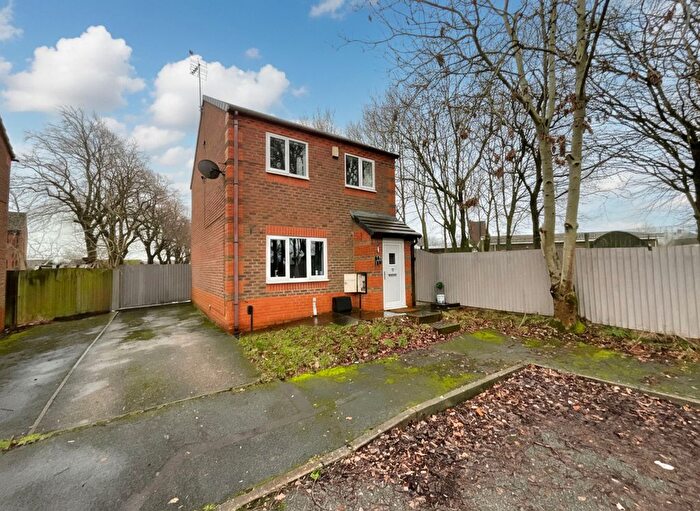
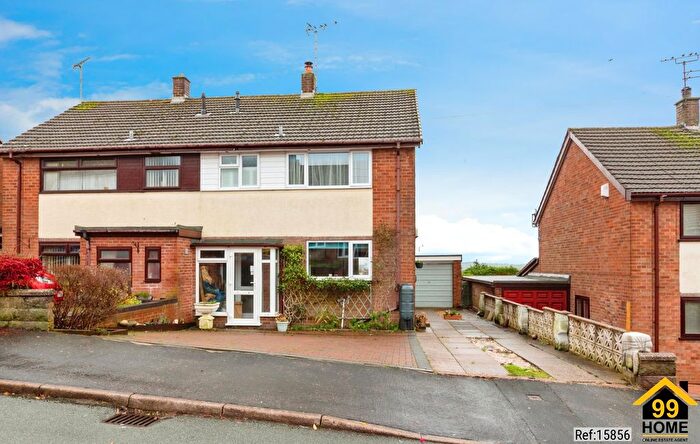
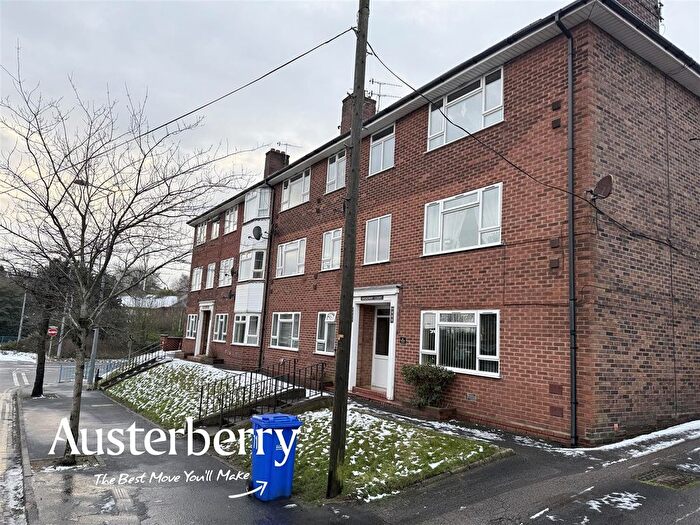
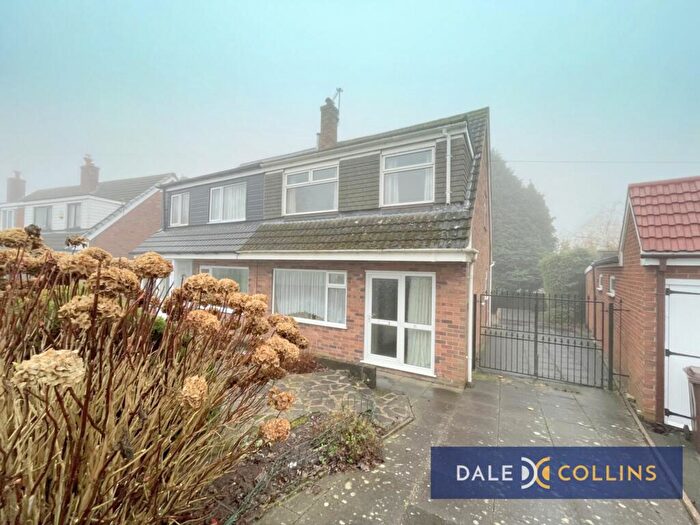
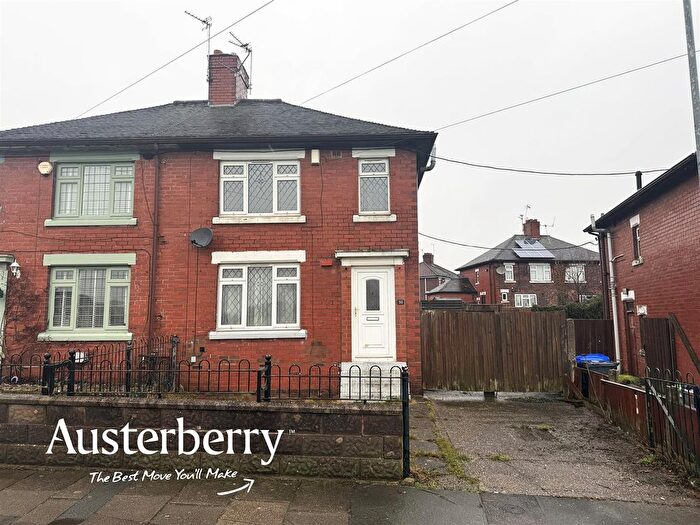
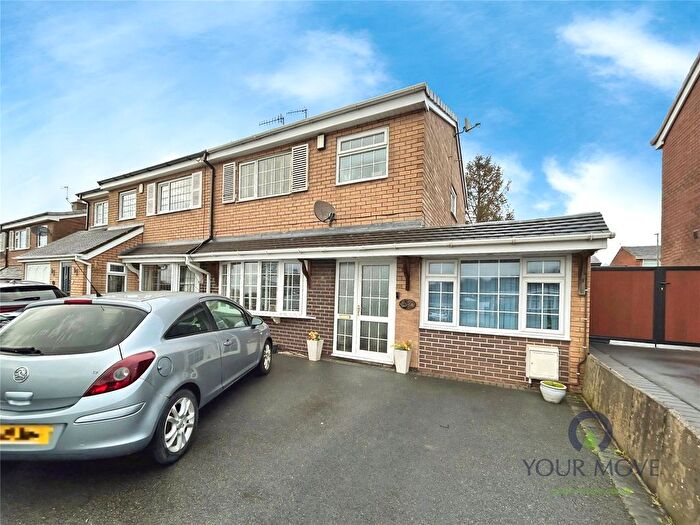
Properties for sale in Fulford
Roads and Postcodes in Fulford
Navigate through our locations to find the location of your next house in Fulford, Stoke-on-trent for sale or to rent.
| Streets | Postcodes |
|---|---|
| Adamthwaite Close | ST11 9HR |
| Adamthwaite Drive | ST11 9HL |
| Anthony Grove | ST3 7PA |
| Argyll Close | ST11 9LA |
| Ash Grove | ST11 9HX |
| Aynsleys Drive | ST11 9HJ ST11 9LR |
| Baulk Lane | ST11 9QU |
| Beaumont Rise | ST11 9TU |
| Bernard Grove | ST3 7NZ |
| Birch Grove | ST3 7JN |
| Birkholme Drive | ST3 7LR ST3 7LS |
| Blacklake Drive | ST3 7JL |
| Blythe Avenue | ST3 7JX ST3 7JY ST3 7JZ |
| Blythe Close | ST11 9HT |
| Brammall Drive | ST11 9HH |
| Calverhay Close | ST11 9JL |
| Cavell Court | ST11 9TR |
| Cedar Court | ST11 9JE |
| Chartley Close | ST11 9LF |
| Cherry Close | ST11 9RY |
| Church Close | ST3 7LQ |
| Churchill Close | ST11 9LE |
| Combe Drive | ST3 7LB |
| Common Lane | ST3 7PE ST3 7PF |
| Dale View Court | ST11 9BA |
| Diamond Close | ST3 7LU |
| Dragons Court | ST3 7PX |
| Fernlea Grove | ST3 7JH |
| Field Close | ST11 9LD |
| Fieldway | ST11 9HS |
| Franklin Drive | ST11 9TN |
| Fulford Dale | ST11 9QP ST11 9QR |
| Fulford Lane | ST11 9BF ST11 9SR |
| Fulford Road | ST11 9QT |
| Galton Croft | ST11 9TQ |
| Golborn Avenue | ST3 7JQ ST3 7LT |
| Golborn Close | ST3 7TT |
| Green Close | ST11 9HW |
| Green Park | ST11 9RT |
| Greenacres Avenue | ST11 9HU |
| Grindley Close | ST11 9LL |
| Grindley Lane | ST11 9JS ST11 9LW ST3 7LN ST3 7LP ST3 7LW ST3 7TA |
| Hartwell Lane | ST3 7NG |
| Heath Grove | ST3 7JT |
| Heather Crescent | ST3 7JJ |
| Heatherlands Close | ST3 7UY |
| High View | ST3 7JS |
| Highfield Close | ST11 9HP |
| Highland Close | ST11 9JZ |
| Highview Road | ST11 9QQ |
| Hilderstone Road | ST3 7NS ST3 7NT ST3 7NU ST3 7NY ST3 7PB ST3 7LL ST3 7NB ST3 7NP |
| Hill Top Crescent | ST3 7NW |
| Hillside Close | ST11 9RU |
| Hoffman Drive | ST11 9TL |
| Hollies Drive | ST3 7JP ST3 7JR |
| Jenner Grove | ST11 9TP |
| Kingfisher Crescent | ST11 9QE |
| Lake Croft Drive | ST3 7SS |
| Lancaster Avenue | ST11 9LP |
| Leadendale Lane | ST3 7NJ ST3 7NL |
| Lightwood Road | ST3 7PW ST3 7PS |
| Lindley Place | ST3 7LX |
| Lister Grove | ST11 9TS |
| Little Lane | ST3 7PN |
| Maisie Way | ST3 7YW |
| Marsh View | ST3 7LA |
| Mayfield Drive | ST11 9JF ST11 9HZ ST11 9JA ST11 9JB |
| Meadow Close | ST11 9LH |
| Meadow Lane | ST11 9RZ |
| Melrose Avenue | ST3 7LY |
| Midway Drive | ST11 9JY |
| Nightingale Walk | ST11 9TW |
| Orchard Rise | ST11 9JX |
| Park View | ST11 9LG |
| Pemberton Drive | ST3 7JU ST3 7LE |
| Pine Court | ST11 9JD |
| Pinetree Drive | ST11 9HF |
| Poplar Drive | ST3 7HH |
| Portland Close | ST11 9JJ |
| Post Office Terrace | ST11 9QS |
| Ridge Crescent | ST3 7LG |
| Ridgway Drive | ST11 9HN |
| Rough Close Common | ST3 4AA |
| Sandon Road | ST3 7LH ST3 7LJ |
| Saverley Green | ST11 9QX |
| South View | ST3 7PD |
| Spring Lodge Avenue | ST11 9SE |
| Springfields | ST11 9LQ |
| Stallington Close | ST11 9QF |
| Stallington Mews | ST11 9TX |
| Stallington Road | ST11 9PA ST11 9PB ST11 9QH ST11 9QJ ST11 9QL ST11 9QN ST11 9QW ST3 7NR |
| Stone Road | ST3 7NH ST3 7NQ ST3 7PT |
| Stonehills Close | ST3 7XE |
| Sunningdale View | ST3 7PY |
| Sutherland Crescent | ST11 9JT ST11 9JU |
| Sycamore Close | ST3 7LD |
| The Gethings | ST11 9JH |
| The Grove | ST11 9LB |
| Tudor Court | ST11 9RX |
| Tudor Hollow | ST11 9NP |
| Uttoxeter Road | ST11 9HY ST11 9JG |
| Weller Close | ST11 9TT |
| West View | ST3 7PH |
| Willow Lane | ST3 7NA |
| Willowcroft Rise | ST11 9ST |
| Willows Drive | ST3 7LZ |
| Windmill Close | ST3 7PU |
| Windmill Hill | ST3 7PG ST3 7PJ ST3 7PL ST3 7PP ST3 7PQ ST3 7PR |
| Woodlands Grove | ST3 7NX |
| Woodside Drive | ST3 7JW |
| York Avenue | ST11 9SB |
| ST11 9FF |
Transport near Fulford
- FAQ
- Price Paid By Year
- Property Type Price
Frequently asked questions about Fulford
What is the average price for a property for sale in Fulford?
The average price for a property for sale in Fulford is £287,295. This amount is 22% higher than the average price in Stoke-on-trent. There are 3,031 property listings for sale in Fulford.
What streets have the most expensive properties for sale in Fulford?
The streets with the most expensive properties for sale in Fulford are Fulford Road at an average of £661,250, Galton Croft at an average of £635,000 and Nightingale Walk at an average of £618,000.
What streets have the most affordable properties for sale in Fulford?
The streets with the most affordable properties for sale in Fulford are Lister Grove at an average of £133,500, Blythe Close at an average of £140,000 and Dale View Court at an average of £147,928.
Which train stations are available in or near Fulford?
Some of the train stations available in or near Fulford are Blythe Bridge, Longton and Stone.
Property Price Paid in Fulford by Year
The average sold property price by year was:
| Year | Average Sold Price | Price Change |
Sold Properties
|
|---|---|---|---|
| 2025 | £317,845 | 10% |
62 Properties |
| 2024 | £286,715 | 2% |
83 Properties |
| 2023 | £280,885 | 4% |
70 Properties |
| 2022 | £270,460 | 5% |
83 Properties |
| 2021 | £257,198 | 5% |
115 Properties |
| 2020 | £245,408 | 3% |
92 Properties |
| 2019 | £238,136 | -3% |
87 Properties |
| 2018 | £245,440 | 10% |
102 Properties |
| 2017 | £220,190 | 2% |
95 Properties |
| 2016 | £215,283 | 3% |
98 Properties |
| 2015 | £209,399 | 10% |
97 Properties |
| 2014 | £188,899 | 9% |
107 Properties |
| 2013 | £172,048 | -13% |
67 Properties |
| 2012 | £194,425 | 2% |
64 Properties |
| 2011 | £190,941 | 3% |
45 Properties |
| 2010 | £184,321 | 2% |
50 Properties |
| 2009 | £179,780 | -8% |
45 Properties |
| 2008 | £194,886 | -16% |
53 Properties |
| 2007 | £226,711 | -1% |
118 Properties |
| 2006 | £228,488 | 14% |
117 Properties |
| 2005 | £196,221 | 14% |
129 Properties |
| 2004 | £169,108 | 13% |
124 Properties |
| 2003 | £147,115 | 24% |
86 Properties |
| 2002 | £111,561 | 15% |
94 Properties |
| 2001 | £94,780 | -0,1% |
97 Properties |
| 2000 | £94,892 | 13% |
99 Properties |
| 1999 | £82,469 | 9% |
84 Properties |
| 1998 | £74,767 | 1% |
79 Properties |
| 1997 | £74,193 | 16% |
93 Properties |
| 1996 | £62,124 | 3% |
58 Properties |
| 1995 | £59,983 | - |
54 Properties |
Property Price per Property Type in Fulford
Here you can find historic sold price data in order to help with your property search.
The average Property Paid Price for specific property types in the last three years are:
| Property Type | Average Sold Price | Sold Properties |
|---|---|---|
| Semi Detached House | £231,224.00 | 115 Semi Detached Houses |
| Detached House | £368,239.00 | 141 Detached Houses |
| Terraced House | £184,562.00 | 32 Terraced Houses |
| Flat | £119,550.00 | 10 Flats |

