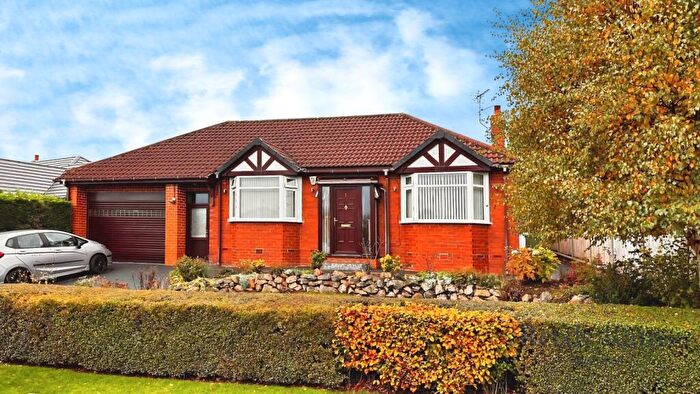
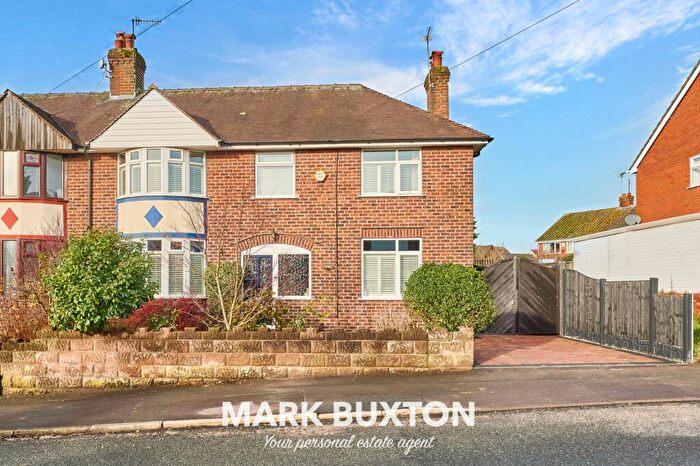
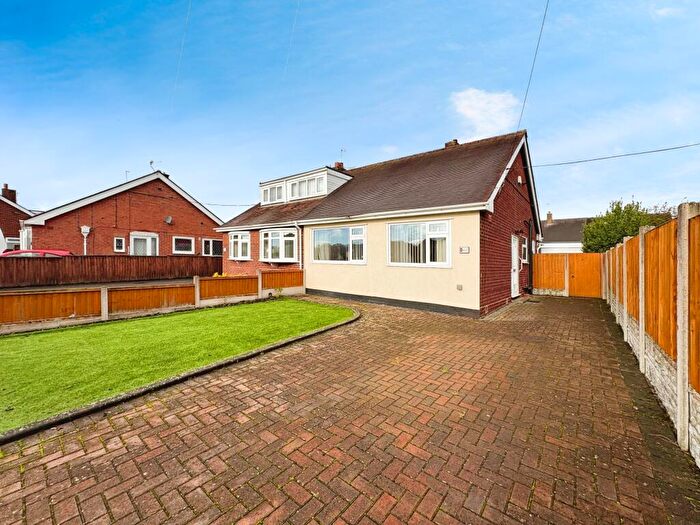
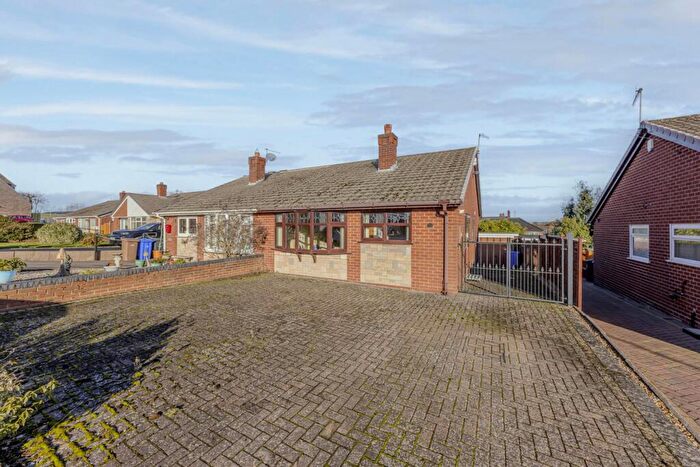
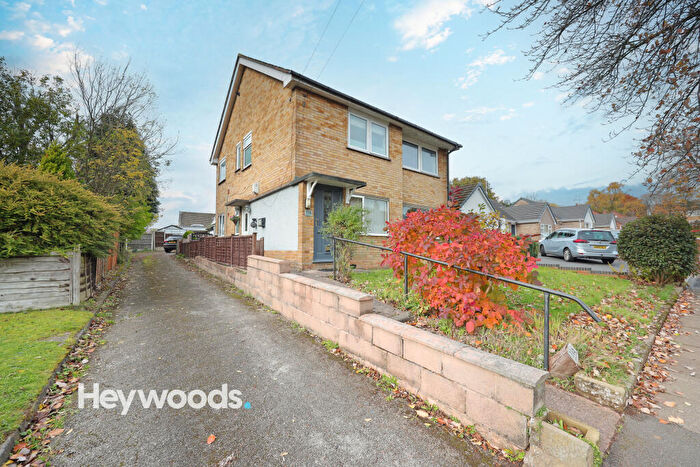
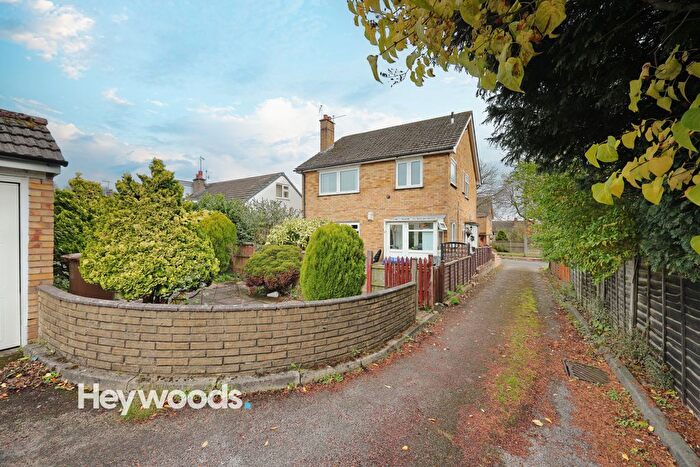
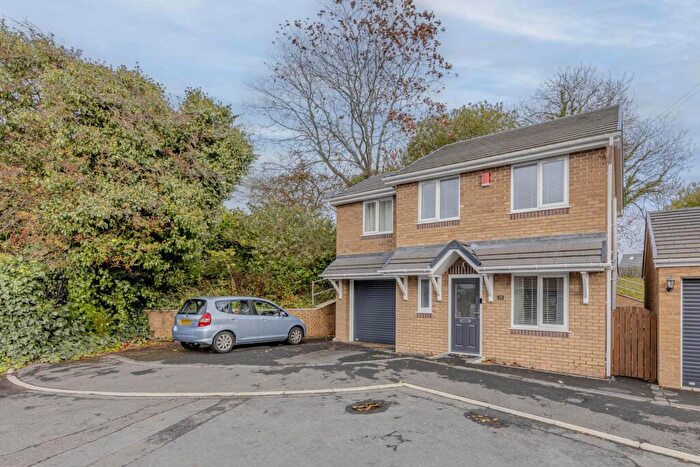
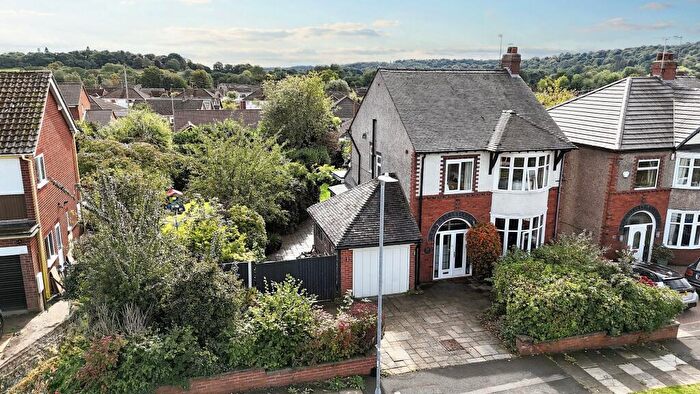
Houses for sale & to rent in Swynnerton, Stoke-on-trent
House Prices in Swynnerton
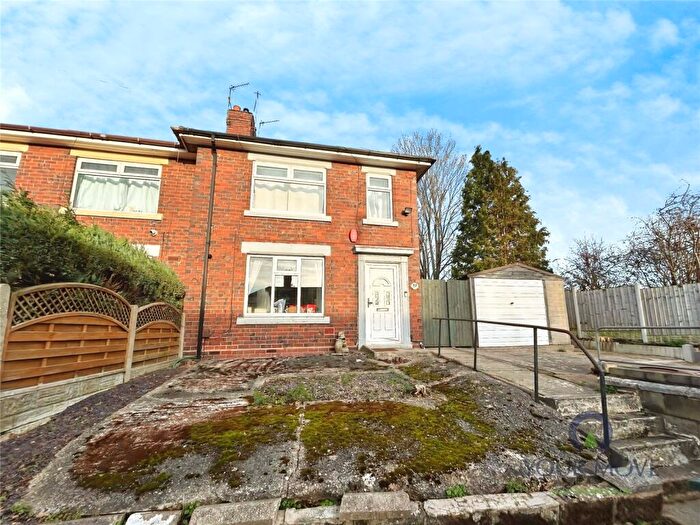
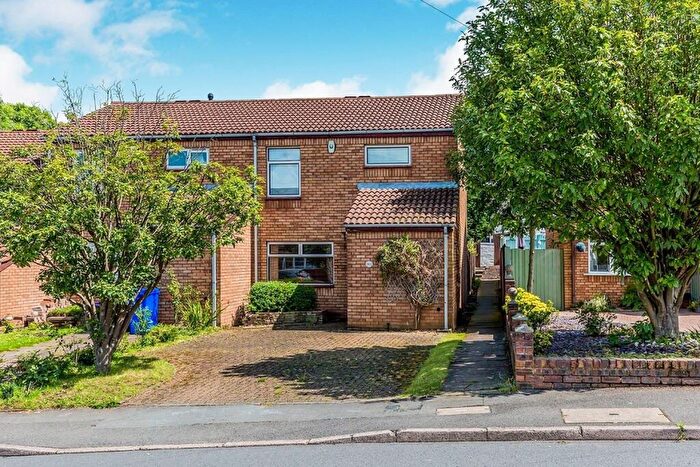
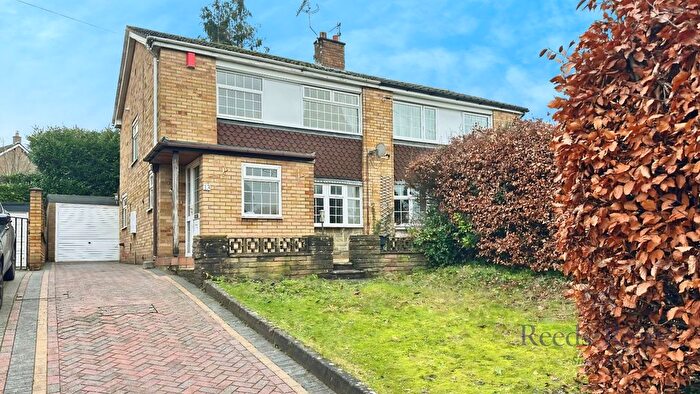
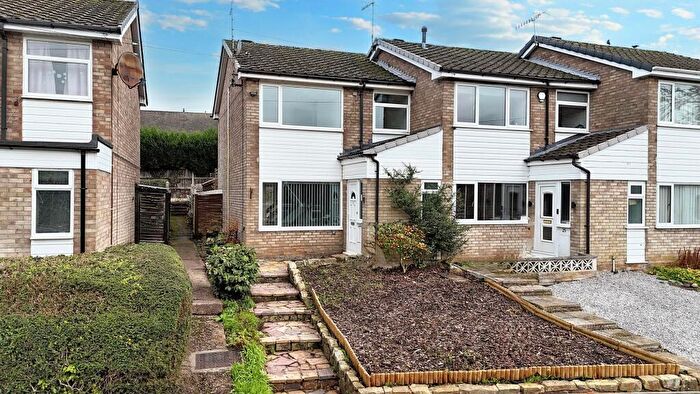
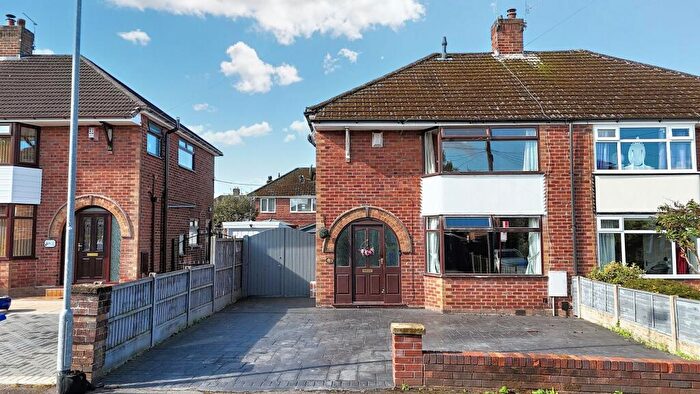
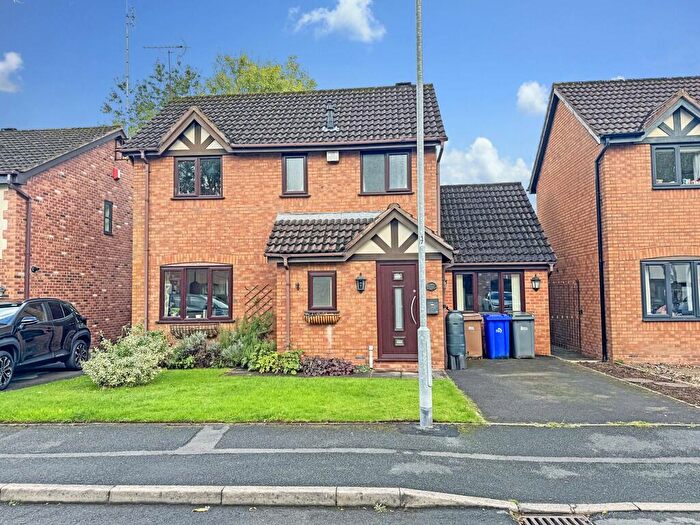
Properties in Swynnerton have an average house price of £311,370.00 and had 82 Property Transactions within the last 3 years¹.
Swynnerton is an area in Stoke-on-trent, Staffordshire with 783 households², where the most expensive property was sold for £1,250,000.00.
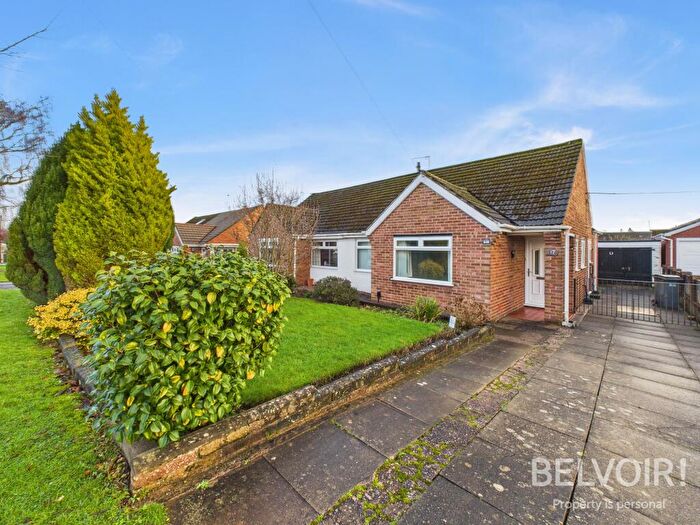
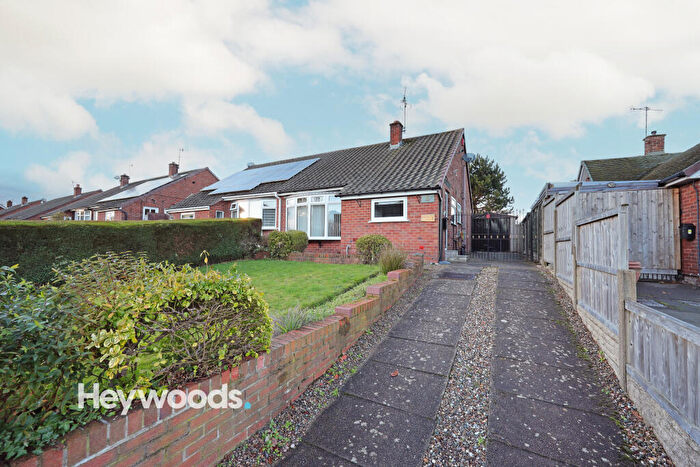
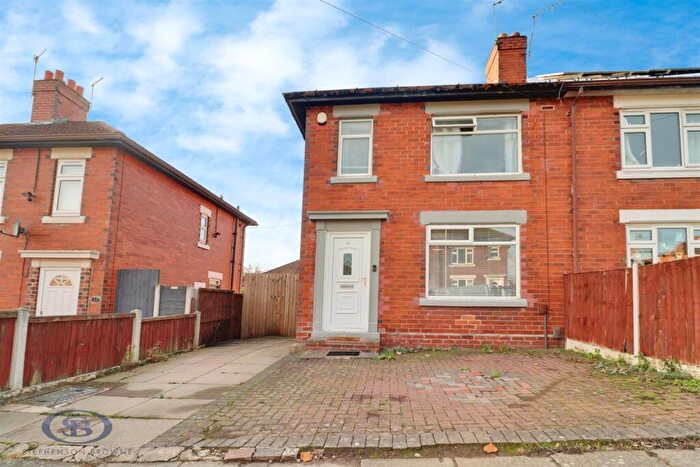
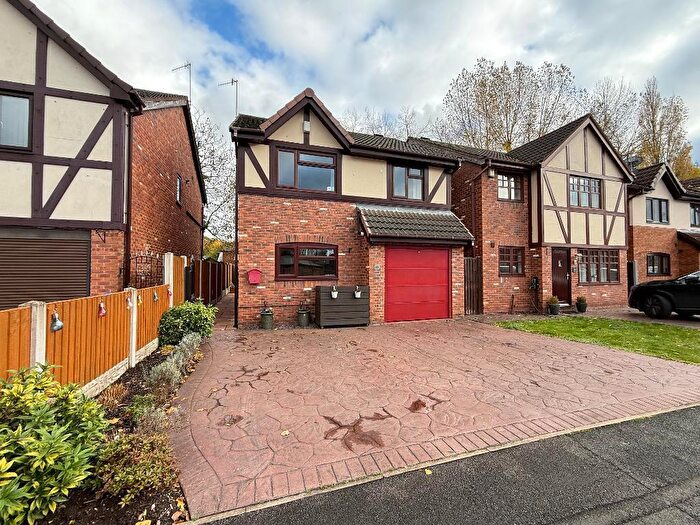
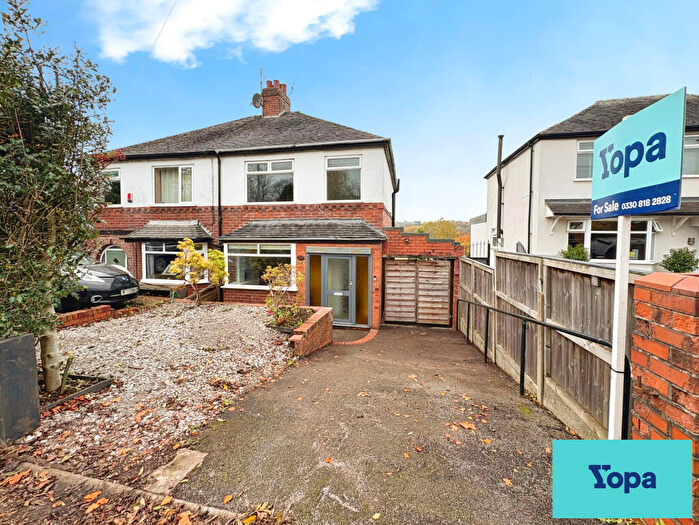
Properties for sale in Swynnerton
Roads and Postcodes in Swynnerton
Navigate through our locations to find the location of your next house in Swynnerton, Stoke-on-trent for sale or to rent.
| Streets | Postcodes |
|---|---|
| Apsley Grove | ST12 9JF |
| Beech Dale Lane | ST4 8SH |
| Beech Lane | ST4 8SF |
| Beechcliffe Lane | ST12 9HP |
| Bluebell Close | ST12 9JP |
| Bracken Close | ST12 9JD |
| Chase Lane | ST12 9HH |
| Copeland Avenue | ST12 9JA |
| Cranwood Road | ST12 9JE |
| Drayton Road | ST4 8SN |
| Fairway | ST4 8AS |
| Field Rise Road | ST12 9JY |
| Greenway | ST4 8AN ST4 8AW |
| Groundslow Mews | ST12 9HL |
| Hanchurch Fields | ST4 8SA |
| Hanchurch Lane | ST4 8RY |
| Harley Thorn Lane | ST4 8SL |
| Holly Bank | ST4 8FT |
| Knowl Wall | ST4 8SE |
| Manor Farm Drive | ST12 9JR |
| Mill Court | ST4 8FE |
| Monument Lane | ST12 9JH |
| Park Drive | ST4 8AB |
| Parkway | ST4 8AG ST4 8AJ ST4 8AR |
| Peacock Lane | ST4 8RZ |
| Potters Croft | ST12 9HB |
| Ridding Bank | ST4 8SB |
| Stone Road | ST12 9HA ST12 9HE ST12 9HF ST12 9HR ST12 9JJ ST4 8AA |
| Sutherland Road | ST12 9JQ |
| The Fieldway | ST4 8AH ST4 8AQ |
| Top Lane | ST4 8SJ |
| Trentham Court | ST4 8FB |
| Trentham Park | ST4 8AE |
| Vicarage Crescent | ST12 9JB |
| Whitmore Road | ST4 8AL ST4 8AP ST4 8AT |
| Winghouse Lane | ST12 9HJ ST12 9HN ST12 9HW ST12 9JG |
| ST4 8SD |
Transport near Swynnerton
- FAQ
- Price Paid By Year
- Property Type Price
Frequently asked questions about Swynnerton
What is the average price for a property for sale in Swynnerton?
The average price for a property for sale in Swynnerton is £311,370. This amount is 32% higher than the average price in Stoke-on-trent. There are 894 property listings for sale in Swynnerton.
What streets have the most expensive properties for sale in Swynnerton?
The streets with the most expensive properties for sale in Swynnerton are Hanchurch Lane at an average of £613,350, Knowl Wall at an average of £570,000 and The Fieldway at an average of £440,000.
What streets have the most affordable properties for sale in Swynnerton?
The streets with the most affordable properties for sale in Swynnerton are Mill Court at an average of £123,166, Manor Farm Drive at an average of £134,833 and Sutherland Road at an average of £205,666.
Which train stations are available in or near Swynnerton?
Some of the train stations available in or near Swynnerton are Stone, Longton and Stoke-On-Trent.
Property Price Paid in Swynnerton by Year
The average sold property price by year was:
| Year | Average Sold Price | Price Change |
Sold Properties
|
|---|---|---|---|
| 2025 | £332,986 | 14% |
11 Properties |
| 2024 | £285,194 | -15% |
18 Properties |
| 2023 | £329,351 | 8% |
27 Properties |
| 2022 | £301,673 | -15% |
26 Properties |
| 2021 | £346,408 | 17% |
37 Properties |
| 2020 | £288,215 | 6% |
26 Properties |
| 2019 | £271,440 | -9% |
25 Properties |
| 2018 | £296,323 | 7% |
17 Properties |
| 2017 | £275,665 | -11% |
30 Properties |
| 2016 | £306,282 | 23% |
31 Properties |
| 2015 | £236,429 | -6% |
35 Properties |
| 2014 | £251,016 | 11% |
31 Properties |
| 2013 | £222,760 | -5% |
32 Properties |
| 2012 | £234,650 | 12% |
20 Properties |
| 2011 | £205,500 | -25% |
10 Properties |
| 2010 | £257,315 | 15% |
26 Properties |
| 2009 | £219,750 | -12% |
12 Properties |
| 2008 | £245,478 | 12% |
23 Properties |
| 2007 | £215,371 | -7% |
59 Properties |
| 2006 | £229,959 | -9% |
42 Properties |
| 2005 | £249,673 | -8% |
34 Properties |
| 2004 | £270,723 | 20% |
45 Properties |
| 2003 | £216,905 | 25% |
27 Properties |
| 2002 | £162,149 | 6% |
34 Properties |
| 2001 | £152,916 | 20% |
35 Properties |
| 2000 | £122,641 | 29% |
31 Properties |
| 1999 | £87,595 | -10% |
23 Properties |
| 1998 | £96,620 | 6% |
42 Properties |
| 1997 | £90,602 | 13% |
35 Properties |
| 1996 | £78,914 | 9% |
24 Properties |
| 1995 | £71,636 | - |
15 Properties |
Property Price per Property Type in Swynnerton
Here you can find historic sold price data in order to help with your property search.
The average Property Paid Price for specific property types in the last three years are:
| Property Type | Average Sold Price | Sold Properties |
|---|---|---|
| Semi Detached House | £279,966.00 | 30 Semi Detached Houses |
| Detached House | £382,829.00 | 36 Detached Houses |
| Terraced House | £300,500.00 | 6 Terraced Houses |
| Flat | £154,850.00 | 10 Flats |

