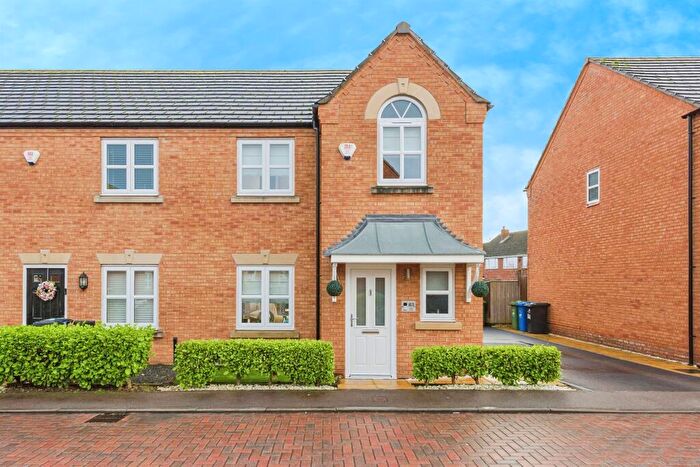
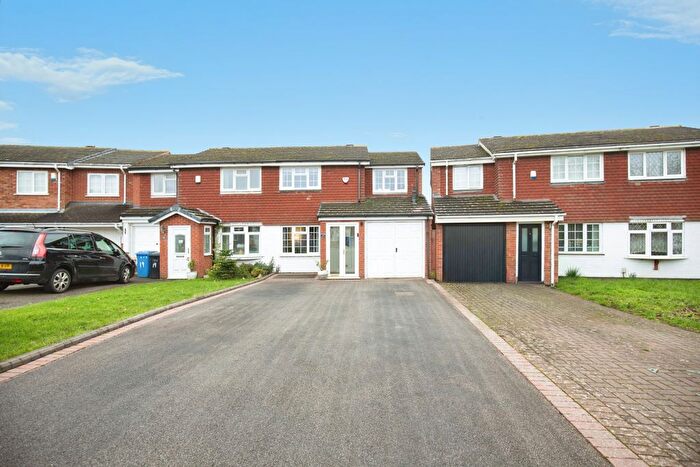
Houses for sale & to rent in Belgrave, Tamworth
House Prices in Belgrave
Properties in Belgrave have an average house price of £215,566.00 and had 263 Property Transactions within the last 3 years¹.
Belgrave is an area in Tamworth, Staffordshire with 2,953 households², where the most expensive property was sold for £490,000.00.
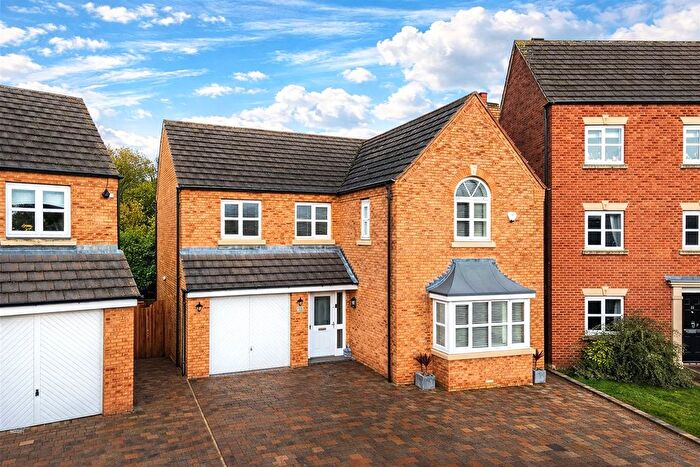
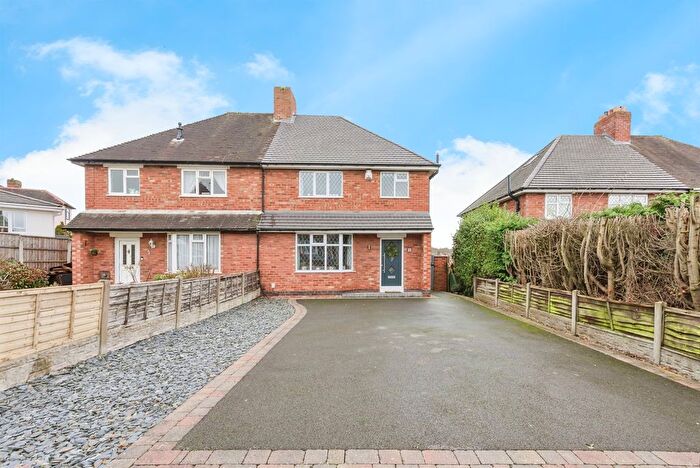
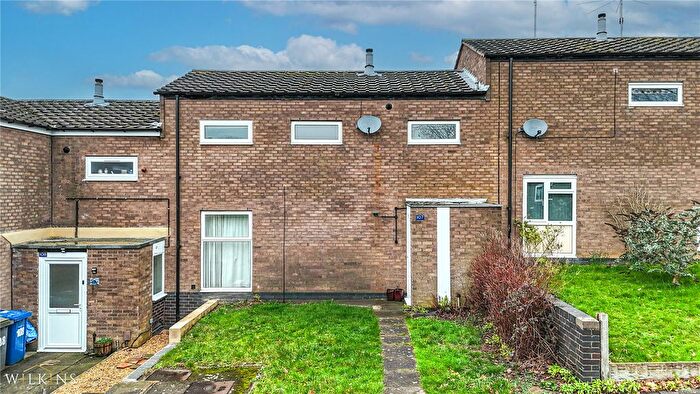
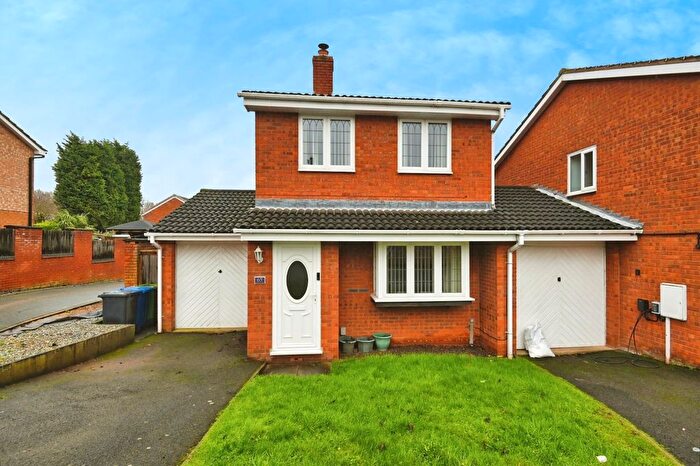
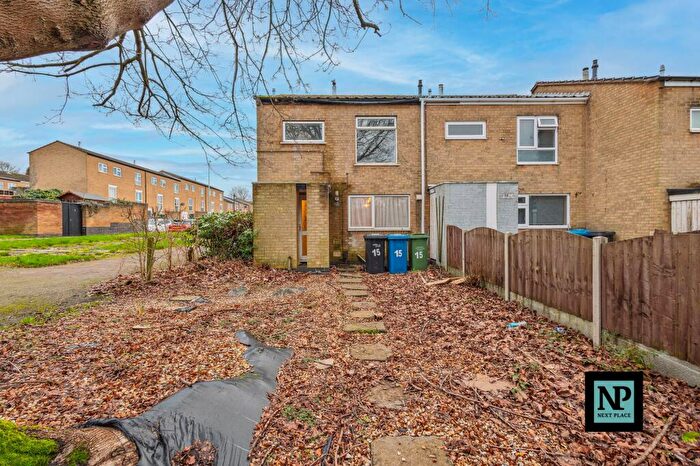
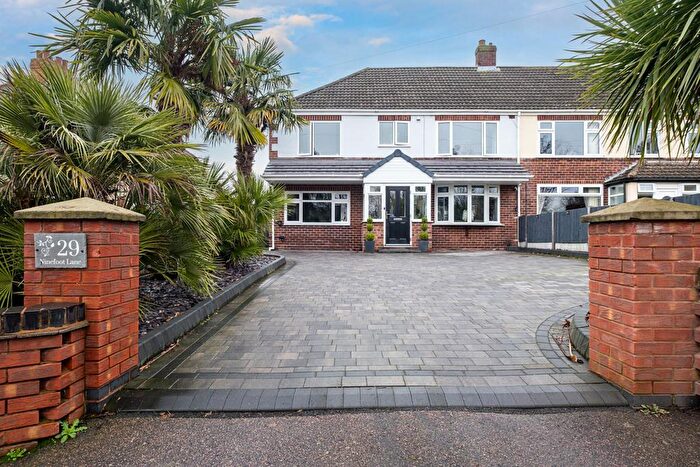
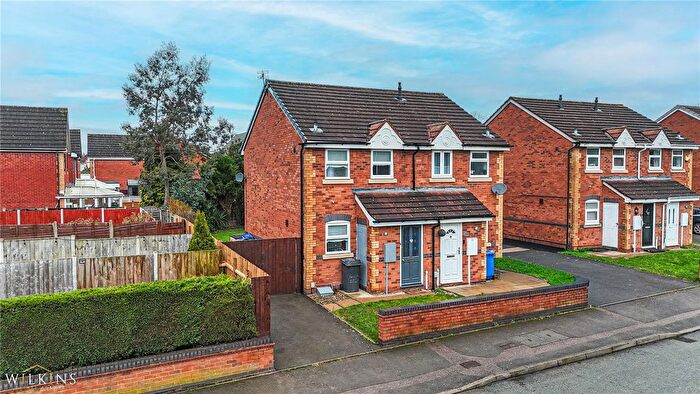
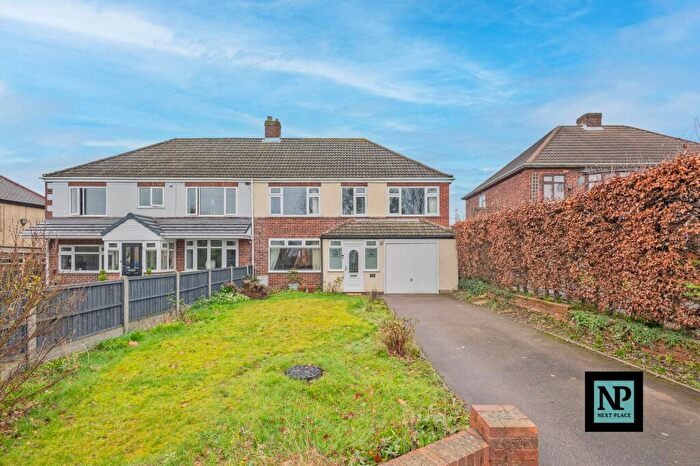
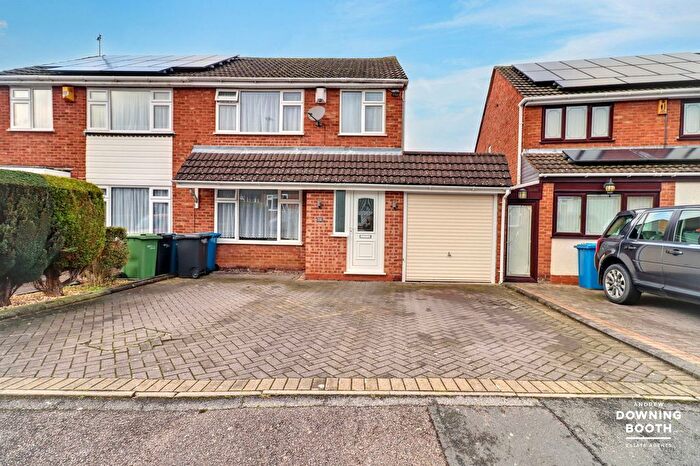
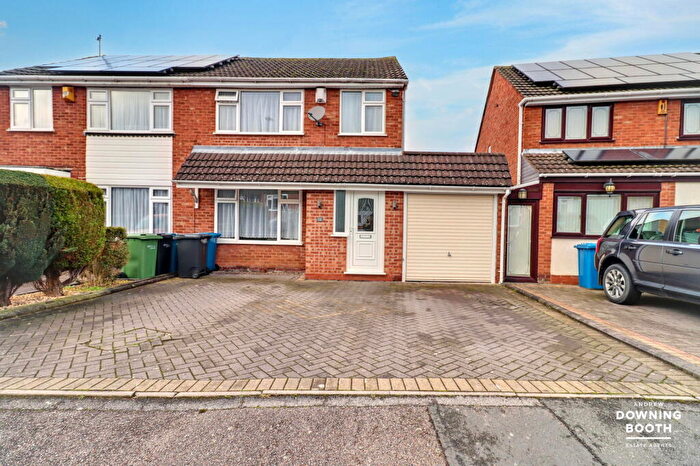
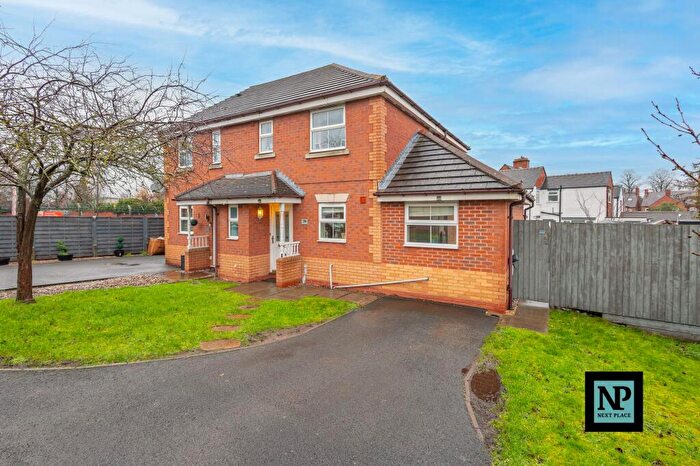
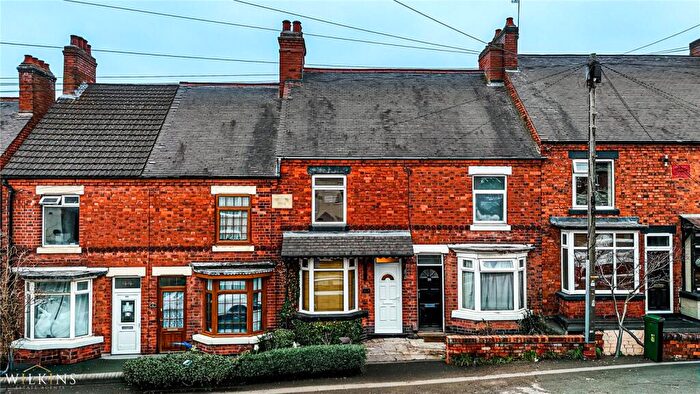
Properties for sale in Belgrave
Roads and Postcodes in Belgrave
Navigate through our locations to find the location of your next house in Belgrave, Tamworth for sale or to rent.
| Streets | Postcodes |
|---|---|
| Allard | B77 2RA |
| Allensmead | B77 1DP |
| Alvie Walk | B77 2UA |
| Ashleigh Drive | B77 2LT B77 2LX |
| Barnbridge | B77 1DE B77 1DF |
| Beauchamp Industrial Park | B77 5BZ |
| Belgrave Road | B77 2LN B77 2LS B77 2LW |
| Belsize | B77 2RB |
| Birds Bush Road | B77 2NE |
| Bramber | B77 2LL |
| Bright Crescent | B77 1DD |
| Broadsmeath | B77 1DG B77 1DQ |
| Cale Close | B77 1DB |
| Cherwell | B77 2LJ |
| Colbrook | B77 2LH |
| Cowley | B77 2RD |
| Cringlebrook | B77 2NG B77 2NQ |
| Croft Close | B77 1BF B77 1BP |
| Dennis | B77 2RE |
| Derwent | B77 2LD |
| Draycott Crescent | B77 1DA |
| Exley | B77 2LA |
| Fenn Street | B77 2LP |
| Field Close | B77 1BW |
| Field Farm Road | B77 2QJ |
| Garten Close | B77 2TR |
| Gowan Close | B77 2TN |
| Greatmead | B77 1DL |
| Hamble | B77 2JE B77 2JF |
| Harport Close | B77 2TS |
| Harrow Close | B77 2TP |
| Hayle | B77 2JR B77 2JS |
| Healey | B77 2RF |
| Hillman | B77 2RG |
| Hilmore Way | B77 2NY |
| Holsworth Close | B77 2JD |
| Honeybourne | B77 2JG B77 2JQ |
| Irwell | B77 2JH B77 2JJ |
| Jaguar | B77 2RQ |
| Jensen | B77 2RH |
| Jowett | B77 2RJ |
| Kennet | B77 2JP |
| Laggan Close | B77 2TZ |
| Lagonda | B77 2RY |
| Launceston Close | B77 2JB |
| Leven Road | B77 2TG B77 2TH B77 2TX |
| Leyland Road | B77 2SA |
| Lindores Road | B77 2TQ |
| Lomita Crescent | B77 2LR |
| Lotus | B77 2RZ |
| Lowerpark | B77 1DJ |
| Lowes Drive | B77 2TF B77 2TT B77 2TU |
| Lyon Drive | B77 2TD B77 2TJ B77 2TL B77 2TE |
| Maree Walk | B77 2TW |
| Marlborough Way | B77 2NW |
| Medina | B77 2JL |
| Medway | B77 2JN B77 2JW |
| Morton Close | B77 2TY |
| Napier | B77 2RN |
| Ninefoot Lane | B77 2NA |
| Ninefoot Rise | B77 2PE |
| Nymet | B77 2NX |
| Park Farm Road | B77 1DX |
| Parkside | B77 2JU |
| Purbrook | B77 2NB |
| Redlake | B77 2ND |
| Riley | B77 2RW |
| Romney | B77 2NH |
| Rothay | B77 2NJ |
| Ryton | B77 2NL |
| Seaton | B77 2NP |
| St Peters Close | B77 1BX |
| Stonepit | B77 1DN B77 1DW |
| Sunbeam | B77 2RR |
| Swift | B77 2RP |
| Talbot | B77 2RS |
| Tamworth Road | B77 1BT B77 1BU B77 1BY B77 1BZ B77 1DH B77 1BS |
| Tarrant | B77 2NR |
| Thornby Avenue | B77 2LU |
| Thurne | B77 2NT |
| Triumph | B77 2RT |
| Trojan | B77 2RU |
| Wandsbeck | B77 2NU |
| Watling Street | B77 5AB B77 5BH |
| Waveney | B77 2NS |
| Wilnecote Lane | B77 2JA B77 2LE B77 2LF B77 2LG B77 2LQ B77 2LY B77 2LZ B77 2LB |
| Wolseley | B77 2RX |
Transport near Belgrave
- FAQ
- Price Paid By Year
- Property Type Price
Frequently asked questions about Belgrave
What is the average price for a property for sale in Belgrave?
The average price for a property for sale in Belgrave is £215,566. This amount is 16% lower than the average price in Tamworth. There are 1,567 property listings for sale in Belgrave.
What streets have the most expensive properties for sale in Belgrave?
The streets with the most expensive properties for sale in Belgrave are Ninefoot Rise at an average of £354,000, Cale Close at an average of £340,000 and Lindores Road at an average of £295,666.
What streets have the most affordable properties for sale in Belgrave?
The streets with the most affordable properties for sale in Belgrave are Maree Walk at an average of £100,000, Hayle at an average of £126,800 and Honeybourne at an average of £129,887.
Which train stations are available in or near Belgrave?
Some of the train stations available in or near Belgrave are Wilnecote, Tamworth Low Level and Polesworth.
Property Price Paid in Belgrave by Year
The average sold property price by year was:
| Year | Average Sold Price | Price Change |
Sold Properties
|
|---|---|---|---|
| 2025 | £225,455 | 12% |
77 Properties |
| 2024 | £198,445 | -14% |
100 Properties |
| 2023 | £226,621 | 1% |
86 Properties |
| 2022 | £223,257 | 12% |
106 Properties |
| 2021 | £197,099 | 1% |
158 Properties |
| 2020 | £195,615 | -3% |
92 Properties |
| 2019 | £201,666 | 10% |
119 Properties |
| 2018 | £181,931 | -6% |
129 Properties |
| 2017 | £193,386 | 12% |
147 Properties |
| 2016 | £169,275 | 19% |
134 Properties |
| 2015 | £137,796 | 2% |
102 Properties |
| 2014 | £134,543 | -8% |
89 Properties |
| 2013 | £145,931 | 3% |
90 Properties |
| 2012 | £140,964 | -1% |
70 Properties |
| 2011 | £143,018 | -6% |
73 Properties |
| 2010 | £151,508 | -2% |
82 Properties |
| 2009 | £154,929 | 21% |
106 Properties |
| 2008 | £122,527 | -1% |
45 Properties |
| 2007 | £123,837 | -1% |
121 Properties |
| 2006 | £125,454 | -4% |
122 Properties |
| 2005 | £130,893 | 8% |
116 Properties |
| 2004 | £120,135 | 23% |
125 Properties |
| 2003 | £93,017 | 20% |
110 Properties |
| 2002 | £74,160 | 11% |
131 Properties |
| 2001 | £66,181 | 10% |
100 Properties |
| 2000 | £59,574 | 6% |
112 Properties |
| 1999 | £56,199 | 10% |
106 Properties |
| 1998 | £50,791 | 8% |
96 Properties |
| 1997 | £46,594 | 10% |
122 Properties |
| 1996 | £41,724 | -2% |
82 Properties |
| 1995 | £42,635 | - |
113 Properties |
Property Price per Property Type in Belgrave
Here you can find historic sold price data in order to help with your property search.
The average Property Paid Price for specific property types in the last three years are:
| Property Type | Average Sold Price | Sold Properties |
|---|---|---|
| Semi Detached House | £228,335.00 | 106 Semi Detached Houses |
| Detached House | £333,216.00 | 31 Detached Houses |
| Terraced House | £180,741.00 | 111 Terraced Houses |
| Flat | £139,896.00 | 15 Flats |

