
Houses for sale & to rent in Tamworth, Staffordshire
House Prices in Tamworth
Properties in Tamworth have an average house price of £257k and had 3,373 Property Transactions within the last 3 years.¹
Tamworth is an area in Staffordshire with 35,427 households², where the most expensive property was sold for £1.8M.
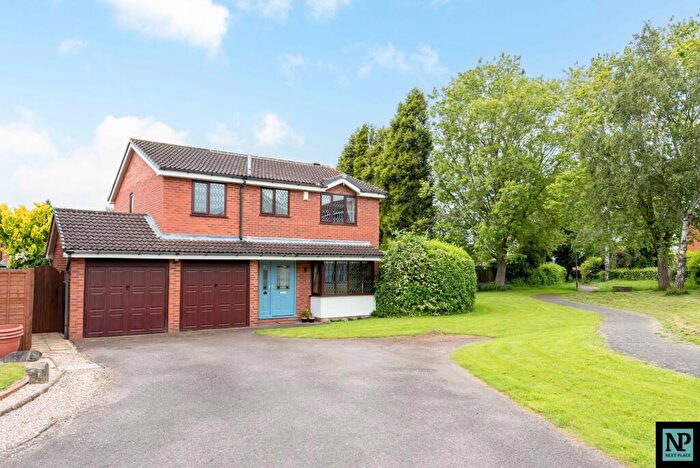
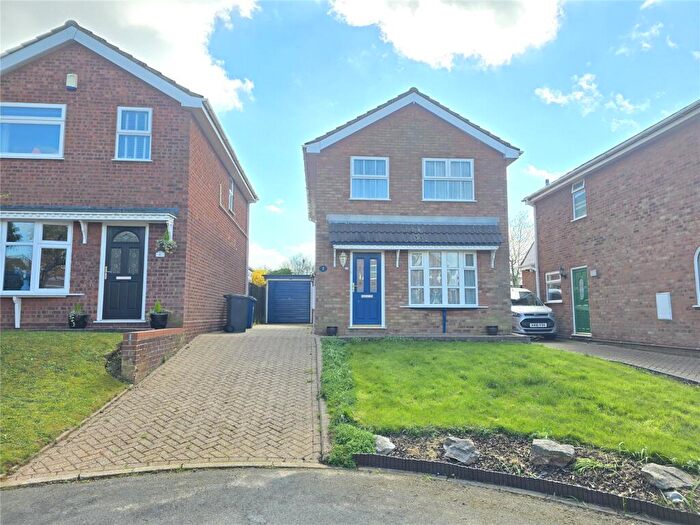
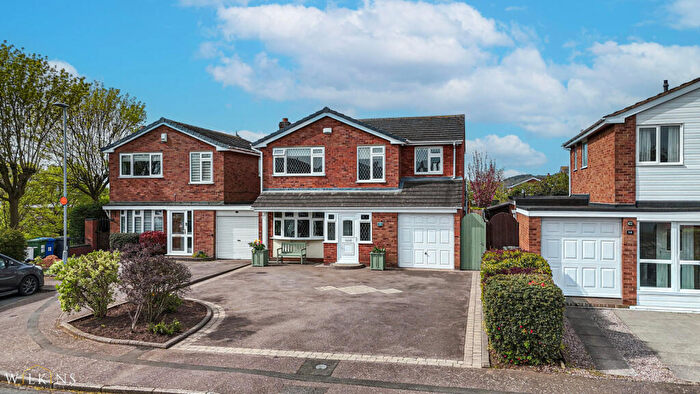
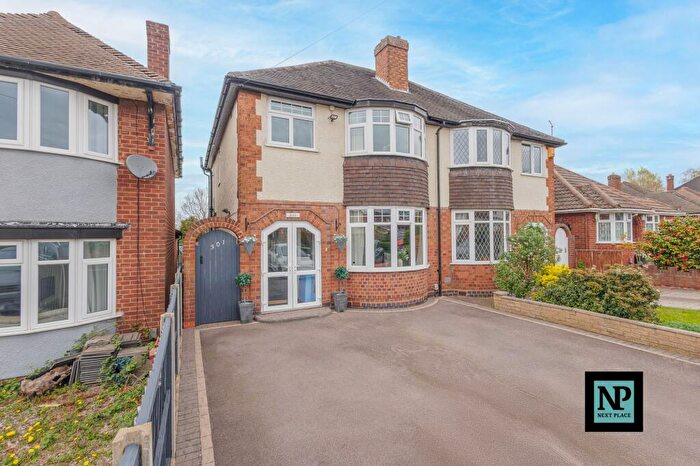
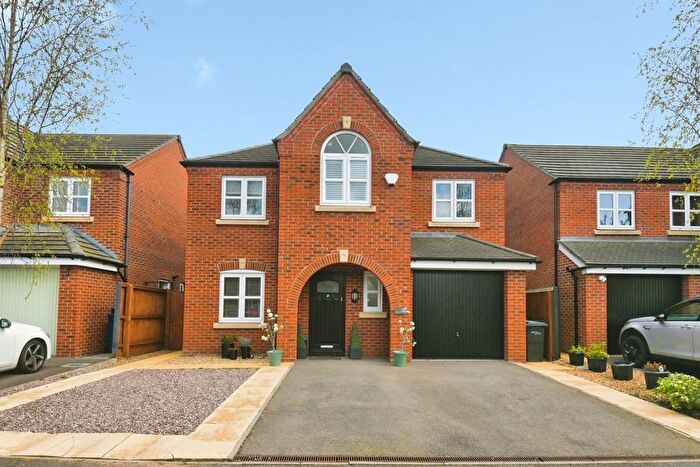
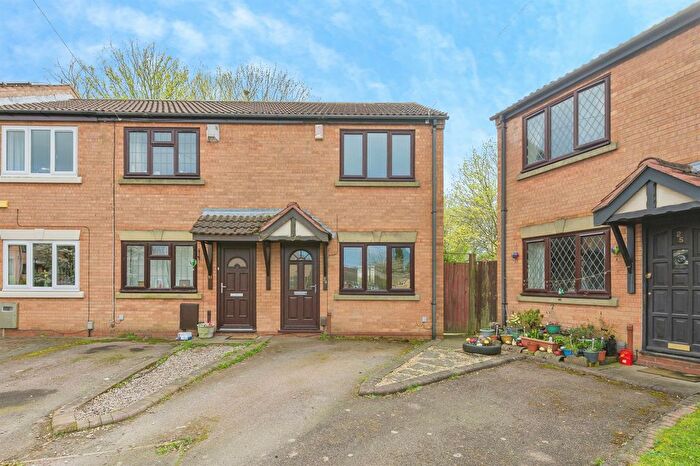
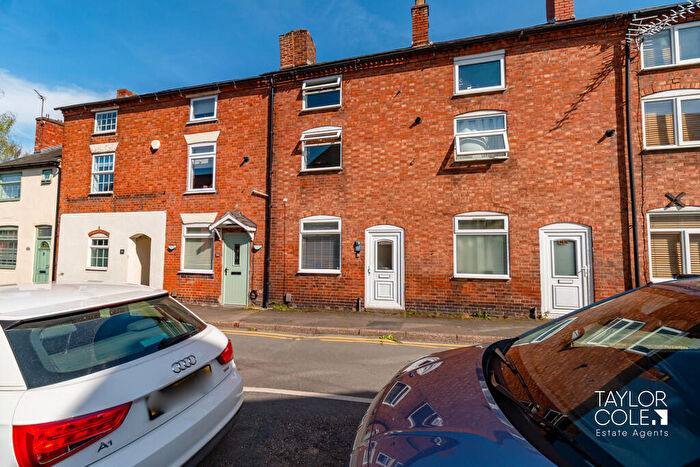
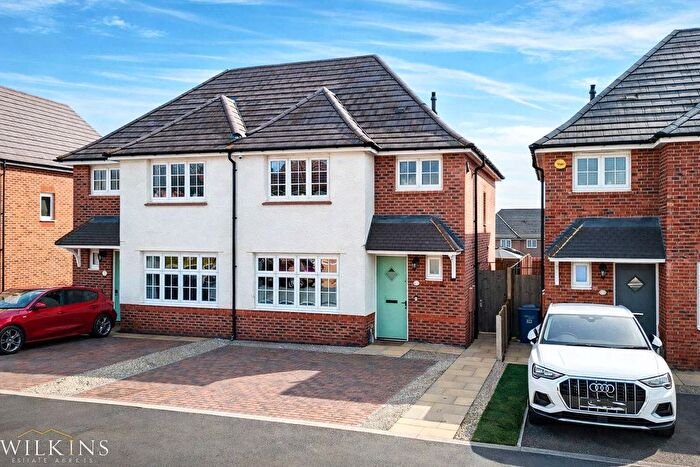
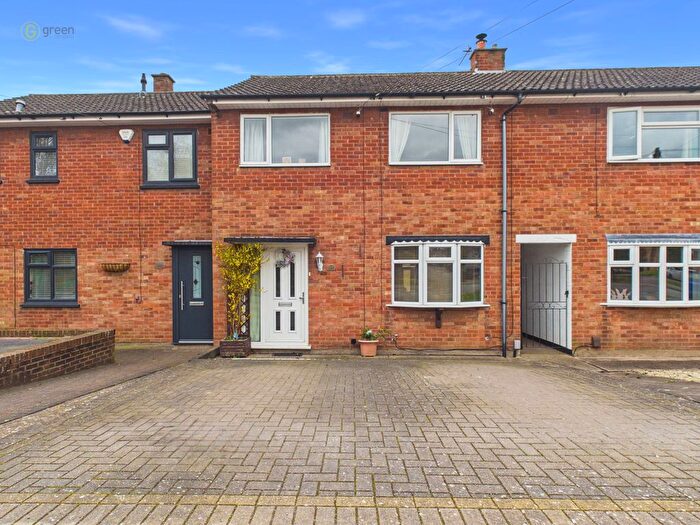
Properties for sale in Tamworth
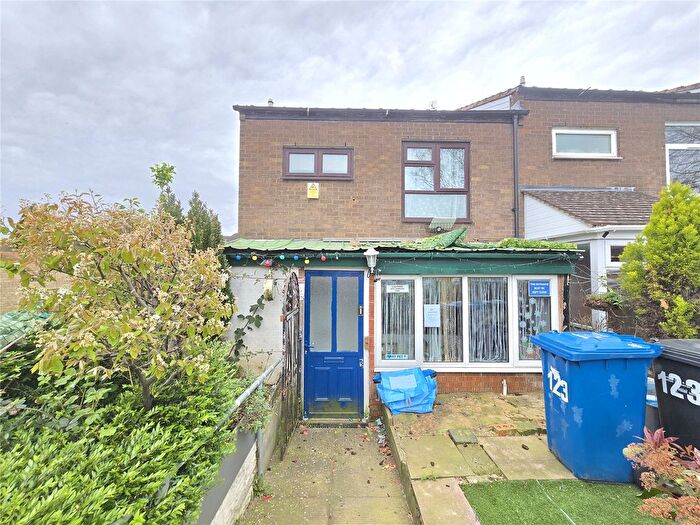
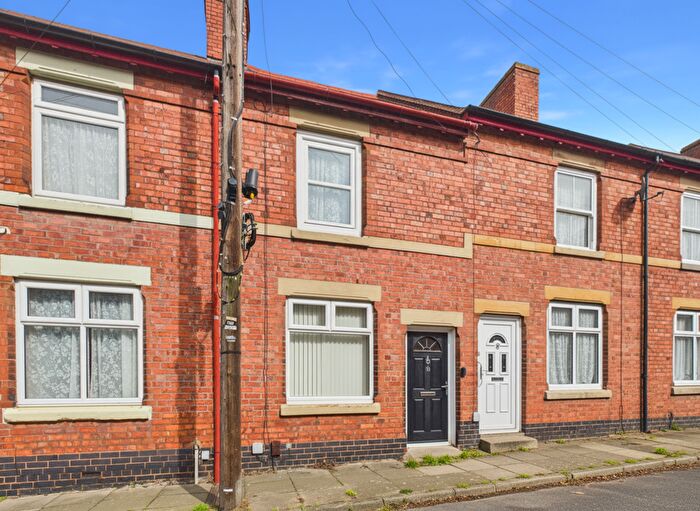
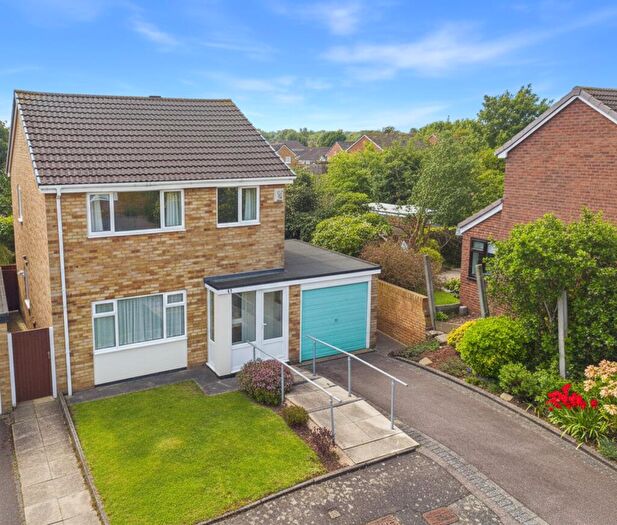
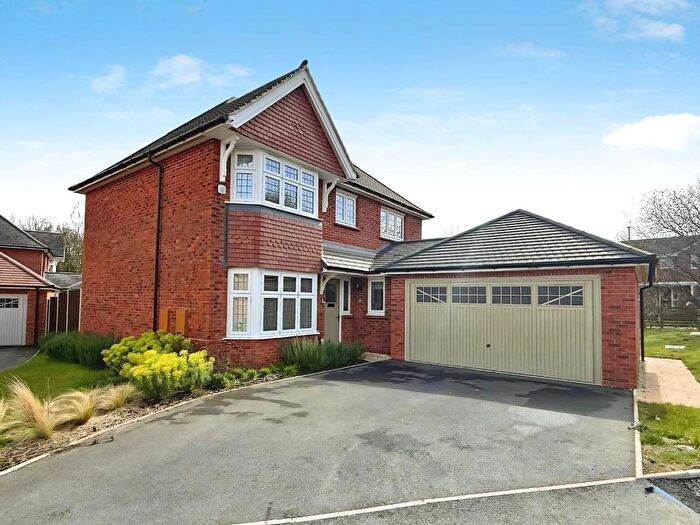
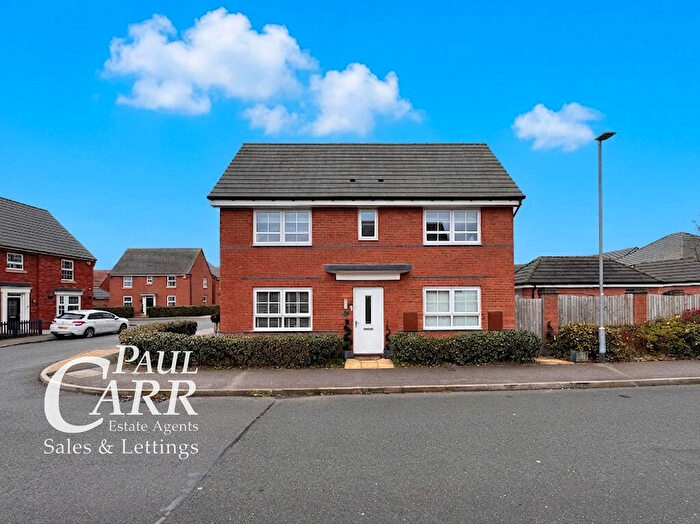
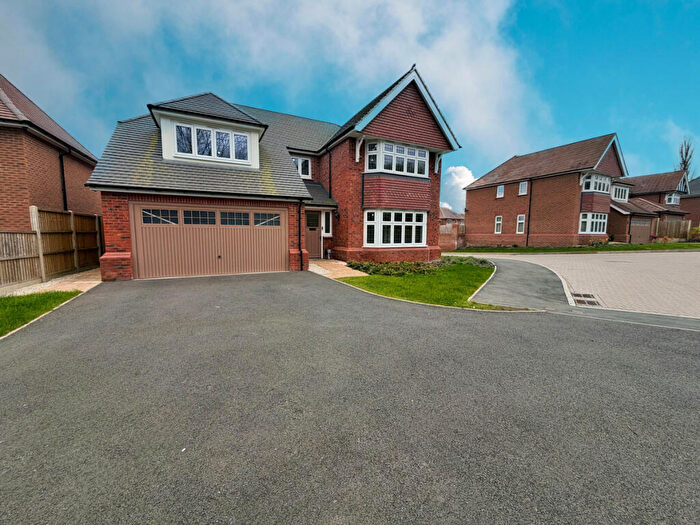
![]()
If you are looking to sell your house, let it out, or receive a property valuation, an expert can help you.
Click the button below to get started.

Neighbourhoods in Tamworth
Navigate through our locations to find the location of your next house in Tamworth, Staffordshire for sale or to rent.
Transport in Tamworth
Please see below transportation links in this area:

- FAQ
- Price Paid By Year
- Property Type Price
Frequently asked questions about Tamworth
What is the average price for a property for sale in Tamworth?
The average price for a property for sale in Tamworth is £256,999. This amount is 3% lower than the average price in Staffordshire. There are more than 10,000 property listings for sale in Tamworth.
What locations have the most expensive properties for sale in Tamworth?
The locations with the most expensive properties for sale in Tamworth are Bourne Vale at an average of £524,611, Mease And Tame at an average of £469,128 and Trinity at an average of £285,434.
What locations have the most affordable properties for sale in Tamworth?
The locations with the most affordable properties for sale in Tamworth are Glascote at an average of £212,808, Belgrave at an average of £216,641 and Castle at an average of £218,988.
Which train stations are available in or near Tamworth?
Some of the train stations available in or near Tamworth are Tamworth Low Level, Wilnecote and Polesworth.
Property Price Paid in Tamworth by Year
The average sold property price by year was:
| Year | Average Sold Price | Price Change |
Sold Properties
|
|---|---|---|---|
| 2026 | £324,131 | 17% |
16 Properties |
| 2025 | £267,766 | 5% |
1,053 Properties |
| 2024 | £253,795 | 2% |
1,238 Properties |
| 2023 | £249,076 | -2% |
1,066 Properties |
| 2022 | £253,668 | 4% |
1,334 Properties |
| 2021 | £242,317 | 5% |
1,862 Properties |
| 2020 | £229,362 | 1% |
1,423 Properties |
| 2019 | £227,296 | 4% |
1,656 Properties |
| 2018 | £219,105 | 7% |
1,443 Properties |
| 2017 | £203,081 | 5% |
1,439 Properties |
| 2016 | £192,292 | 9% |
1,338 Properties |
| 2015 | £174,690 | 4% |
1,235 Properties |
| 2014 | £167,780 | 6% |
1,271 Properties |
| 2013 | £157,699 | 2% |
965 Properties |
| 2012 | £153,892 | 1% |
818 Properties |
| 2011 | £152,205 | -6% |
787 Properties |
| 2010 | £160,577 | 5% |
702 Properties |
| 2009 | £153,178 | -5% |
734 Properties |
| 2008 | £160,469 | -2% |
912 Properties |
| 2007 | £164,079 | - |
1,801 Properties |
| 2006 | £164,050 | 9% |
1,822 Properties |
| 2005 | £149,145 | 3% |
1,407 Properties |
| 2004 | £144,186 | 14% |
1,670 Properties |
| 2003 | £123,876 | 13% |
1,597 Properties |
| 2002 | £108,093 | 17% |
1,990 Properties |
| 2001 | £89,505 | 11% |
1,701 Properties |
| 2000 | £79,959 | 6% |
1,816 Properties |
| 1999 | £75,321 | 10% |
1,853 Properties |
| 1998 | £67,881 | 7% |
1,659 Properties |
| 1997 | £63,264 | 4% |
1,698 Properties |
| 1996 | £60,687 | 7% |
1,505 Properties |
| 1995 | £56,706 | - |
1,331 Properties |
Property Price per Property Type in Tamworth
Here you can find historic sold price data in order to help with your property search.
The average Property Paid Price for specific property types in the last three years are:
| Property Type | Average Sold Price | Sold Properties |
|---|---|---|
| Semi Detached House | £240,017.00 | 1,205 Semi Detached Houses |
| Terraced House | £198,098.00 | 861 Terraced Houses |
| Detached House | £382,147.00 | 936 Detached Houses |
| Flat | £133,116.00 | 371 Flats |