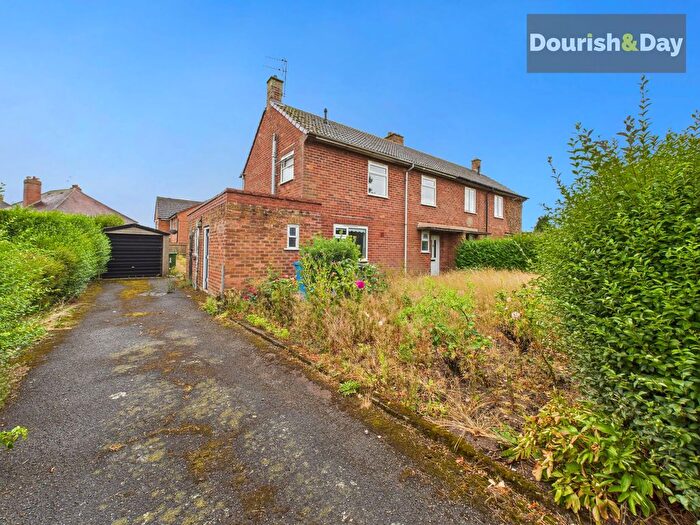
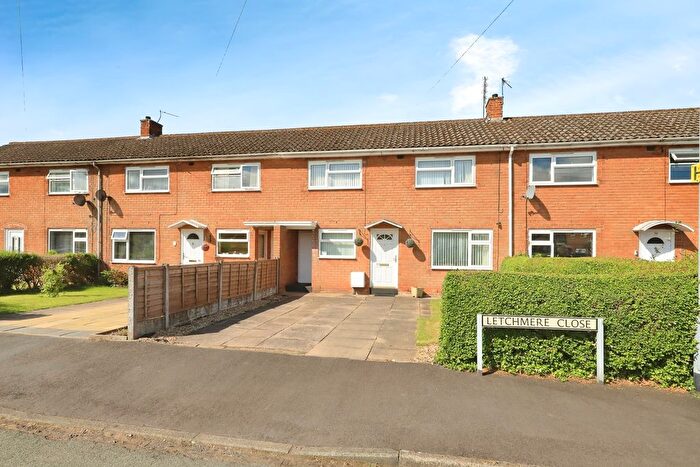
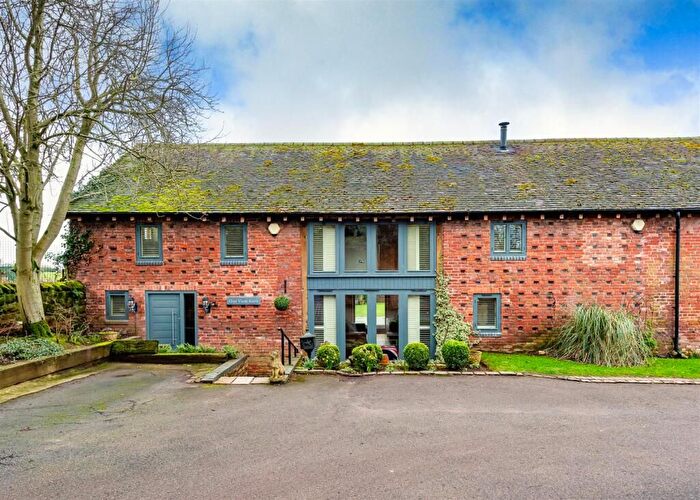
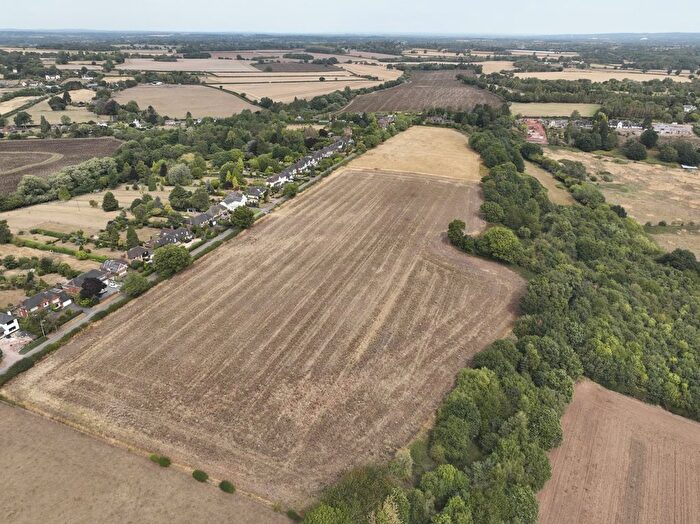
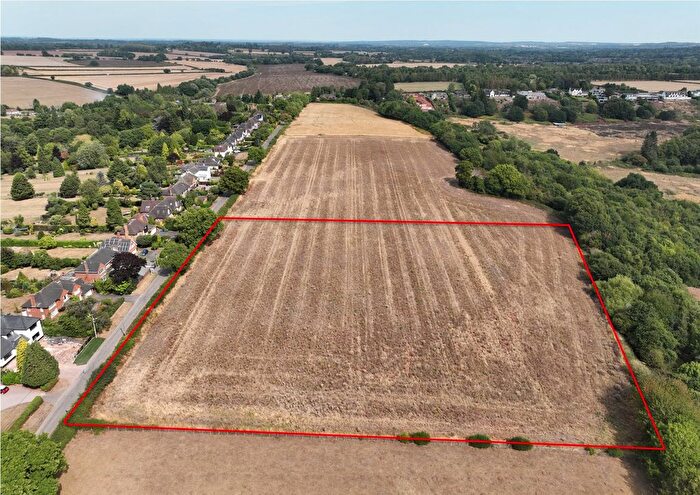
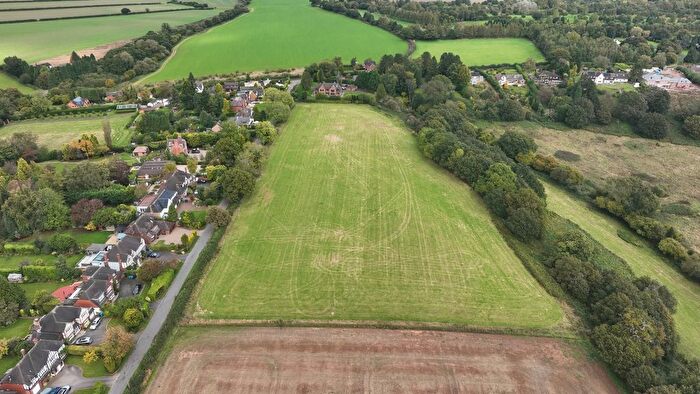
Houses for sale & to rent in Pattingham And Patshull, Wolverhampton
House Prices in Pattingham And Patshull
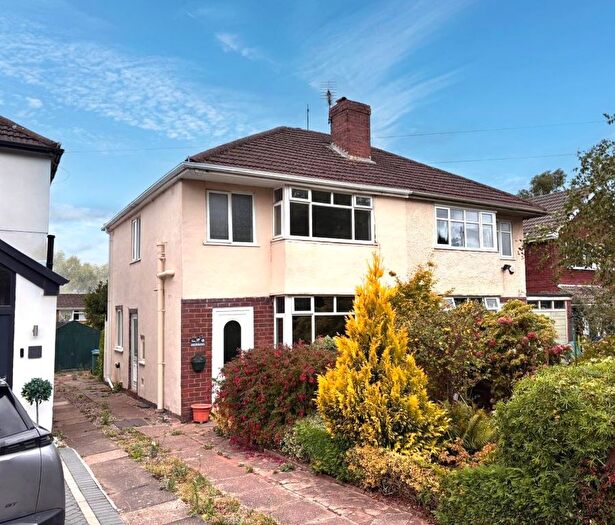
Properties in Pattingham And Patshull have an average house price of £452,052.00 and had 66 Property Transactions within the last 3 years¹.
Pattingham And Patshull is an area in Wolverhampton, Staffordshire with 954 households², where the most expensive property was sold for £5,350,000.00.
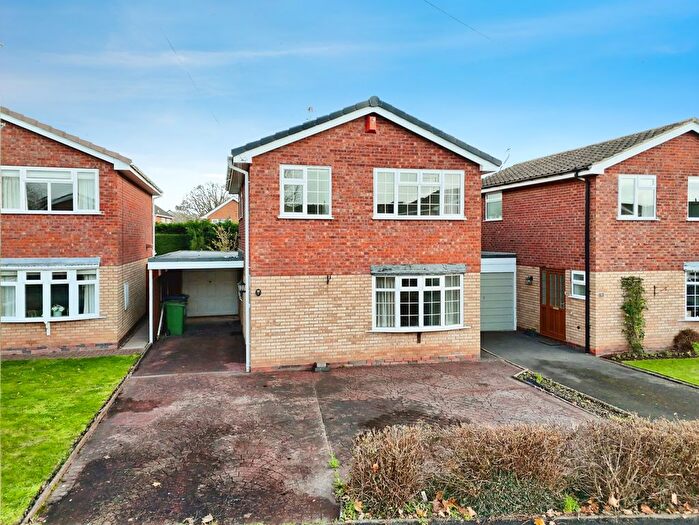
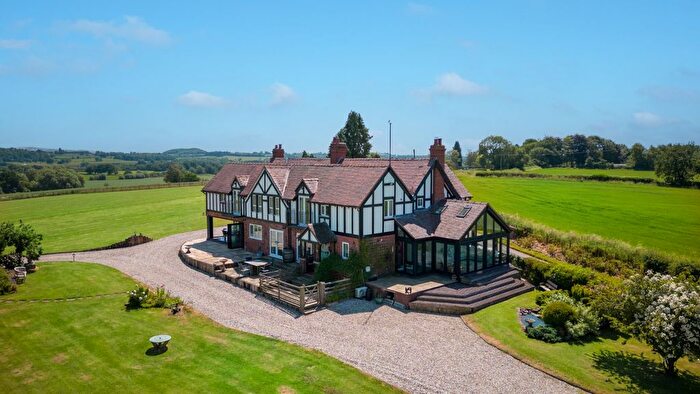
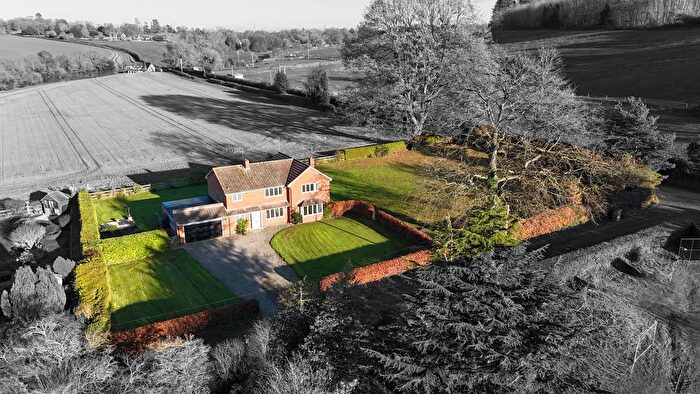
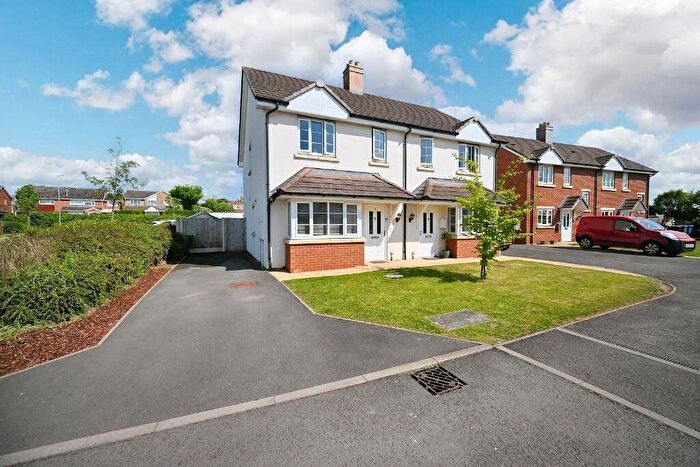
Properties for sale in Pattingham And Patshull
Previously listed properties in Pattingham And Patshull
Roads and Postcodes in Pattingham And Patshull
Navigate through our locations to find the location of your next house in Pattingham And Patshull, Wolverhampton for sale or to rent.
| Streets | Postcodes |
|---|---|
| Albrighton Road | WV6 7JG WV6 7JQ |
| Badger Road | WV6 7JA |
| Beech Close | WV6 7BA |
| Beechcroft | WV6 7BW |
| Braemar Road | WV6 7DT |
| Broadwell Lane | WV6 7BP |
| Burnhill Green | WV6 7HZ |
| Chesterton Road | WV6 7BJ |
| Clive Road | WV6 7BU WV6 7BY WV6 7DJ WV6 7EN |
| College Farm Close | WV6 7WA |
| Damson Park | WV6 7AY |
| Dartmouth Avenue | WV6 7DP |
| Dodds Field | WV6 7FA |
| Great Moor Road | WV6 7AT WV6 7AU |
| Green Close | WV6 7DB |
| Greenway Gardens | WV6 7DH |
| Hall Close | WV6 7DE |
| Hall End Close | WV6 7DG |
| Hall End Lane | WV6 7BL WV6 7BN |
| High Park | WV7 3BB |
| High Path | WV6 7BE |
| High Street | WV6 7BB WV6 7BH WV6 7BQ |
| Highgate Court | WV6 7ER |
| Letchmere Close | WV6 7AJ WV6 7AL |
| Letchmere Lane | WV6 7AH WV6 7AW |
| Little Moor | WV6 7AS |
| Marlbrook Lane | WV6 7BS |
| Meadow View | WV6 7BD |
| Merchant Close | WV6 7EF |
| Moor Lane | WV6 7AR WV6 7DL WV6 7DN WV6 7SU |
| Newgate | WV6 7AG |
| Nurton Bank | WV6 7AB |
| Nurton Hill Road | WV6 7HG WV6 7HQ |
| Old Smithy Close | WV6 7AZ |
| Orchard Close | WV6 7AN |
| Patshull Hall | WV6 7HY |
| Patshull Park | WV6 7HR |
| Patshull Road | WV6 7DU WV6 7DX WV6 7BG |
| Pattingham Road | WV6 7AE |
| Retreat Gardens | WV6 7BX |
| Rudge Road | WV6 7BT |
| Sandringham Road | WV6 7DS |
| Snowdon Road | WV6 7HT WV6 7HU |
| St Chads Close | WV6 7AX |
| The Elms Paddock | WV6 7DW |
| The Greenway | WV6 7DA WV6 7DD WV6 7DF WV6 7DQ |
| The Square | WV6 7BZ |
| Warstone Hill Road | WV6 7HH |
| West End Gardens | WV6 7EW |
| Westbeech Road | WV6 7AQ WV6 7HF WV6 7HE |
| Windsor Road | WV6 7DR |
| Wolverhampton Road | WV6 7AD WV6 7AF |
| Yew Tree Road | WV6 7AP |
Transport near Pattingham And Patshull
- FAQ
- Price Paid By Year
- Property Type Price
Frequently asked questions about Pattingham And Patshull
What is the average price for a property for sale in Pattingham And Patshull?
The average price for a property for sale in Pattingham And Patshull is £452,052. This amount is 42% higher than the average price in Wolverhampton. There are 99 property listings for sale in Pattingham And Patshull.
What streets have the most expensive properties for sale in Pattingham And Patshull?
The streets with the most expensive properties for sale in Pattingham And Patshull are Nurton Hill Road at an average of £3,535,000, Great Moor Road at an average of £814,250 and Wolverhampton Road at an average of £615,357.
What streets have the most affordable properties for sale in Pattingham And Patshull?
The streets with the most affordable properties for sale in Pattingham And Patshull are Dodds Field at an average of £106,000, Patshull Road at an average of £232,500 and Letchmere Close at an average of £247,500.
Which train stations are available in or near Pattingham And Patshull?
Some of the train stations available in or near Pattingham And Patshull are Albrighton, Codsall and Cosford.
Property Price Paid in Pattingham And Patshull by Year
The average sold property price by year was:
| Year | Average Sold Price | Price Change |
Sold Properties
|
|---|---|---|---|
| 2025 | £326,190 | -80% |
16 Properties |
| 2024 | £586,498 | 36% |
28 Properties |
| 2023 | £372,477 | -36% |
22 Properties |
| 2022 | £507,147 | 16% |
20 Properties |
| 2021 | £427,200 | 3% |
30 Properties |
| 2020 | £413,257 | 16% |
31 Properties |
| 2019 | £347,280 | 11% |
33 Properties |
| 2018 | £308,618 | -1% |
29 Properties |
| 2017 | £313,223 | 6% |
37 Properties |
| 2016 | £295,984 | -4% |
33 Properties |
| 2015 | £307,026 | 8% |
36 Properties |
| 2014 | £283,618 | -2% |
25 Properties |
| 2013 | £289,440 | 10% |
26 Properties |
| 2012 | £260,186 | -25% |
21 Properties |
| 2011 | £324,785 | 17% |
14 Properties |
| 2010 | £268,125 | -15% |
16 Properties |
| 2009 | £307,439 | -2% |
15 Properties |
| 2008 | £312,380 | 19% |
23 Properties |
| 2007 | £254,196 | -6% |
30 Properties |
| 2006 | £270,641 | 1% |
31 Properties |
| 2005 | £267,514 | 0,2% |
27 Properties |
| 2004 | £266,960 | 24% |
29 Properties |
| 2003 | £203,401 | 8% |
37 Properties |
| 2002 | £187,880 | 13% |
36 Properties |
| 2001 | £163,261 | 25% |
34 Properties |
| 2000 | £122,405 | 7% |
22 Properties |
| 1999 | £114,381 | 1% |
32 Properties |
| 1998 | £113,428 | -15% |
29 Properties |
| 1997 | £130,345 | 15% |
31 Properties |
| 1996 | £110,258 | -3% |
29 Properties |
| 1995 | £113,314 | - |
35 Properties |
Property Price per Property Type in Pattingham And Patshull
Here you can find historic sold price data in order to help with your property search.
The average Property Paid Price for specific property types in the last three years are:
| Property Type | Average Sold Price | Sold Properties |
|---|---|---|
| Semi Detached House | £284,351.00 | 30 Semi Detached Houses |
| Detached House | £620,453.00 | 33 Detached Houses |
| Terraced House | £276,666.00 | 3 Terraced Houses |

