
Houses for sale in Blything, Beccles
House Prices in Blything
Properties in Blything have an average house price of £324k and had 32 Property Transactions within the last 3 years¹.
Blything is an area in Beccles, Suffolk with 302 households², where the most expensive property was sold for £935k.
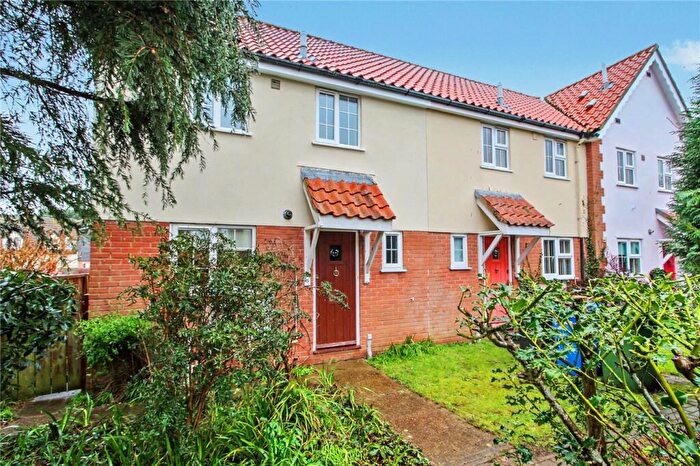
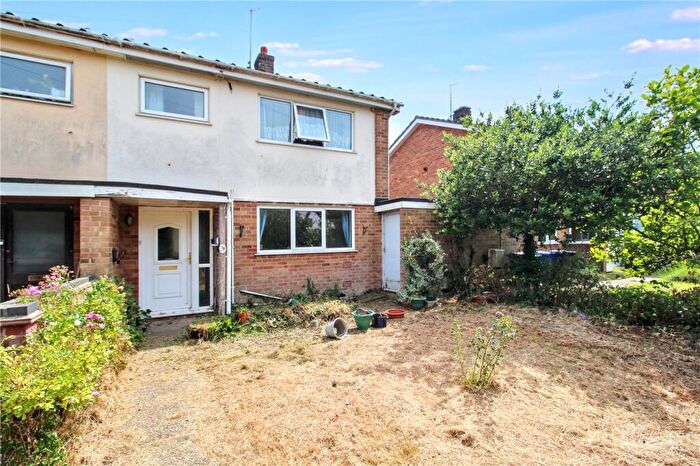
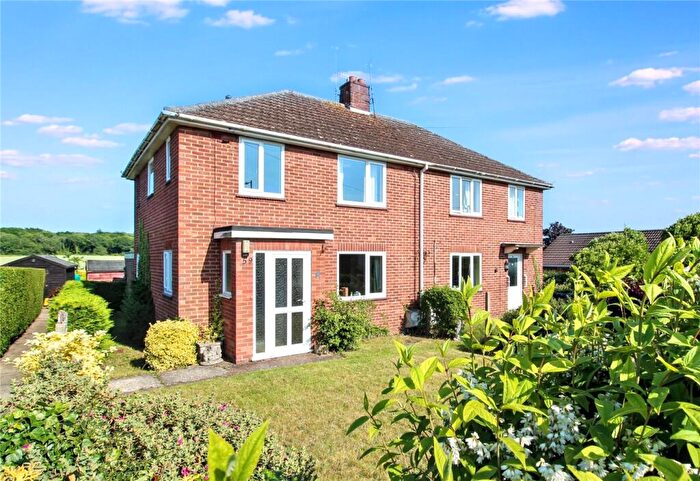
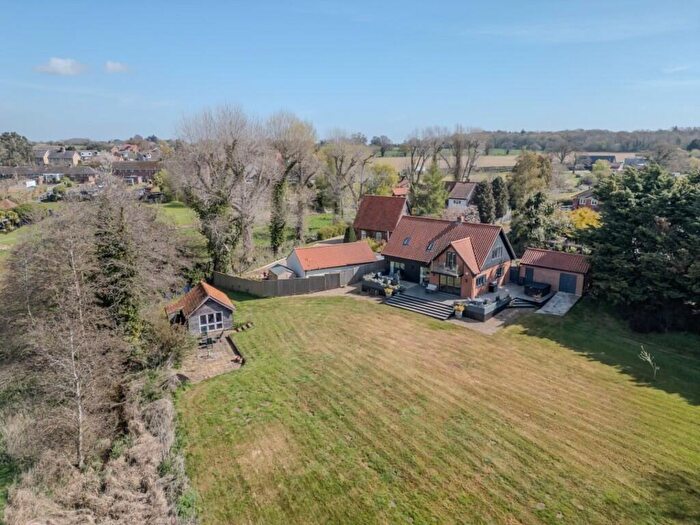
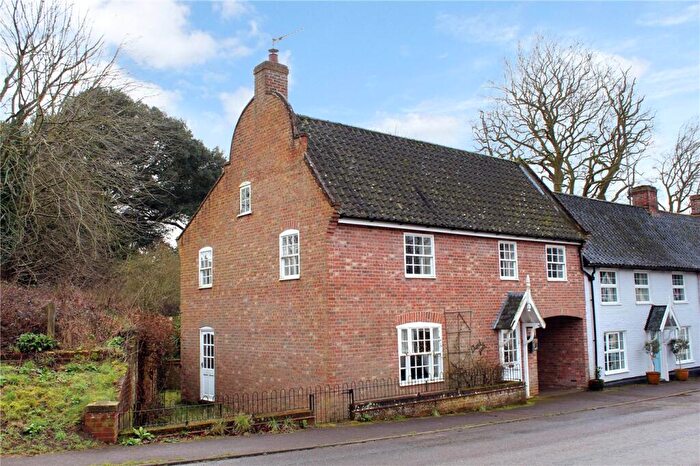
Properties for sale in Blything
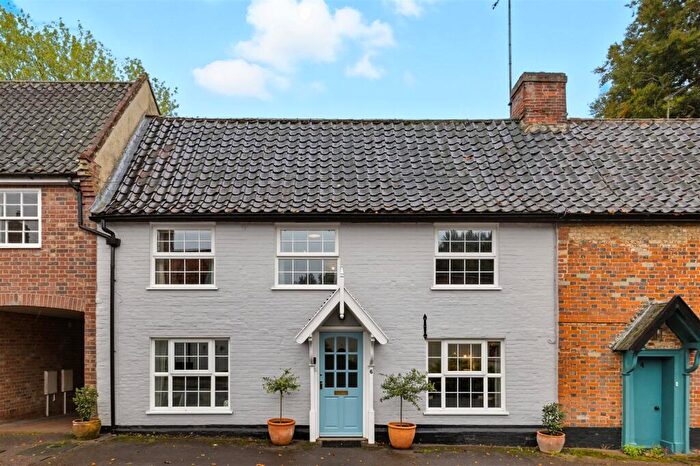

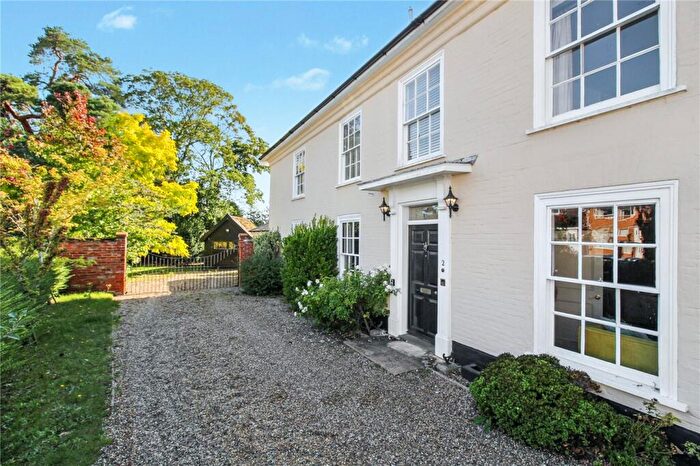
![]()
If you are looking to sell your house, let it out, or receive a property valuation, an expert can help you.
Click the button below to get started.
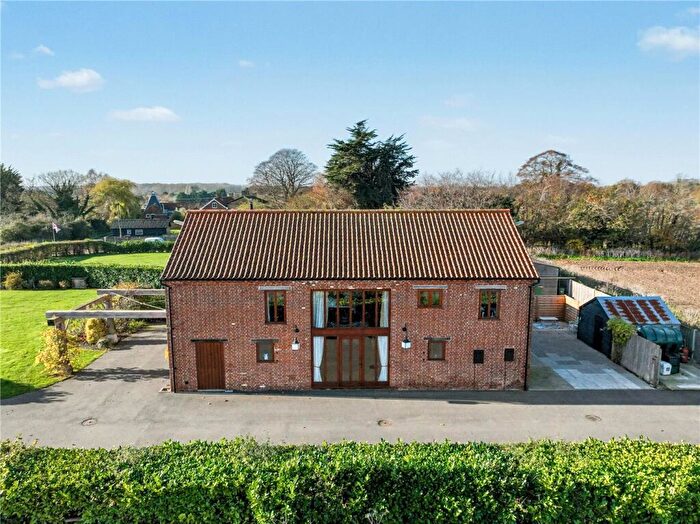
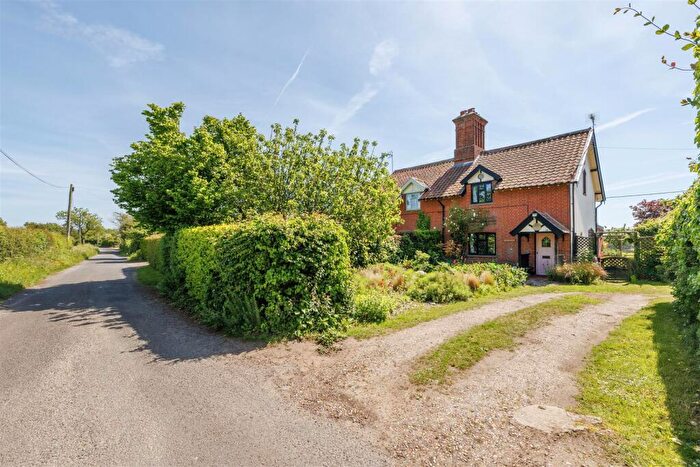
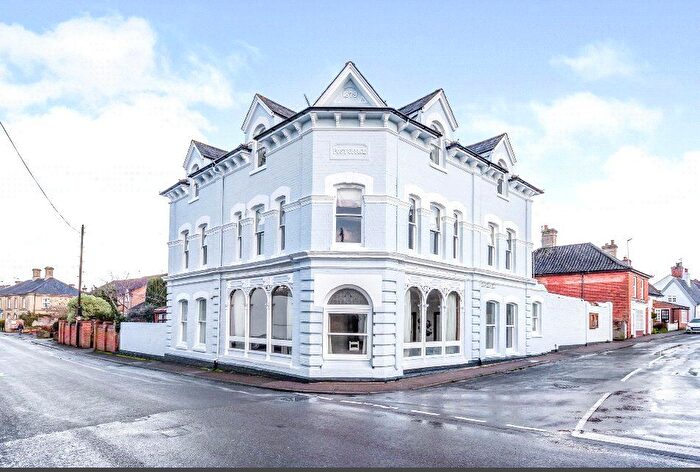
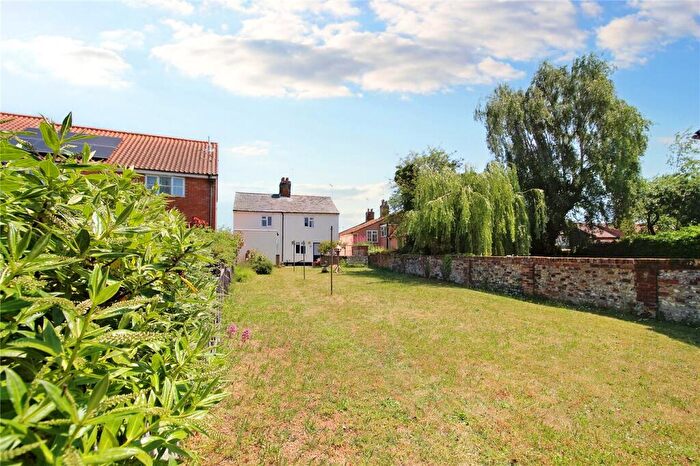
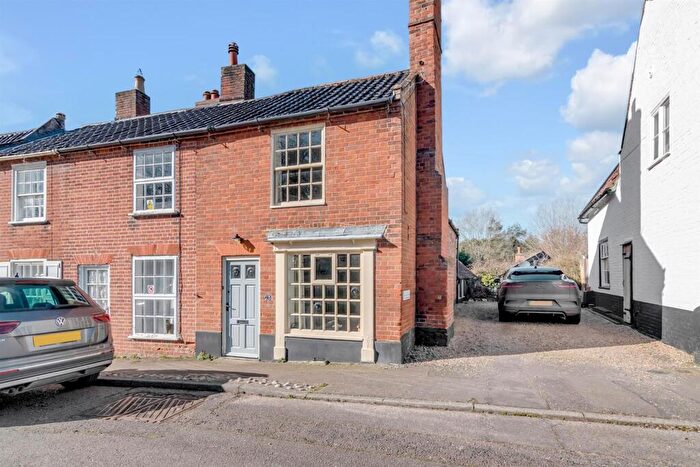
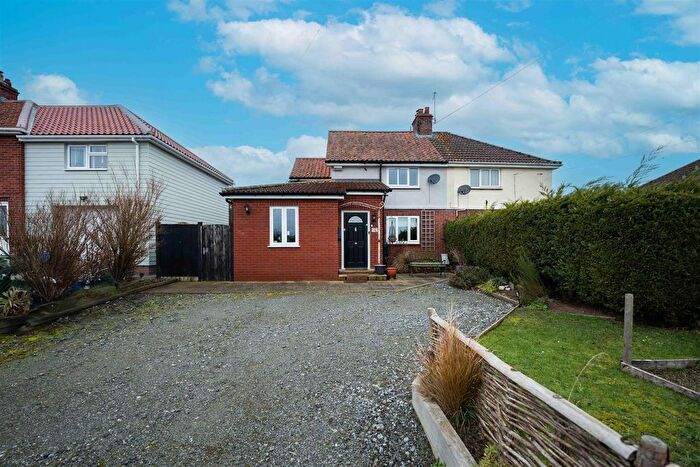
Previously listed properties in Blything
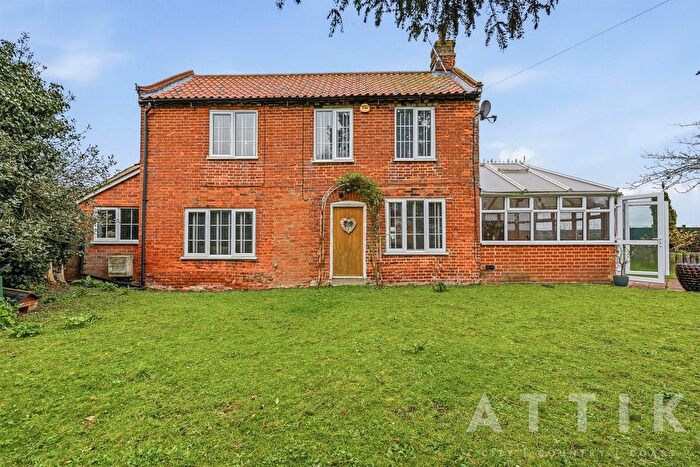
![]()
If you are looking to sell your house, let it out, or receive a property valuation, an expert can help you.
Click the button below to get started.


Roads and Postcodes in Blything
Navigate through our locations to find the location of your next house in Blything, Beccles for sale or to rent.
| Streets | Postcodes |
|---|---|
| Barnaby Green | NR34 8AY |
| Beccles Road | NR34 8AN |
| Blacksmith Close | NR34 8RS |
| Church Close | NR34 8RQ |
| Church Street | NR34 8RN NR34 8RW |
| Crossbow Cottages | NR34 8ES |
| Elms Lane | NR34 8AX NR34 8BA |
| High Street | NR34 8AZ NR34 8RA NR34 8RL NR34 8RR |
| Hill Road | NR34 8AR |
| Kings Lane | NR34 8AE |
| Mardle Road | NR34 8AU |
| Millfields | NR34 8RG |
| Norfolk Road | NR34 8RE NR34 8RF |
| Old Priory Gardens | NR34 8RH |
| Sotherton Corner | NR34 8AP |
| The Green | NR34 8AJ |
| Wangford Hill | NR34 8AT |
| NR34 7HY NR34 8AB NR34 8AD NR34 8AH NR34 8AL NR34 8AQ |
Property price trends in Blything
According to the latest Land Registry data, the average home in Blything sold for £286,333 in 2026. That figure comes from 470 sales logged over the past 31 years.
Prices have fallen back over the last three years. Compared with 2023, when the typical sale came in around £394,625, that's a fall of roughly 27.4%.
Looking back five years, average prices are down about 1.8% since 2021, a drop of around £5,305 in cash terms.
Zoom out to the past decade for the fuller picture. Back in 2016, homes here averaged £287,833, so the typical sold price has fallen about 0.5% since then, around 0.1% a year lower. Stretch the view to fifteen years and that annual pace edges up closer to 0.9%.
Frequently asked questions about Blything
What is the average price for a property for sale in Blything?
The average price for a property for sale in Blything is £324,437. This amount is 6% higher than the average price in Beccles. There are 53 property listings for sale in Blything.
What streets have the most expensive properties for sale in Blything?
The streets with the most expensive properties for sale in Blything are High Street at an average of £457,000, Sotherton Corner at an average of £365,000 and Barnaby Green at an average of £343,500.
What streets have the most affordable properties for sale in Blything?
The streets with the most affordable properties for sale in Blything are Church Street at an average of £198,750, Old Priory Gardens at an average of £230,000 and Norfolk Road at an average of £298,000.
Which train stations are available in or near Blything?
Some of the train stations available in or near Blything are Brampton (Suffolk), Halesworth and Darsham.
Property Price Paid in Blything by Year
The average sold property price by year was:
| Year | Average Sold Price | Price Change |
Sold Properties
|
|---|---|---|---|
| 2026 | £286,333 | 6% |
3 Properties |
| 2025 | £270,285 | -18% |
7 Properties |
| 2024 | £319,571 | -23% |
14 Properties |
| 2023 | £394,625 | 4% |
8 Properties |
| 2022 | £377,374 | 23% |
12 Properties |
| 2021 | £291,638 | -22% |
25 Properties |
| 2020 | £356,464 | 11% |
14 Properties |
| 2019 | £317,666 | 24% |
9 Properties |
| 2018 | £241,514 | -13% |
13 Properties |
| 2017 | £271,884 | -6% |
13 Properties |
Property Price per Property Type in Blything
Here you can find historic sold price data in order to help with your property search.
The average Property Paid Price for specific property types in the last three years are:
| Property Type | Average Sold Price | Sold Properties |
|---|---|---|
| Semi Detached House | £294,066.00 | 15 Semi Detached Houses |
| Terraced House | £247,875.00 | 8 Terraced Houses |
| Detached House | £479,000.00 | 8 Detached Houses |
| Flat | £156,000.00 | 1 Flat |
