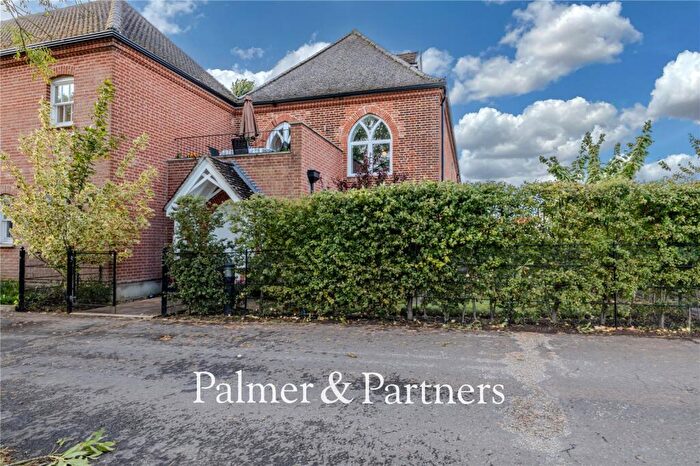
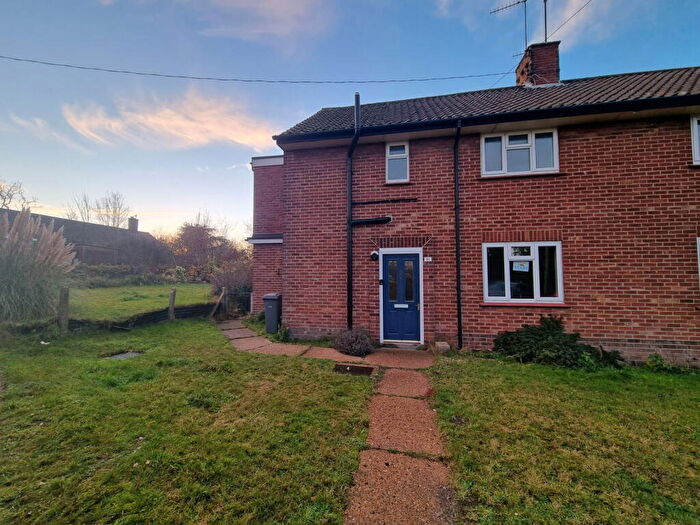
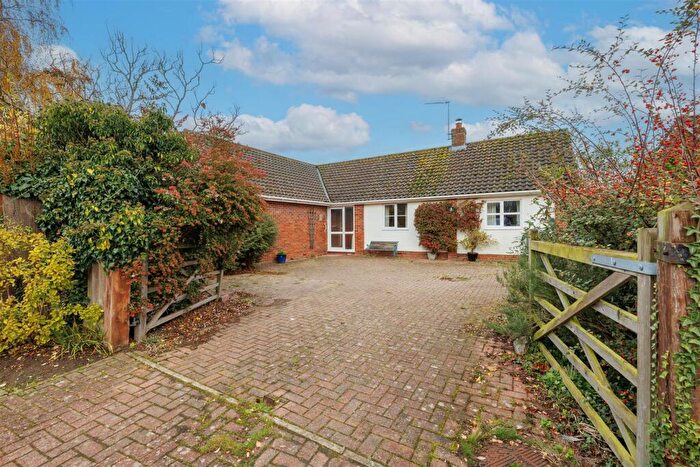
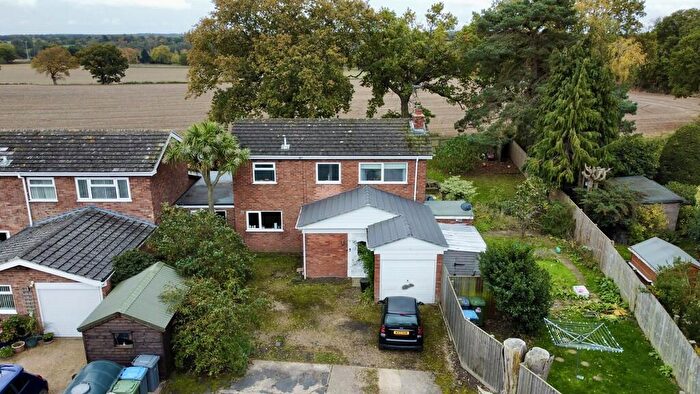
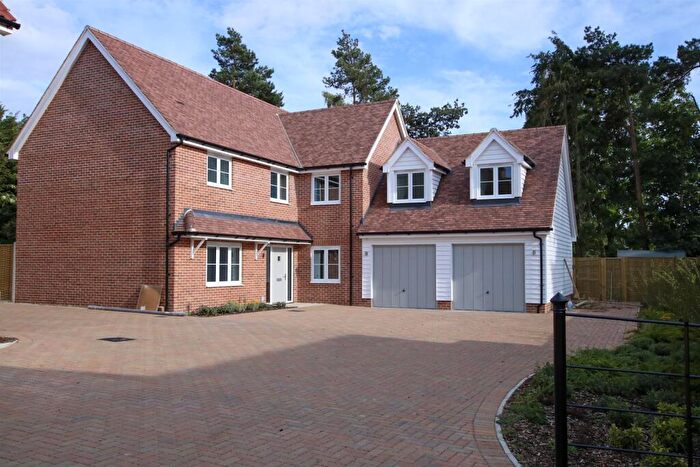
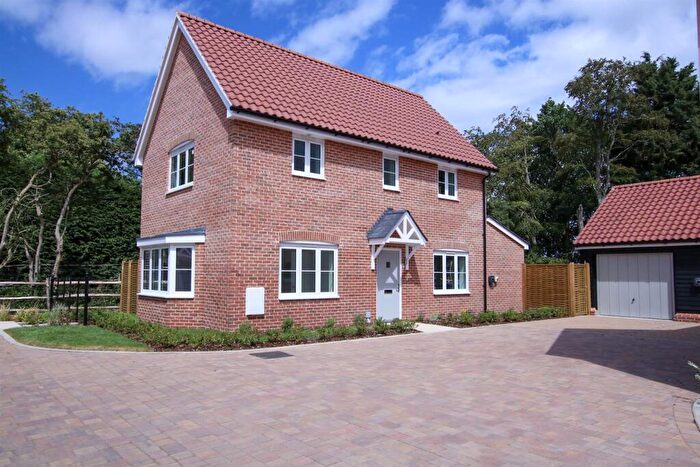
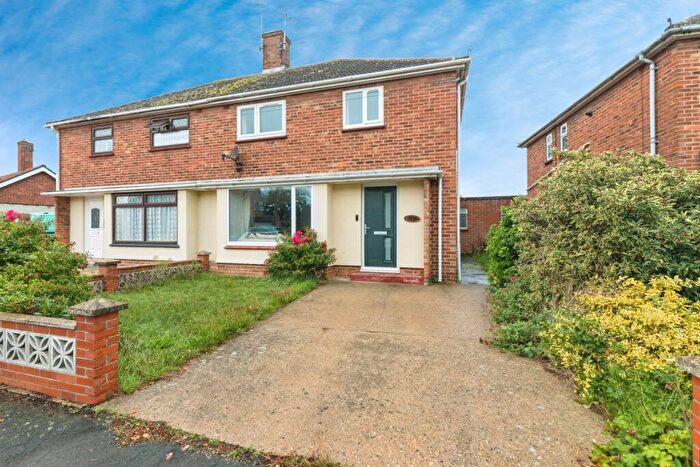
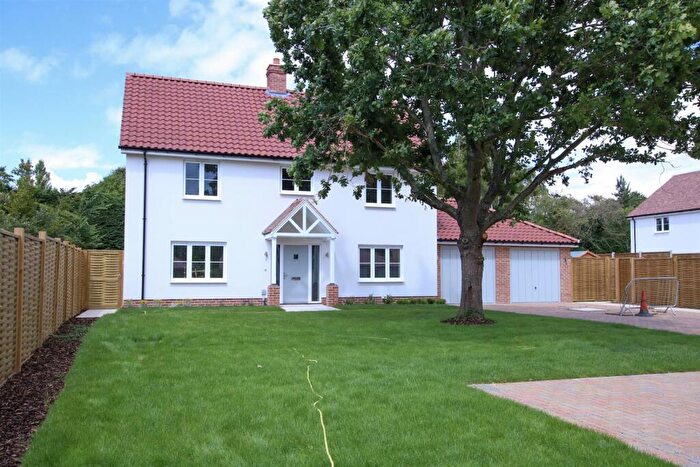
Houses for sale & to rent in Walberswick And Wenhaston, Halesworth
House Prices in Walberswick And Wenhaston
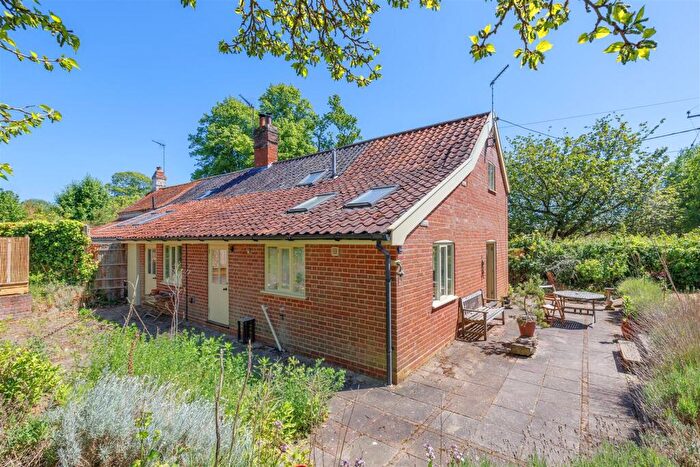
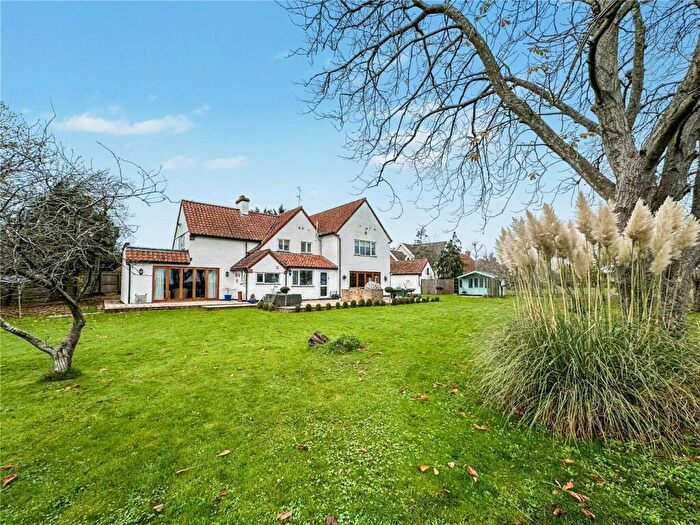
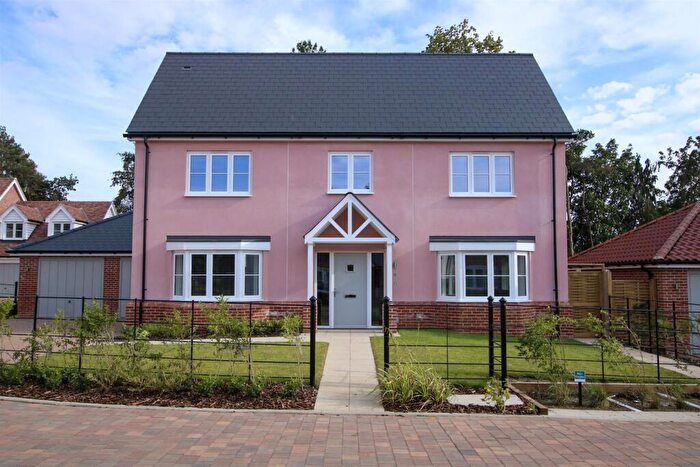
Properties in Walberswick And Wenhaston have an average house price of £416,138.00 and had 85 Property Transactions within the last 3 years¹.
Walberswick And Wenhaston is an area in Halesworth, Suffolk with 624 households², where the most expensive property was sold for £1,275,000.00.
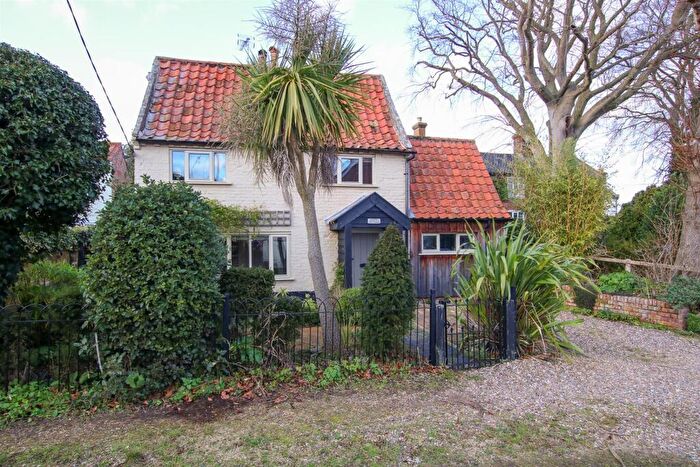
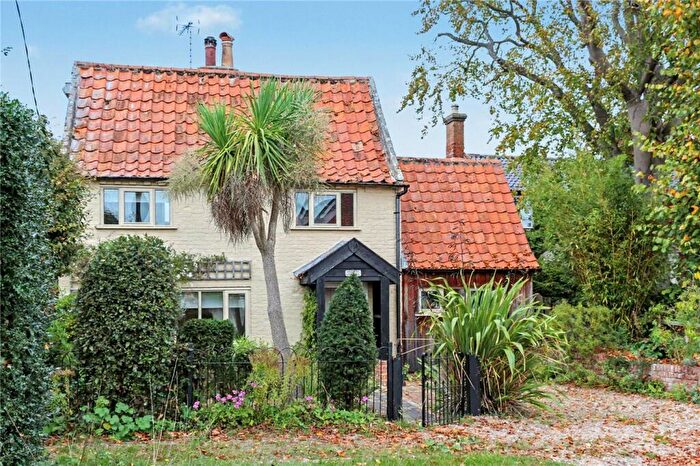
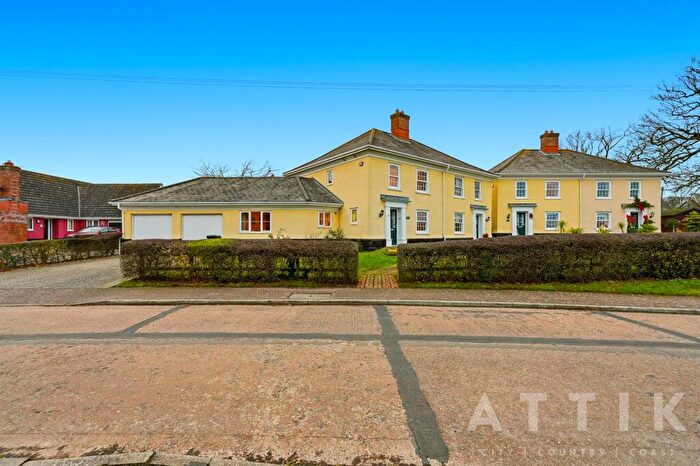
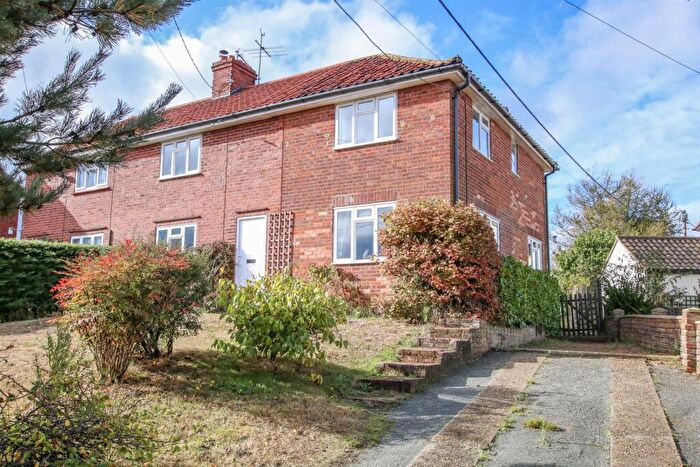
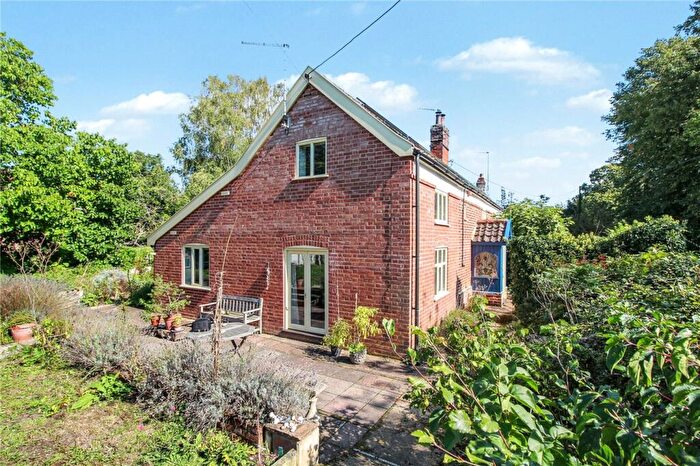
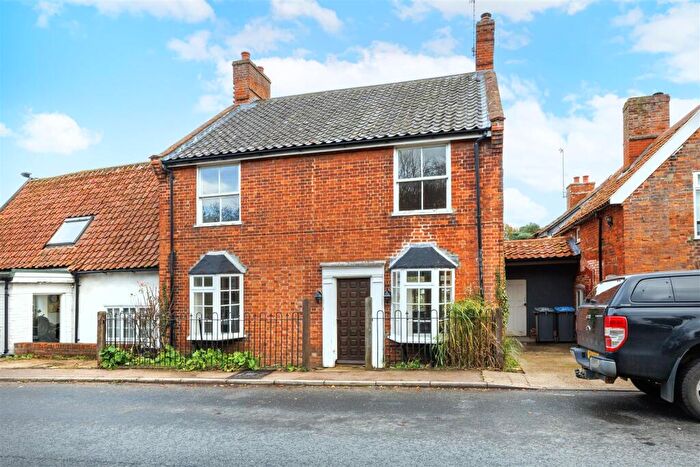
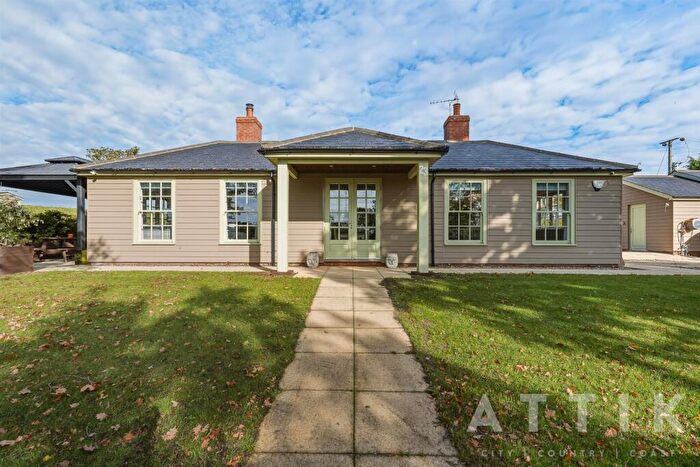
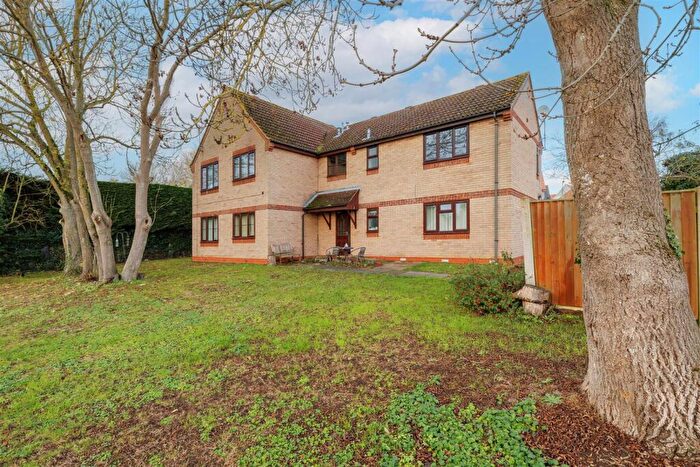
Properties for sale in Walberswick And Wenhaston
Roads and Postcodes in Walberswick And Wenhaston
Navigate through our locations to find the location of your next house in Walberswick And Wenhaston, Halesworth for sale or to rent.
| Streets | Postcodes |
|---|---|
| Angel Lane | IP19 9LJ IP19 9LU |
| Back Road | IP19 9DY IP19 9DZ IP19 9EB |
| Bartholomews Lane | IP19 9DF |
| Belvedere Terrace | IP19 9DS |
| Blackheath | IP19 9DH IP19 9ER IP19 9ET IP19 9EU IP19 9EX IP19 9EZ IP19 9HB |
| Blackheath Road | IP19 9HD |
| Blowers Piece | IP19 9AN |
| Blyford Lane | IP19 9BS IP19 9BT |
| Blyth Close | IP19 9EE |
| Blyth View | IP19 9LB |
| Bramfield Road | IP19 9DJ IP19 9EA |
| Brick Kiln Cottages | IP19 9HH |
| Bridge Street | IP19 9HY IP19 9HZ IP19 9JA |
| Chapel Lane | IP19 9DT |
| Chapel Road | IP19 9LW |
| Church Farm Road | IP19 9NT |
| Church Lane | IP19 9BJ IP19 9EG IP19 9LP |
| Church Road | IP19 9LL |
| Church Terrace | IP19 9EF |
| Coles Croft | IP19 9BN |
| Coles View | IP19 9BF |
| Corn Hill | IP19 9BW |
| Dunwich Road | IP19 9LT IP19 9LY IP19 9LZ |
| East View | IP19 9EW |
| Edwards Lane | IP19 9AA |
| Halesworth Road | IP19 9HP |
| Hall Road | IP19 9EP IP19 9HF |
| Hammonds Walk | IP19 9NJ |
| Heath Road | IP19 9DU |
| Highfields | IP19 9LX |
| Hog Lane | IP19 9HA |
| James Roberts Court | IP19 9JJ |
| London Road | IP19 9LN IP19 9NQ |
| Low Road | IP19 9BU IP19 9JH IP19 9JQ |
| Narrow Way | IP19 9EJ IP19 9EQ |
| North Manor Bungalows | IP19 9HS |
| Oak Meadow Close | IP19 9JL |
| Old Angel Lane | IP19 9JW |
| Pitmans Grove | IP19 9JB |
| Priory Road | IP19 9LR |
| St Michaels Way | IP19 9EH |
| Station Road | IP19 9LH |
| The Hill | IP19 9HR |
| The Street | IP19 9DP IP19 9DR IP19 9ED IP19 9HT IP19 9HU IP19 9LS |
| Thorington Road | IP19 9JE IP19 9JG |
| Walpole Road | IP19 9AB |
| Wash Lane | IP19 9DX |
| Wenhaston Lane | IP19 9NH |
| White House Cottages | IP19 9LG |
| IP19 9AE IP19 9AG IP19 9AH IP19 9AQ IP19 9DA IP19 9DD IP19 9DE IP19 9DQ IP19 9EL IP19 9HW IP19 9JD IP19 9JF IP19 9LE IP19 9LQ IP19 9NG |
Transport near Walberswick And Wenhaston
- FAQ
- Price Paid By Year
- Property Type Price
Frequently asked questions about Walberswick And Wenhaston
What is the average price for a property for sale in Walberswick And Wenhaston?
The average price for a property for sale in Walberswick And Wenhaston is £416,138. This amount is 16% higher than the average price in Halesworth. There are 764 property listings for sale in Walberswick And Wenhaston.
What streets have the most expensive properties for sale in Walberswick And Wenhaston?
The streets with the most expensive properties for sale in Walberswick And Wenhaston are Narrow Way at an average of £652,500, Edwards Lane at an average of £560,000 and Hall Road at an average of £533,500.
What streets have the most affordable properties for sale in Walberswick And Wenhaston?
The streets with the most affordable properties for sale in Walberswick And Wenhaston are London Road at an average of £195,000, James Roberts Court at an average of £220,000 and Church Farm Road at an average of £237,333.
Which train stations are available in or near Walberswick And Wenhaston?
Some of the train stations available in or near Walberswick And Wenhaston are Halesworth, Darsham and Brampton (Suffolk).
Property Price Paid in Walberswick And Wenhaston by Year
The average sold property price by year was:
| Year | Average Sold Price | Price Change |
Sold Properties
|
|---|---|---|---|
| 2025 | £395,500 | 7% |
14 Properties |
| 2024 | £367,423 | -27% |
26 Properties |
| 2023 | £466,920 | 8% |
25 Properties |
| 2022 | £430,437 | 15% |
20 Properties |
| 2021 | £367,274 | 4% |
49 Properties |
| 2020 | £353,318 | 6% |
22 Properties |
| 2019 | £330,521 | 7% |
28 Properties |
| 2018 | £307,458 | 7% |
31 Properties |
| 2017 | £286,161 | -4% |
40 Properties |
| 2016 | £298,522 | 8% |
22 Properties |
| 2015 | £275,356 | 5% |
24 Properties |
| 2014 | £261,857 | 7% |
21 Properties |
| 2013 | £244,484 | 11% |
19 Properties |
| 2012 | £218,517 | 2% |
28 Properties |
| 2011 | £215,182 | -14% |
29 Properties |
| 2010 | £245,412 | -17% |
24 Properties |
| 2009 | £286,313 | 9% |
31 Properties |
| 2008 | £261,113 | -3% |
22 Properties |
| 2007 | £268,394 | 17% |
43 Properties |
| 2006 | £221,585 | -14% |
37 Properties |
| 2005 | £252,548 | 15% |
26 Properties |
| 2004 | £215,010 | -2% |
45 Properties |
| 2003 | £220,111 | 30% |
40 Properties |
| 2002 | £153,677 | 11% |
31 Properties |
| 2001 | £136,128 | 17% |
41 Properties |
| 2000 | £112,946 | 21% |
26 Properties |
| 1999 | £89,601 | -6% |
33 Properties |
| 1998 | £95,035 | 19% |
34 Properties |
| 1997 | £76,674 | 6% |
37 Properties |
| 1996 | £71,863 | -17% |
22 Properties |
| 1995 | £83,734 | - |
18 Properties |
Property Price per Property Type in Walberswick And Wenhaston
Here you can find historic sold price data in order to help with your property search.
The average Property Paid Price for specific property types in the last three years are:
| Property Type | Average Sold Price | Sold Properties |
|---|---|---|
| Semi Detached House | £360,227.00 | 22 Semi Detached Houses |
| Detached House | £512,912.00 | 43 Detached Houses |
| Terraced House | £271,766.00 | 15 Terraced Houses |
| Flat | £263,000.00 | 5 Flats |

