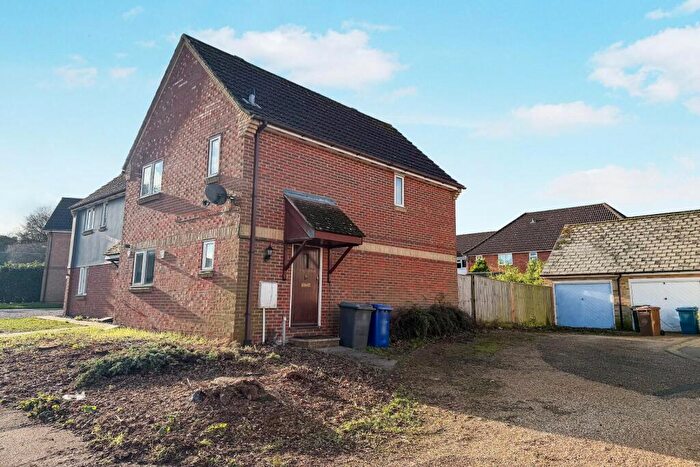
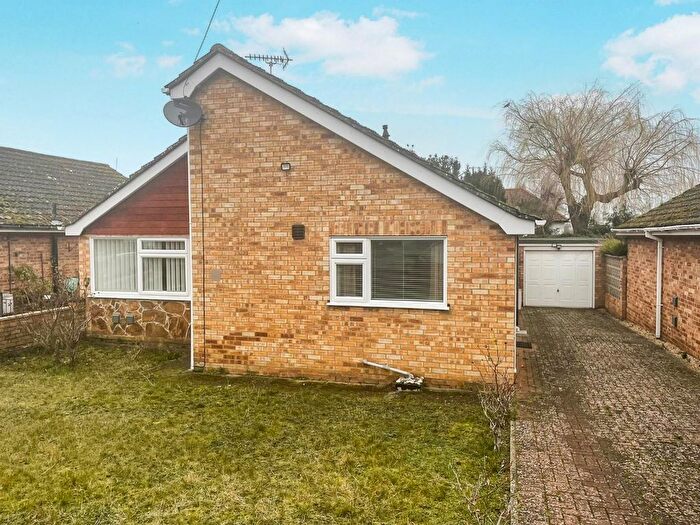
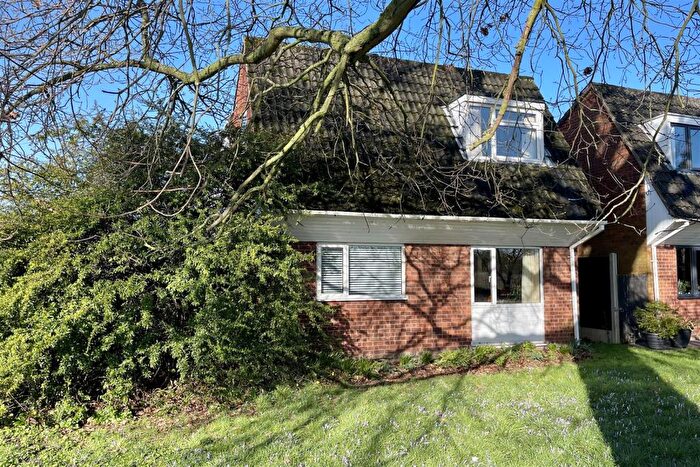
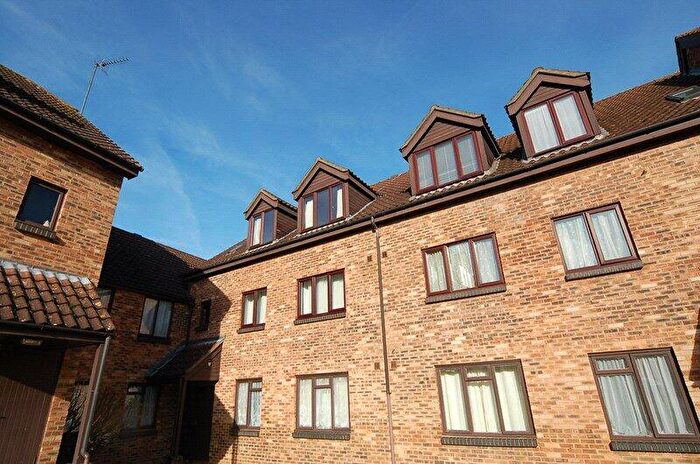
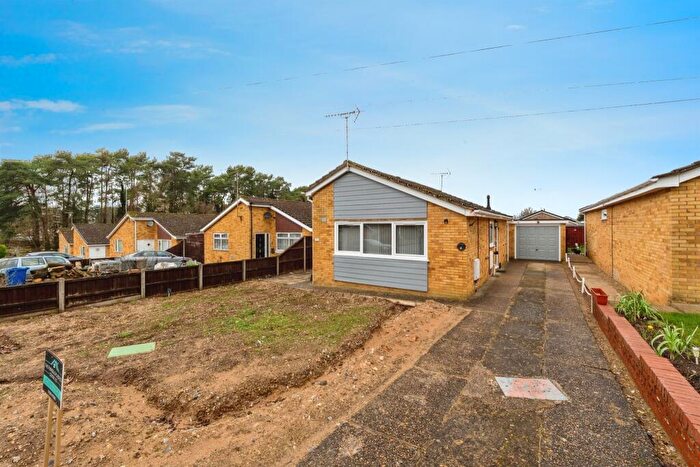
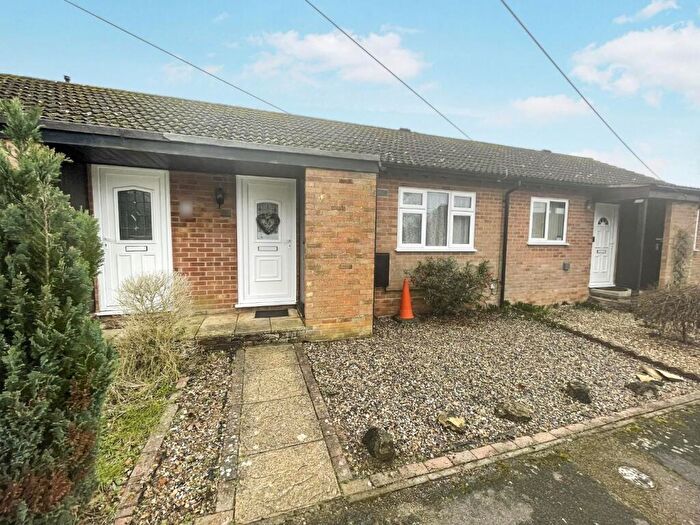
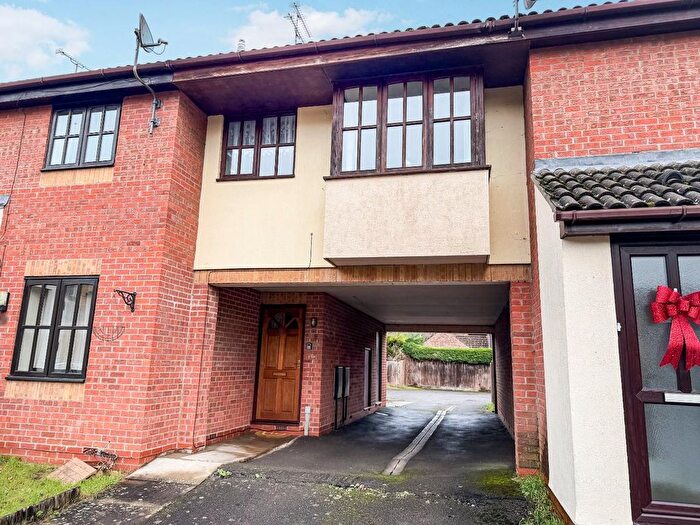
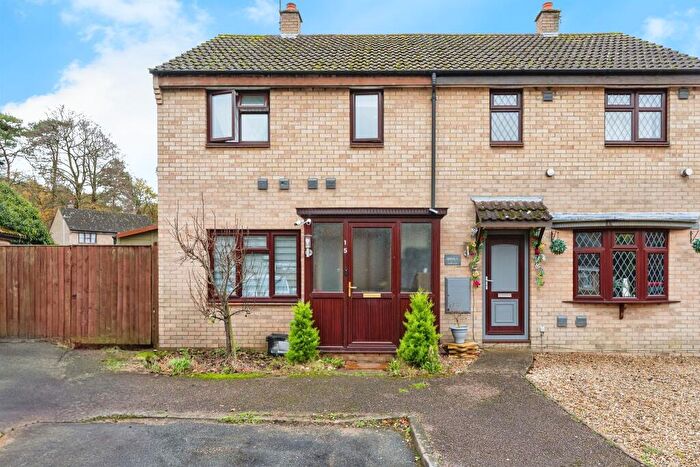
Houses for sale & to rent in Brandon East, Brandon
House Prices in Brandon East
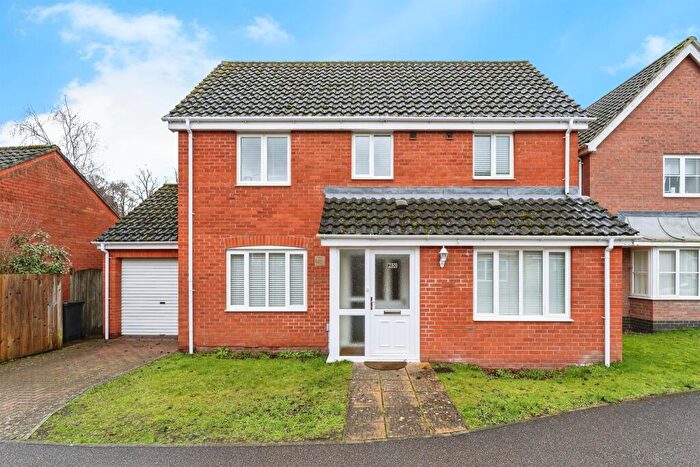
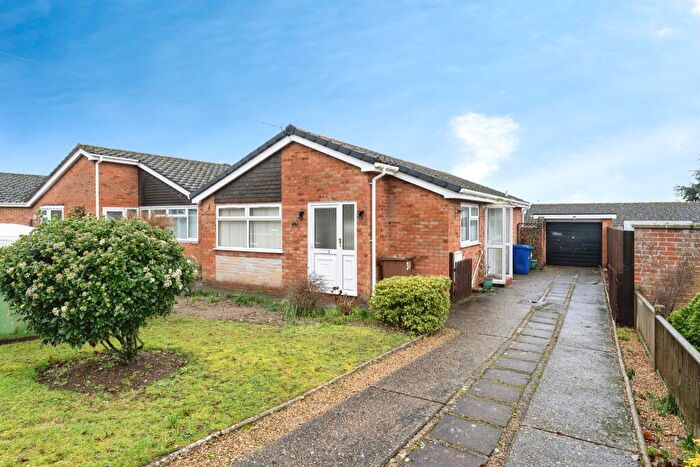
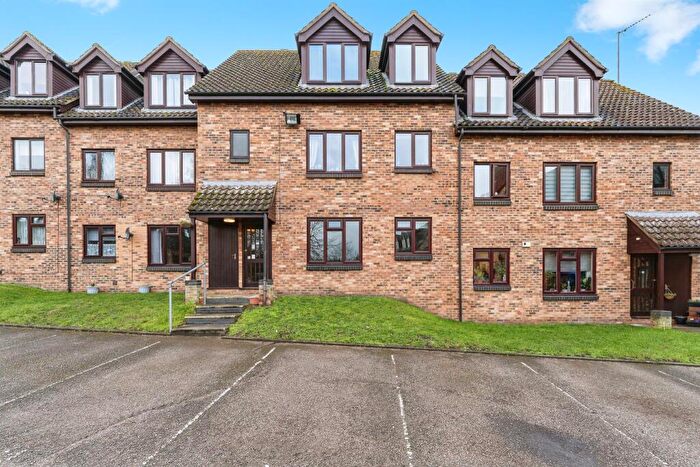
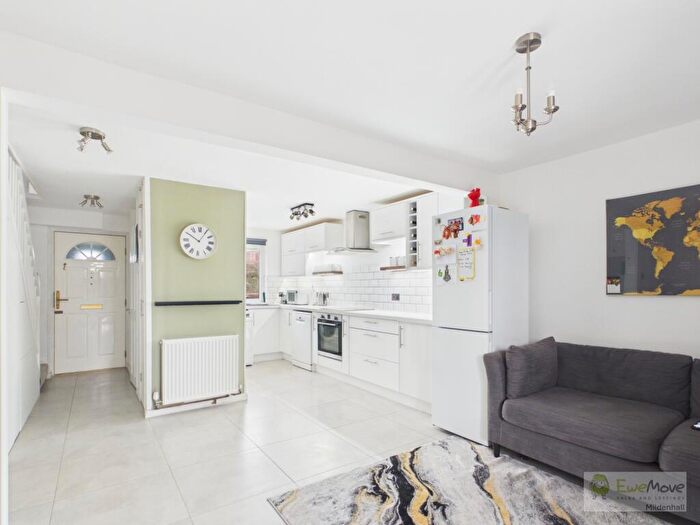
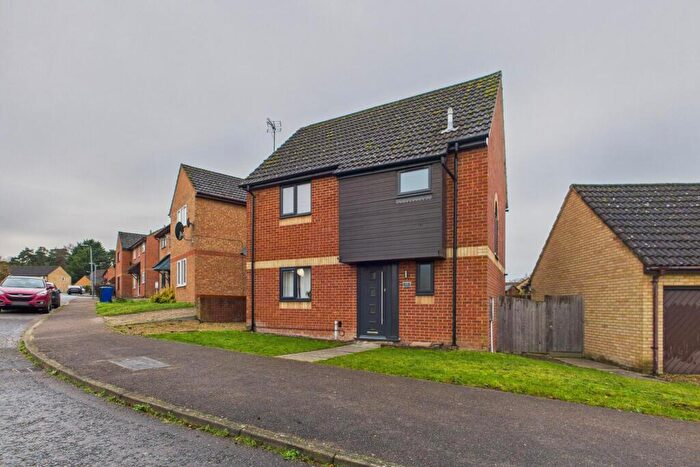
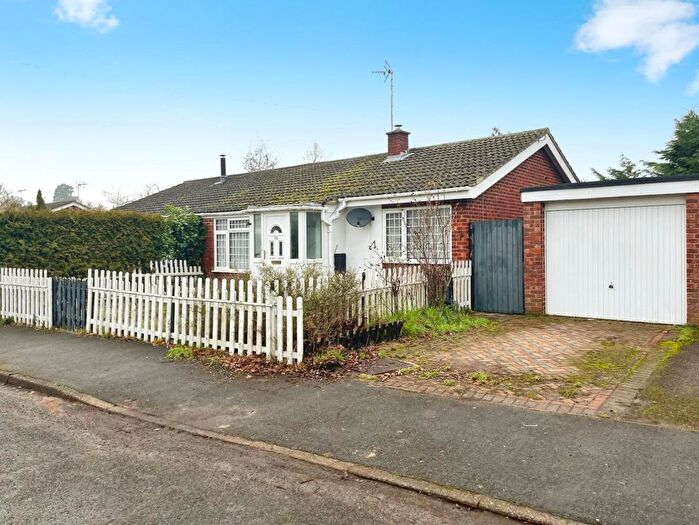
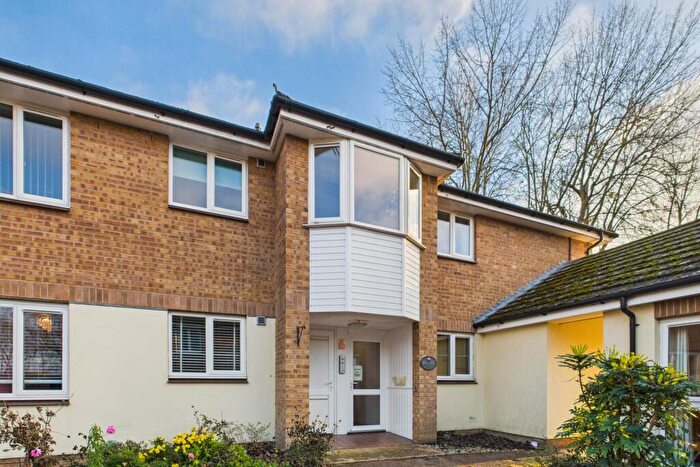
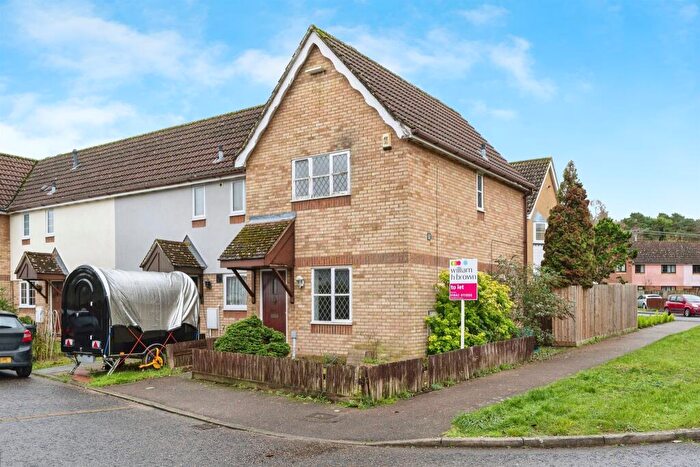
Properties in Brandon East have an average house price of £223,179.00 and had 279 Property Transactions within the last 3 years¹.
Brandon East is an area in Brandon, Suffolk with 2,428 households², where the most expensive property was sold for £550,000.00.
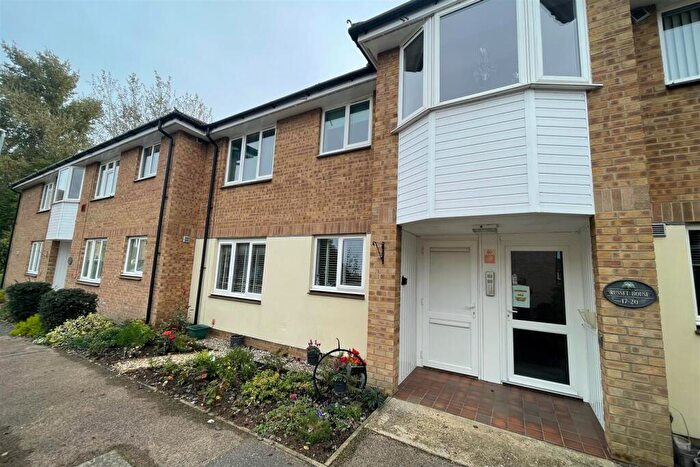
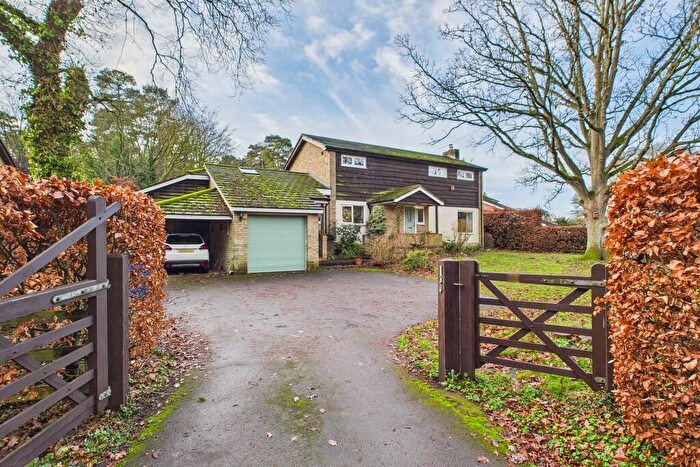
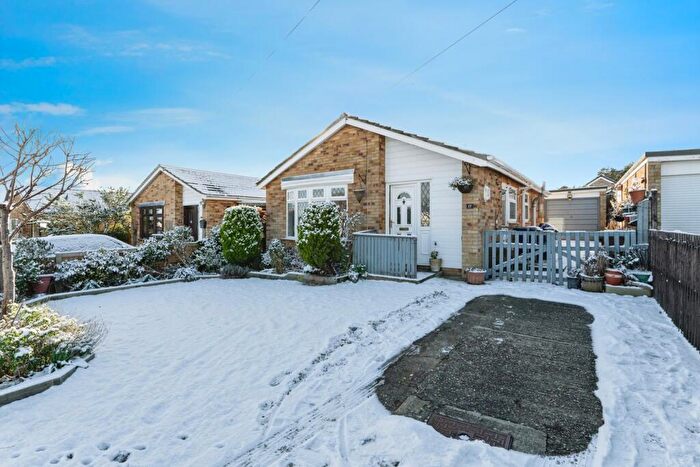
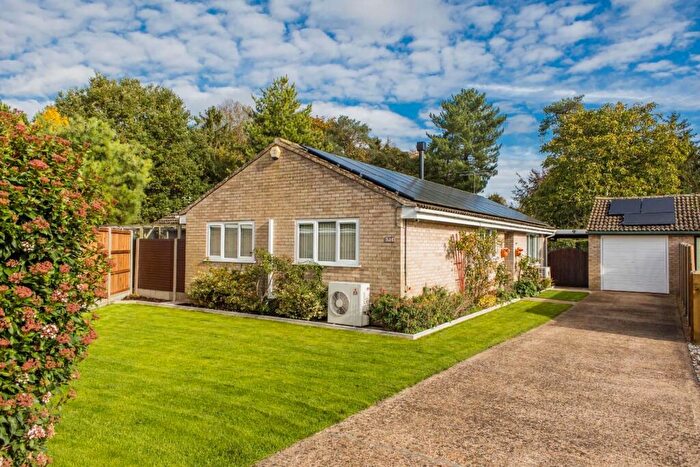
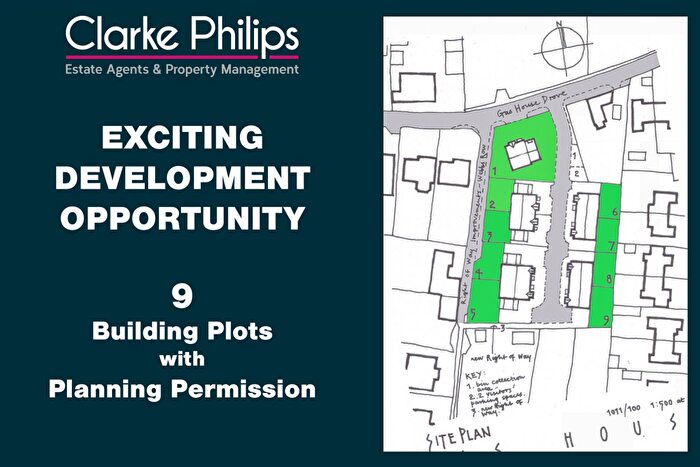
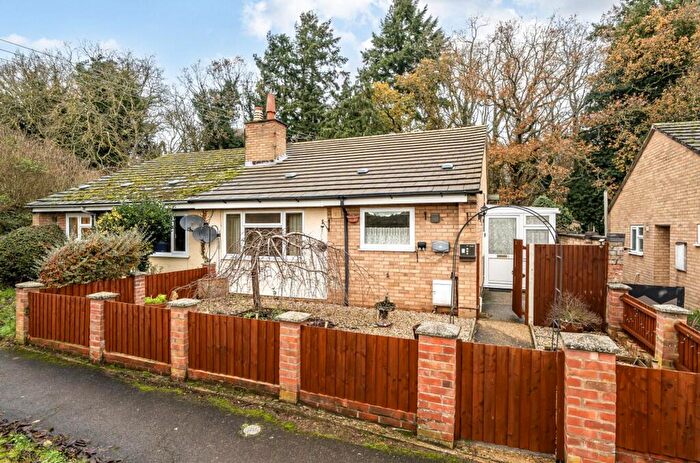
Properties for sale in Brandon East
Roads and Postcodes in Brandon East
Navigate through our locations to find the location of your next house in Brandon East, Brandon for sale or to rent.
| Streets | Postcodes |
|---|---|
| Ash Close | IP27 0YP |
| Beechfields | IP27 0UZ |
| Blackbird Avenue | IP27 0YG IP27 0YQ |
| Bracken Rise | IP27 0SX |
| Bury Road | IP27 0BT IP27 0BU |
| Cedar Way | IP27 0UX |
| Cherry Tree Close | IP27 0AR |
| Chestnut Close | IP27 0RU |
| Coulson Lane | IP27 0HT |
| Downham Way | IP27 0DZ IP27 0UH |
| Elizabeth Road | IP27 0EY IP27 0EZ |
| Elm Close | IP27 0YR |
| Falcon Drive | IP27 0UD |
| Gas House Drove | IP27 0EA IP27 0EB |
| Gentle Court | IP27 0HX |
| George Street | IP27 0BX |
| Hall Drive | IP27 0WB |
| Heath Road | IP27 0EF IP27 0EG |
| Heather Way | IP27 0SZ |
| Hellesdon Court | IP27 0BJ |
| Heron Avenue | IP27 0TD |
| High Street | IP27 0AQ IP27 0AU IP27 0AW IP27 0AX |
| Kestrel Drive | IP27 0UA |
| Kingfisher Drive | IP27 0TZ |
| Knappers Way | IP27 0DA |
| Laburnum Walk | IP27 0SR |
| Lark Close | IP27 0UQ |
| Leamon Court | IP27 0RR |
| Lingheath Road | IP27 0SY |
| Linnet Crescent | IP27 0YL |
| Lode Street | IP27 0BD |
| London Road | IP27 0AG IP27 0EL IP27 0HS IP27 0HY |
| Mallard Way | IP27 0YJ |
| Market Hill | IP27 0AA |
| Marks Lane | IP27 0TL |
| Martin Close | IP27 0YE |
| Mill Hill | IP27 0BP |
| Mount Road | IP27 0DT |
| Mounts Pit Lane | IP27 0DD |
| Nightingale Road | IP27 0UG |
| Partridge Walk | IP27 0YF |
| Pheasant Way | IP27 0BE |
| Plovers Court | IP27 0UB |
| Pump Lane | IP27 0TY |
| Rattlers Road | IP27 0EU IP27 0HA IP27 0HD |
| Riverside Way | IP27 0AN IP27 0JD |
| Robert Linge Crescent | IP27 0AP |
| Robin Walk | IP27 0UE IP27 0UF |
| Rought Avenue | IP27 0EH |
| Spruce Drive | IP27 0UL IP27 0UT IP27 0UU |
| St Anthonys Way | IP27 0DN |
| St Benedicts Road | IP27 0DP IP27 0UN IP27 0UP IP27 0UW |
| St Davids Close | IP27 0UR |
| St Dominics Drive | IP27 0DH IP27 0DQ IP27 0DR |
| St Francis Close | IP27 0DW |
| St Nicholas Walk | IP27 0DJ IP27 0DL |
| St Stephens Crescent | IP27 0DS |
| St Thomas Close | IP27 0XS |
| Stores Street | IP27 0AE |
| Stuart Close | IP27 0HB |
| Suffolk Court | IP27 0GY |
| Swallow Drive | IP27 0YA IP27 0YB IP27 0YD |
| Teal Walk | IP27 0BG |
| The Chase | IP27 0RT |
| The Maltings | IP27 0BL |
| The Orchard | IP27 0HR |
| The Paddocks | IP27 0DX IP27 0DY |
| Thetford Road | IP27 0BS IP27 0BZ IP27 0DB IP27 0DF IP27 0DG IP27 0ED IP27 0TE IP27 0TU IP27 0AF |
| Victoria Avenue | IP27 0HZ IP27 0JA |
| Walnut Close | IP27 0SP |
| Warren Close | IP27 0EE |
| Wellington Close | IP27 0BY |
| White Hart Lane | IP27 0AH |
| Willow Close | IP27 0UJ |
| Wood Close | IP27 0DU |
| Woodcock Cottages | IP27 0TN |
| Woodcock Rise | IP27 0BN |
| Wren Close | IP27 0TB |
| Yew Drive | IP27 0AB |
| IP27 0TF IP27 0TG IP27 0TH IP27 0TQ IP27 0TW IP27 0TJ IP27 0TX |
Transport near Brandon East
- FAQ
- Price Paid By Year
- Property Type Price
Frequently asked questions about Brandon East
What is the average price for a property for sale in Brandon East?
The average price for a property for sale in Brandon East is £223,179. This amount is 6% lower than the average price in Brandon. There are 1,102 property listings for sale in Brandon East.
What streets have the most expensive properties for sale in Brandon East?
The streets with the most expensive properties for sale in Brandon East are Marks Lane at an average of £515,500, Hall Drive at an average of £445,000 and Victoria Avenue at an average of £378,750.
What streets have the most affordable properties for sale in Brandon East?
The streets with the most affordable properties for sale in Brandon East are Yew Drive at an average of £80,000, Lode Street at an average of £96,500 and Leamon Court at an average of £97,166.
Which train stations are available in or near Brandon East?
Some of the train stations available in or near Brandon East are Brandon, Lakenheath and Thetford.
Property Price Paid in Brandon East by Year
The average sold property price by year was:
| Year | Average Sold Price | Price Change |
Sold Properties
|
|---|---|---|---|
| 2025 | £224,962 | 2% |
93 Properties |
| 2024 | £219,745 | -2% |
96 Properties |
| 2023 | £225,000 | -3% |
90 Properties |
| 2022 | £231,280 | 15% |
106 Properties |
| 2021 | £196,497 | 3% |
96 Properties |
| 2020 | £191,025 | -3% |
99 Properties |
| 2019 | £195,912 | 8% |
106 Properties |
| 2018 | £180,239 | 3% |
129 Properties |
| 2017 | £174,790 | 11% |
112 Properties |
| 2016 | £154,939 | 3% |
119 Properties |
| 2015 | £150,437 | 16% |
129 Properties |
| 2014 | £126,749 | 4% |
120 Properties |
| 2013 | £121,677 | 3% |
90 Properties |
| 2012 | £117,592 | -10% |
84 Properties |
| 2011 | £129,842 | -4% |
139 Properties |
| 2010 | £135,549 | 10% |
86 Properties |
| 2009 | £122,597 | 2% |
80 Properties |
| 2008 | £120,188 | -18% |
88 Properties |
| 2007 | £141,742 | 12% |
179 Properties |
| 2006 | £124,375 | 5% |
171 Properties |
| 2005 | £117,828 | -7% |
149 Properties |
| 2004 | £126,363 | 19% |
145 Properties |
| 2003 | £101,797 | 12% |
178 Properties |
| 2002 | £89,813 | 17% |
199 Properties |
| 2001 | £74,354 | 11% |
270 Properties |
| 2000 | £65,913 | 22% |
216 Properties |
| 1999 | £51,434 | 3% |
181 Properties |
| 1998 | £49,891 | 8% |
149 Properties |
| 1997 | £45,841 | 4% |
122 Properties |
| 1996 | £43,803 | -5% |
127 Properties |
| 1995 | £45,816 | - |
143 Properties |
Property Price per Property Type in Brandon East
Here you can find historic sold price data in order to help with your property search.
The average Property Paid Price for specific property types in the last three years are:
| Property Type | Average Sold Price | Sold Properties |
|---|---|---|
| Semi Detached House | £192,879.00 | 78 Semi Detached Houses |
| Detached House | £284,105.00 | 114 Detached Houses |
| Terraced House | £181,885.00 | 74 Terraced Houses |
| Flat | £105,769.00 | 13 Flats |

