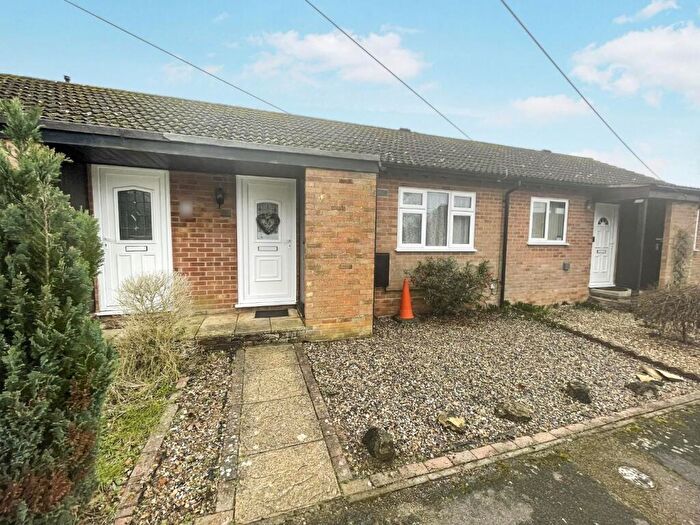
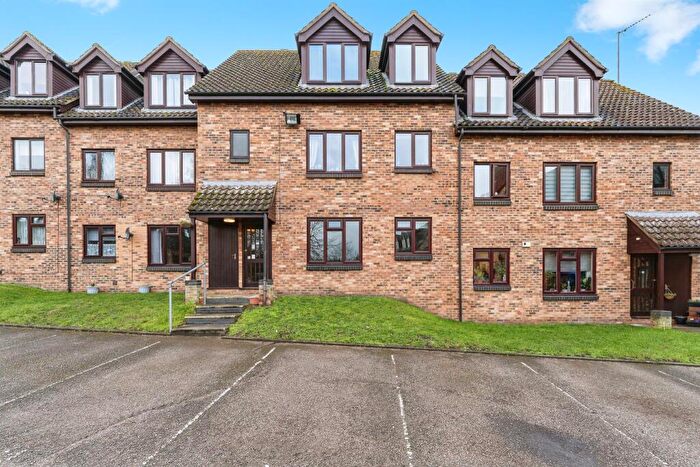
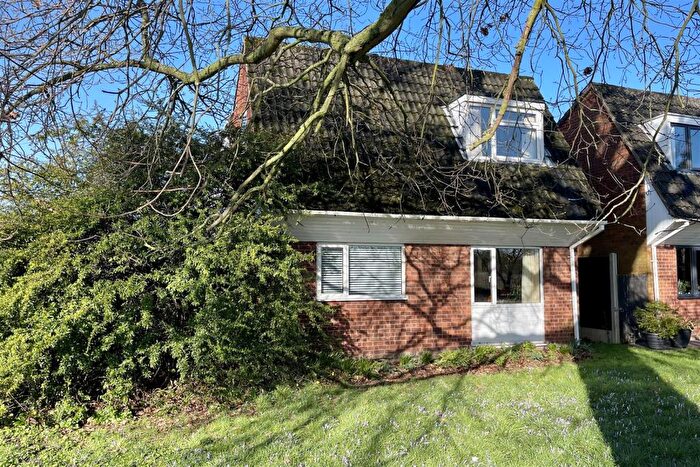
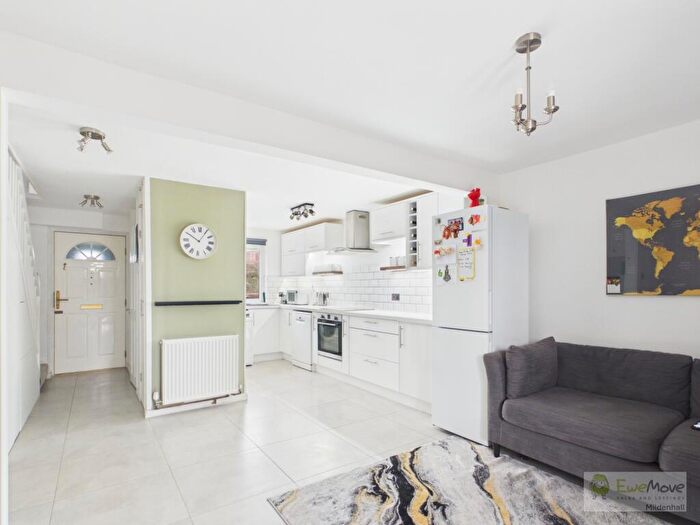
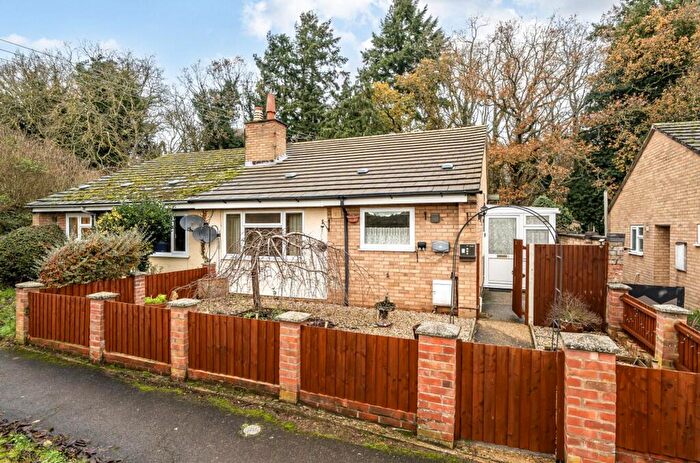
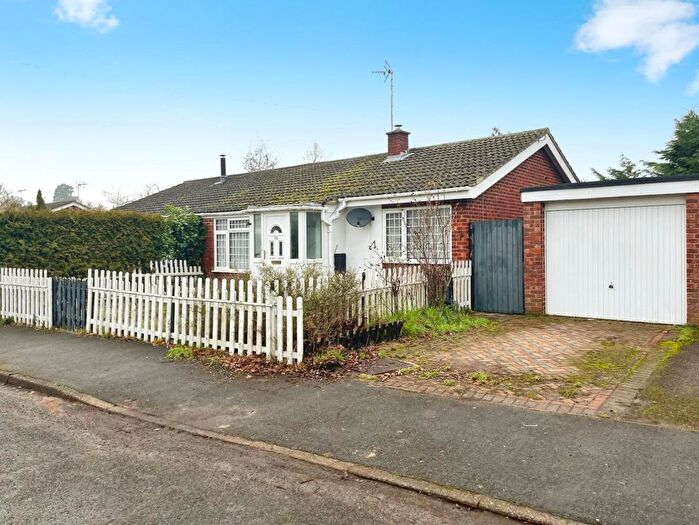
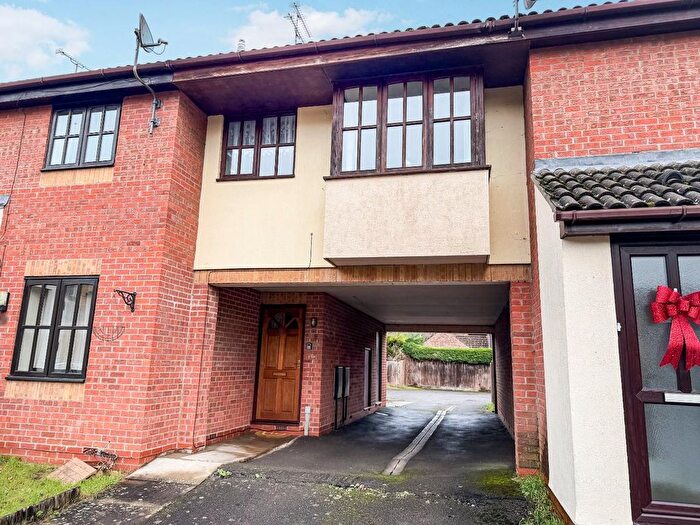
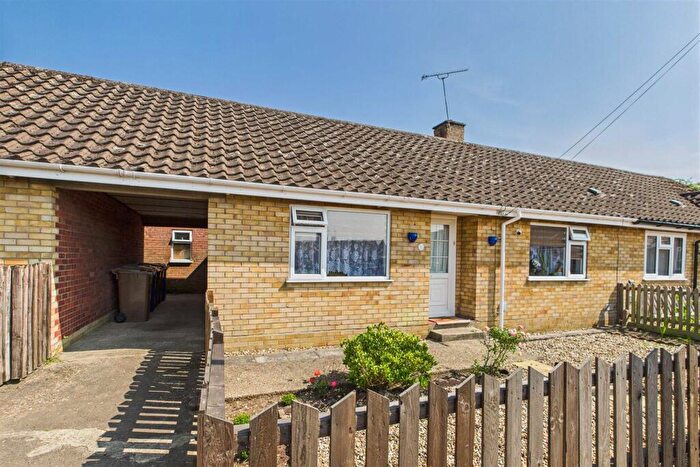
Houses for sale & to rent in Brandon West, Brandon
House Prices in Brandon West
Properties in Brandon West have an average house price of £233,790.00 and had 181 Property Transactions within the last 3 years¹.
Brandon West is an area in Brandon, Suffolk with 1,630 households², where the most expensive property was sold for £700,000.00.
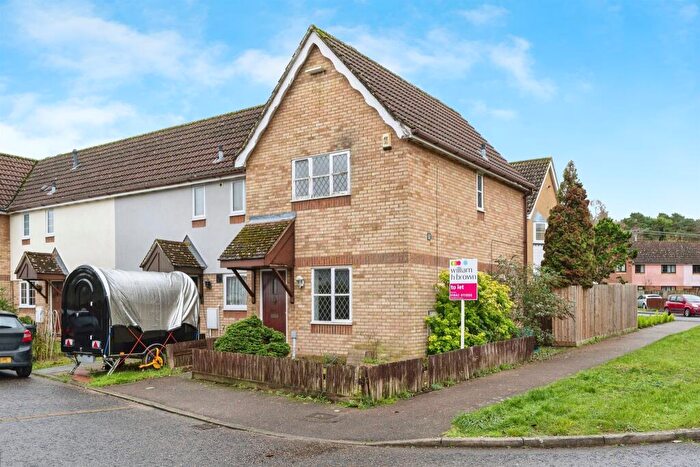
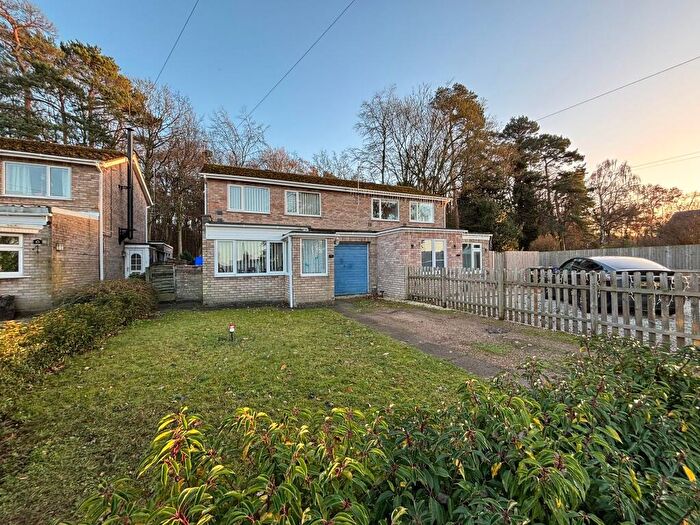
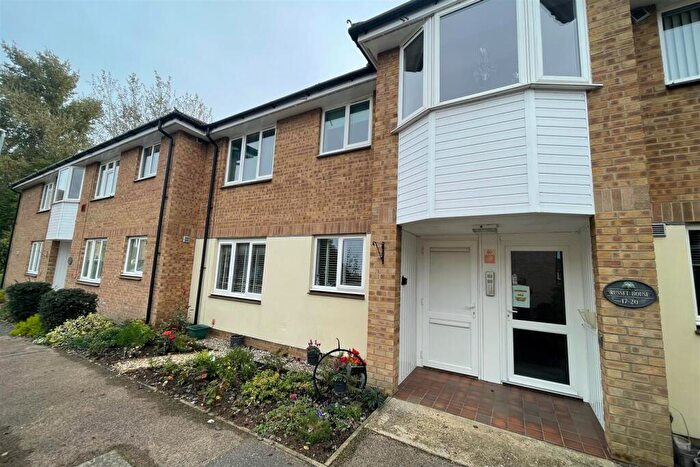
Properties for sale in Brandon West
Roads and Postcodes in Brandon West
Navigate through our locations to find the location of your next house in Brandon West, Brandon for sale or to rent.
| Streets | Postcodes |
|---|---|
| Ashdale Park | IP27 0LY |
| Barnes Close | IP27 0NY |
| Bluebell Walk | IP27 0XG |
| Brandon Fields | IP27 0SE |
| Brandon Park | IP27 0SU |
| Chalk Road | IP27 0SD |
| Church Close | IP27 0JQ |
| Church End | IP27 0JE |
| Church Road | IP27 0EN IP27 0JB |
| Coronation Place | IP27 0EP |
| Crown Street | IP27 0JR IP27 0JT IP27 0JU IP27 0NH IP27 0LF IP27 0PE |
| Cunningham Close | IP27 0SW |
| Edmund Road | IP27 0XA IP27 0XD |
| Field Road | IP27 0LN |
| Firs Way | IP27 0HE |
| Forest Close | IP27 0HQ |
| Highbury Road | IP27 0ND |
| Hillside | IP27 0NL IP27 0NN |
| Jasmine Court | IP27 0XN |
| Lavender Close | IP27 0XF |
| Lilac Close | IP27 0LW |
| London Road | IP27 0ER IP27 0EW IP27 0LP IP27 0LR IP27 0LX IP27 0LZ IP27 0NE |
| Manor House Close | IP27 0JF |
| Manor Road | IP27 0LG |
| May Day | IP27 0SS |
| Mile End | IP27 0NX IP27 0NG |
| Millers Lane | IP27 0LT |
| Norwood Road | IP27 0PB |
| Oaklands Drive | IP27 0NP IP27 0NR IP27 0NW |
| Parsons Close | IP27 0XL |
| Petunia Way | IP27 0XQ |
| Pinewood Drive | IP27 0HF IP27 0HG |
| Pond Lane | IP27 0JX IP27 0LA |
| Primrose Drive | IP27 0XE |
| Princes Close | IP27 0LH |
| Prospect Place | IP27 0NQ |
| Putney Close | IP27 0PA |
| Queens Road | IP27 0JJ IP27 0JL IP27 0JN |
| Rowan Drive | IP27 0EX IP27 0HJ |
| Saffron Close | IP27 0LS |
| Seymour Avenue | IP27 0XB IP27 0XH |
| Spinney Close | IP27 0HH |
| St Margarets Drive | IP27 0JP IP27 0JW |
| St Peters Approach | IP27 0JG |
| St Peters Place | IP27 0JH |
| Sweden Place | IP27 0LU |
| The Drove | IP27 0JY |
| The Rookery | IP27 0JZ IP27 0LL |
| The Street | IP27 0LE |
| Tower Close | IP27 0LJ |
| Twickenham Avenue | IP27 0PD |
| Walton Way | IP27 0HP |
| West Drive | IP27 0JS |
| White Horse Street | IP27 0LB |
| Wimbledon Avenue | IP27 0NZ |
| Woodlands Rise | IP27 0NS IP27 0NT IP27 0NU |
| IP27 0SF IP27 0SA IP27 0SJ |
Transport near Brandon West
- FAQ
- Price Paid By Year
- Property Type Price
Frequently asked questions about Brandon West
What is the average price for a property for sale in Brandon West?
The average price for a property for sale in Brandon West is £233,790. This amount is 2% lower than the average price in Brandon. There are 820 property listings for sale in Brandon West.
What streets have the most expensive properties for sale in Brandon West?
The streets with the most expensive properties for sale in Brandon West are Brandon Park at an average of £400,000, Millers Lane at an average of £358,333 and Church End at an average of £350,000.
What streets have the most affordable properties for sale in Brandon West?
The streets with the most affordable properties for sale in Brandon West are The Street at an average of £155,000, Church Road at an average of £158,500 and Church Close at an average of £171,750.
Which train stations are available in or near Brandon West?
Some of the train stations available in or near Brandon West are Brandon, Lakenheath and Thetford.
Property Price Paid in Brandon West by Year
The average sold property price by year was:
| Year | Average Sold Price | Price Change |
Sold Properties
|
|---|---|---|---|
| 2025 | £252,534 | 12% |
63 Properties |
| 2024 | £222,401 | -1% |
62 Properties |
| 2023 | £225,313 | -3% |
56 Properties |
| 2022 | £230,954 | 11% |
66 Properties |
| 2021 | £204,585 | 4% |
67 Properties |
| 2020 | £196,782 | 3% |
53 Properties |
| 2019 | £191,276 | 3% |
56 Properties |
| 2018 | £185,567 | 4% |
52 Properties |
| 2017 | £177,800 | 4% |
76 Properties |
| 2016 | £170,659 | 10% |
75 Properties |
| 2015 | £154,218 | 11% |
96 Properties |
| 2014 | £137,083 | 4% |
70 Properties |
| 2013 | £132,182 | 6% |
84 Properties |
| 2012 | £124,094 | 11% |
41 Properties |
| 2011 | £110,868 | -16% |
49 Properties |
| 2010 | £128,394 | 7% |
39 Properties |
| 2009 | £119,096 | -20% |
46 Properties |
| 2008 | £143,139 | 2% |
38 Properties |
| 2007 | £139,972 | 0,4% |
96 Properties |
| 2006 | £139,416 | 1% |
106 Properties |
| 2005 | £138,056 | 3% |
100 Properties |
| 2004 | £134,503 | 24% |
105 Properties |
| 2003 | £102,671 | 15% |
116 Properties |
| 2002 | £87,237 | 24% |
114 Properties |
| 2001 | £66,047 | 11% |
117 Properties |
| 2000 | £58,715 | 8% |
114 Properties |
| 1999 | £53,983 | 4% |
100 Properties |
| 1998 | £52,031 | -1% |
85 Properties |
| 1997 | £52,447 | 8% |
96 Properties |
| 1996 | £48,505 | -52% |
71 Properties |
| 1995 | £73,737 | - |
73 Properties |
Property Price per Property Type in Brandon West
Here you can find historic sold price data in order to help with your property search.
The average Property Paid Price for specific property types in the last three years are:
| Property Type | Average Sold Price | Sold Properties |
|---|---|---|
| Semi Detached House | £215,363.00 | 64 Semi Detached Houses |
| Detached House | £269,884.00 | 83 Detached Houses |
| Terraced House | £182,044.00 | 33 Terraced Houses |
| Flat | £125,000.00 | 1 Flat |

