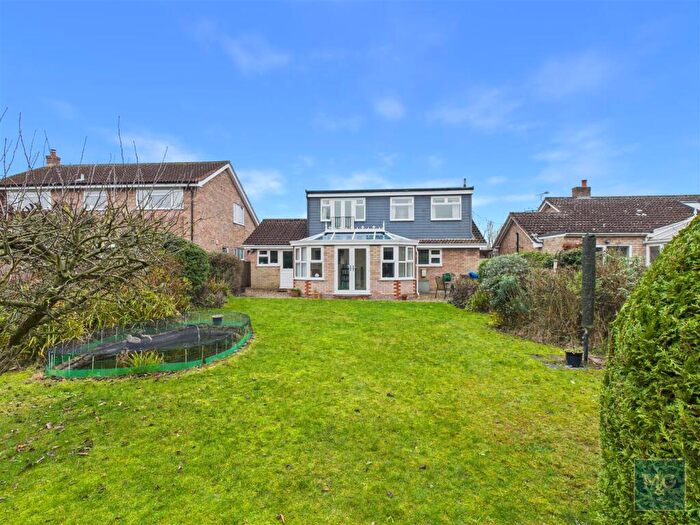
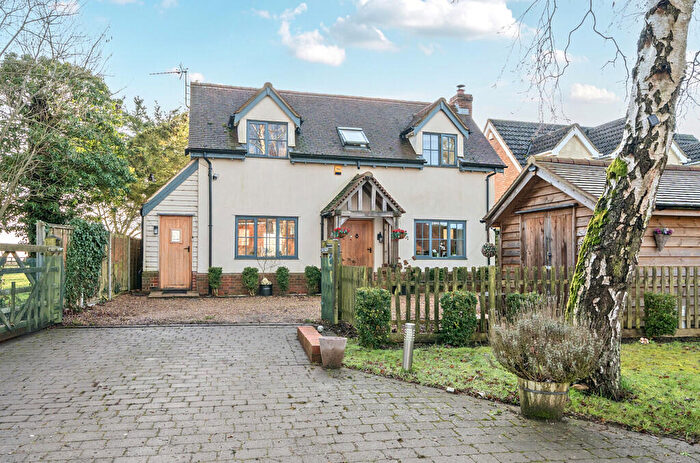
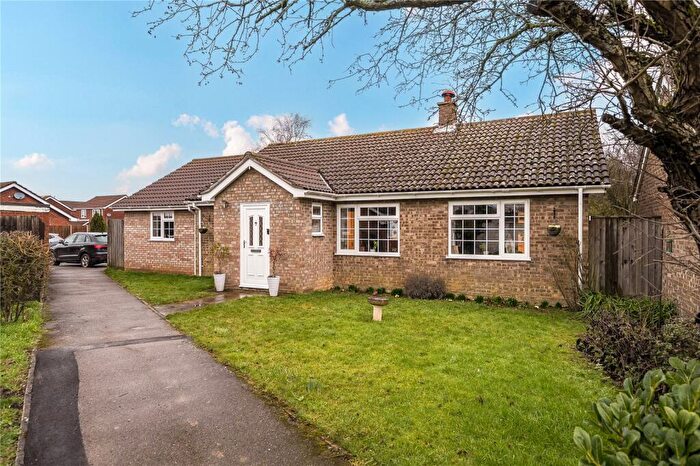
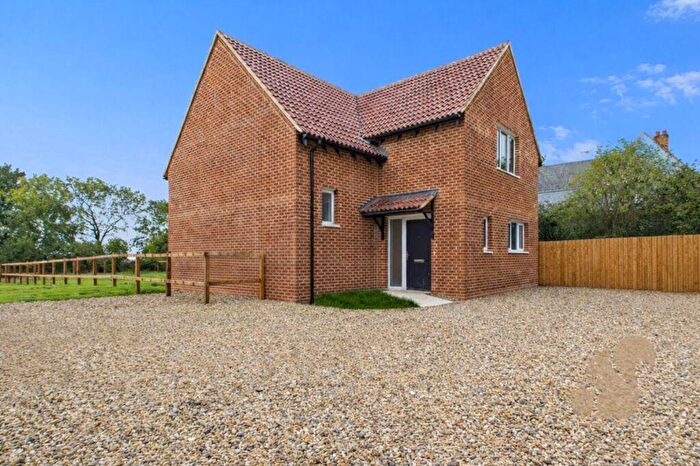
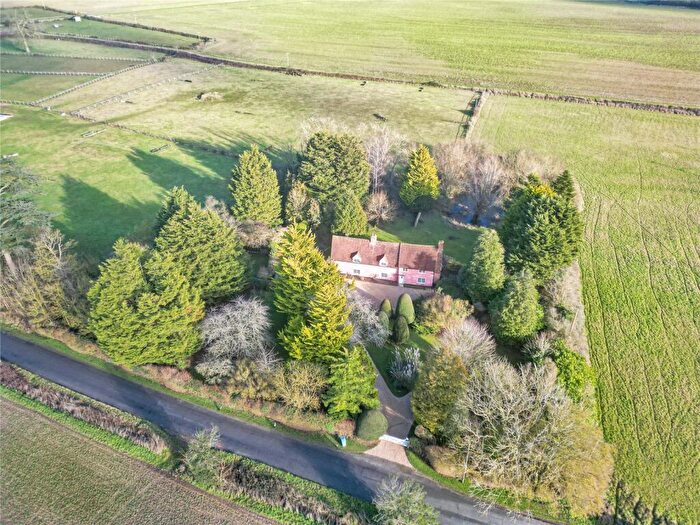
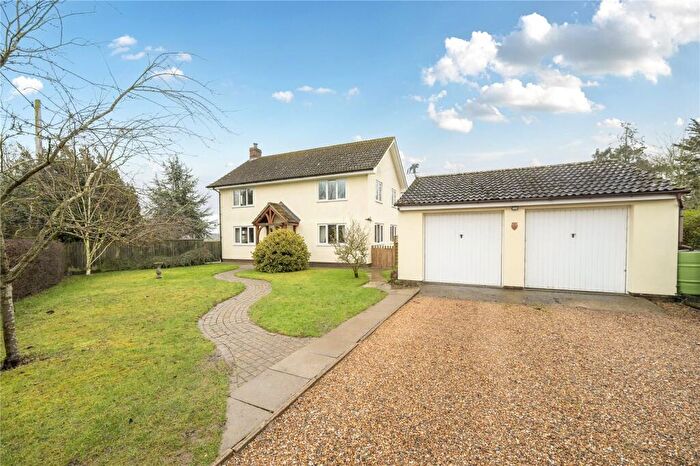
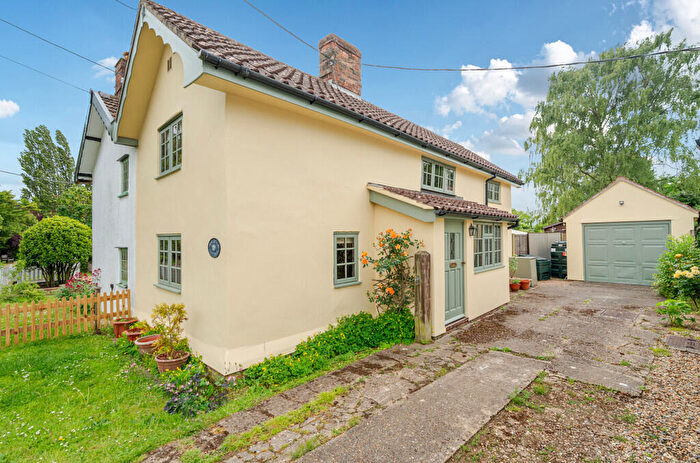
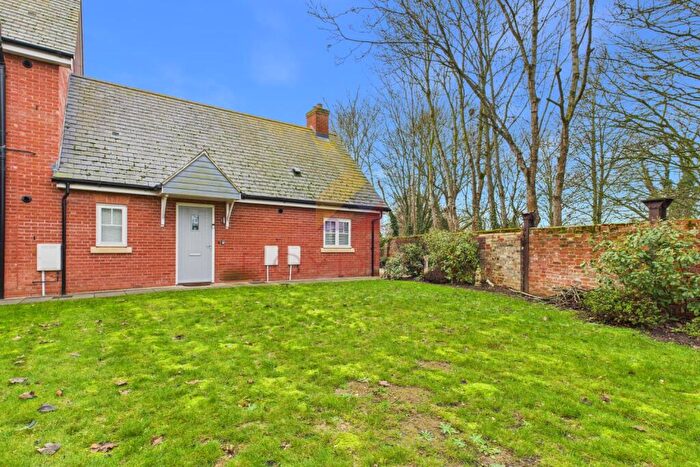
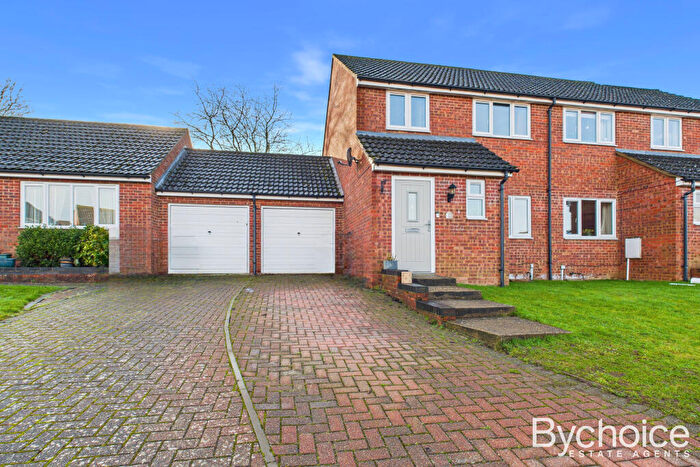
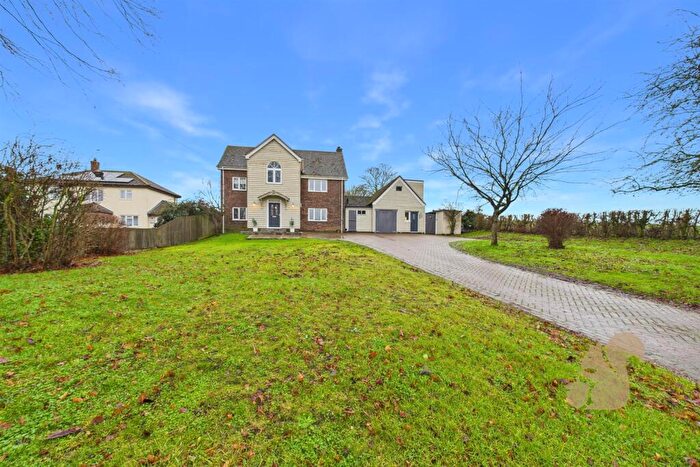
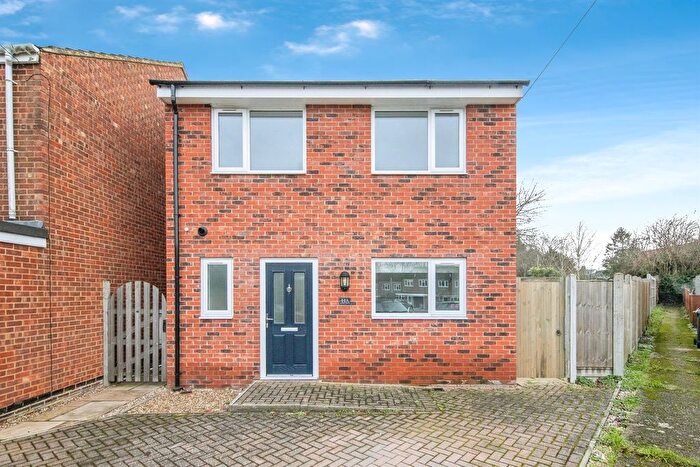
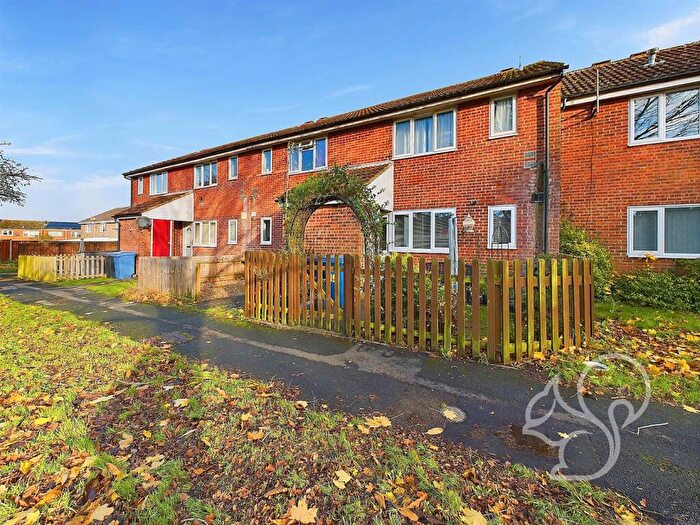
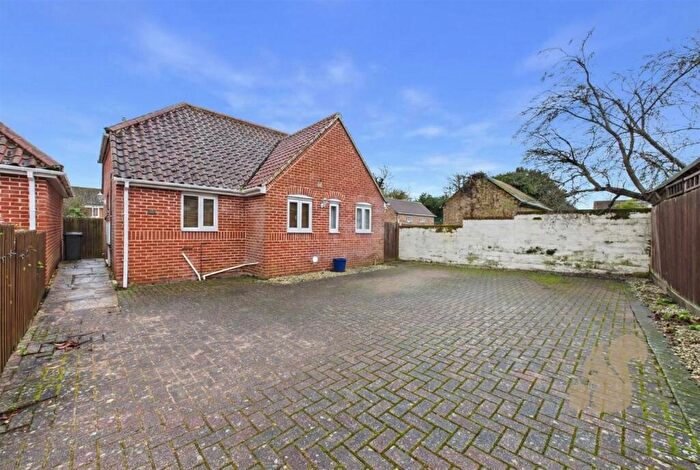
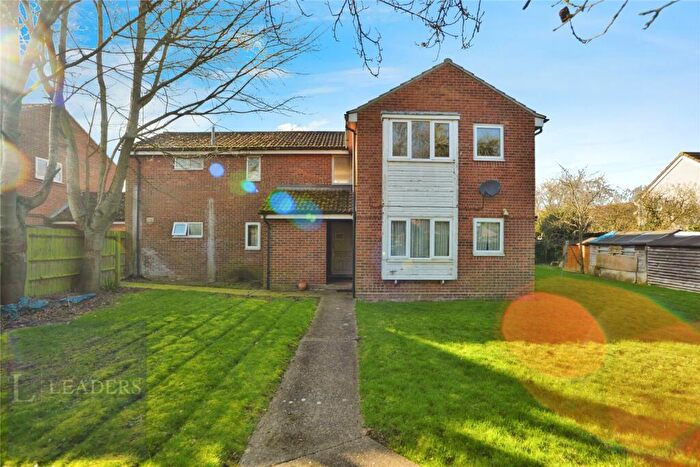
Houses for sale & to rent in Chadacre, Bury St Edmunds
House Prices in Chadacre
Properties in Chadacre have an average house price of £537,485.00 and had 70 Property Transactions within the last 3 years¹.
Chadacre is an area in Bury St Edmunds, Suffolk with 825 households², where the most expensive property was sold for £1,184,000.00.
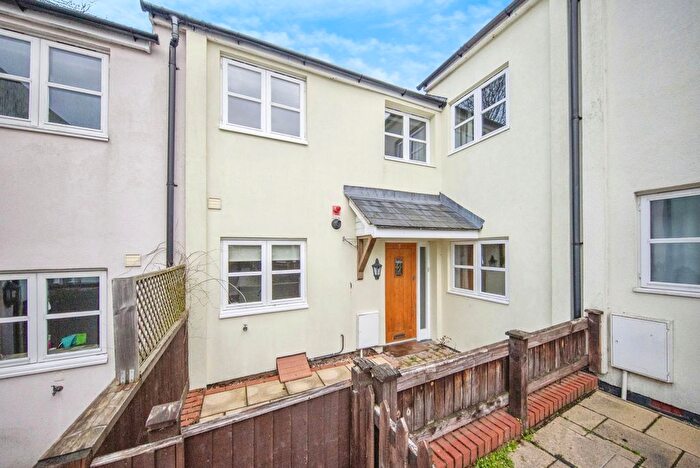
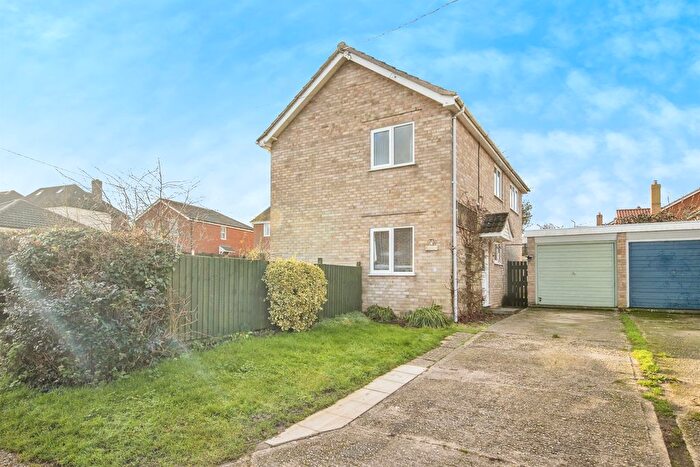
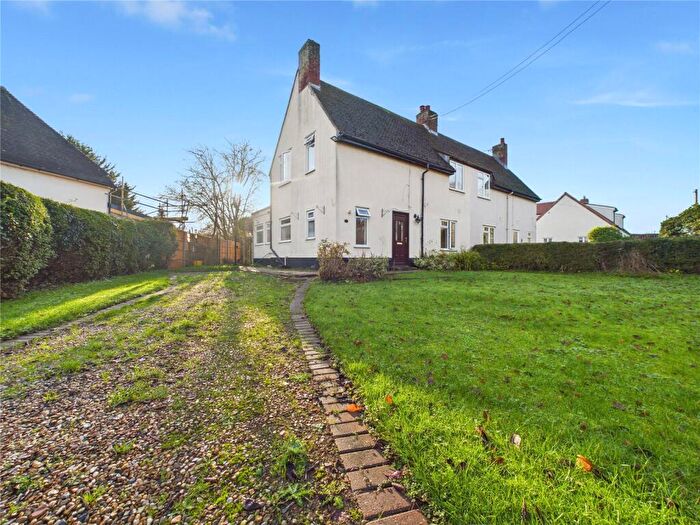
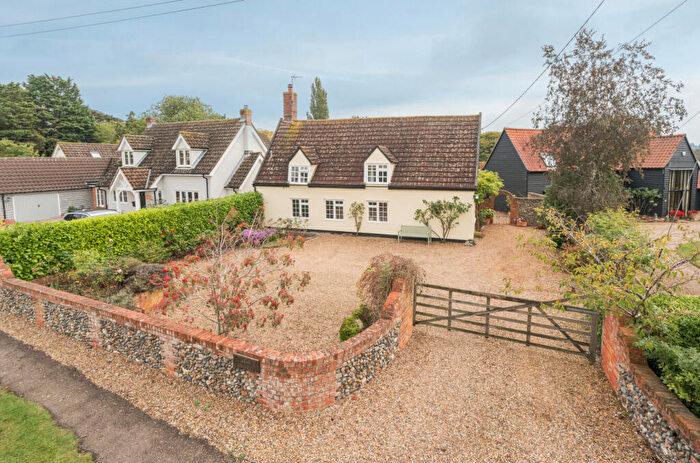
Properties for sale in Chadacre
Roads and Postcodes in Chadacre
Navigate through our locations to find the location of your next house in Chadacre, Bury St Edmunds for sale or to rent.
Transport near Chadacre
- FAQ
- Price Paid By Year
- Property Type Price
Frequently asked questions about Chadacre
What is the average price for a property for sale in Chadacre?
The average price for a property for sale in Chadacre is £537,485. This amount is 53% higher than the average price in Bury St Edmunds. There are 651 property listings for sale in Chadacre.
What streets have the most expensive properties for sale in Chadacre?
The streets with the most expensive properties for sale in Chadacre are Harrow Green at an average of £1,016,687, Folly Lane at an average of £900,000 and Smithbrook Lane at an average of £837,102.
What streets have the most affordable properties for sale in Chadacre?
The streets with the most affordable properties for sale in Chadacre are The Glebe at an average of £248,333, Brands Lane at an average of £251,000 and Churchill Close at an average of £380,000.
Which train stations are available in or near Chadacre?
Some of the train stations available in or near Chadacre are Bury St.Edmunds, Sudbury and Thurston.
Property Price Paid in Chadacre by Year
The average sold property price by year was:
| Year | Average Sold Price | Price Change |
Sold Properties
|
|---|---|---|---|
| 2025 | £599,124 | 24% |
19 Properties |
| 2024 | £453,153 | -33% |
30 Properties |
| 2023 | £602,190 | 21% |
21 Properties |
| 2022 | £474,586 | -12% |
26 Properties |
| 2021 | £529,271 | 15% |
40 Properties |
| 2020 | £448,141 | 13% |
25 Properties |
| 2019 | £388,160 | -2% |
25 Properties |
| 2018 | £396,730 | -2% |
26 Properties |
| 2017 | £406,302 | 7% |
30 Properties |
| 2016 | £378,607 | -15% |
27 Properties |
| 2015 | £433,849 | 20% |
30 Properties |
| 2014 | £348,435 | 14% |
39 Properties |
| 2013 | £301,299 | 18% |
25 Properties |
| 2012 | £245,947 | -14% |
19 Properties |
| 2011 | £280,192 | -27% |
26 Properties |
| 2010 | £355,083 | 23% |
24 Properties |
| 2009 | £273,577 | -37% |
32 Properties |
| 2008 | £374,697 | 13% |
24 Properties |
| 2007 | £324,834 | 23% |
43 Properties |
| 2006 | £250,338 | -20% |
38 Properties |
| 2005 | £300,814 | 10% |
49 Properties |
| 2004 | £269,413 | -0,3% |
32 Properties |
| 2003 | £270,235 | 16% |
35 Properties |
| 2002 | £226,058 | 16% |
51 Properties |
| 2001 | £190,205 | 20% |
41 Properties |
| 2000 | £152,929 | 23% |
34 Properties |
| 1999 | £117,960 | 16% |
38 Properties |
| 1998 | £98,860 | 9% |
35 Properties |
| 1997 | £89,725 | 7% |
30 Properties |
| 1996 | £83,627 | -10% |
31 Properties |
| 1995 | £91,904 | - |
32 Properties |
Property Price per Property Type in Chadacre
Here you can find historic sold price data in order to help with your property search.
The average Property Paid Price for specific property types in the last three years are:
| Property Type | Average Sold Price | Sold Properties |
|---|---|---|
| Semi Detached House | £399,531.00 | 16 Semi Detached Houses |
| Detached House | £600,729.00 | 50 Detached Houses |
| Terraced House | £298,750.00 | 4 Terraced Houses |

