
Houses for sale & to rent in Bury St Edmunds, Suffolk
House Prices in Bury St Edmunds
Properties in Bury St Edmunds have an average house price of £349k and had 4,815 Property Transactions within the last 3 years.¹
Bury St Edmunds is an area in Suffolk with 46,117 households², where the most expensive property was sold for £2.4M.
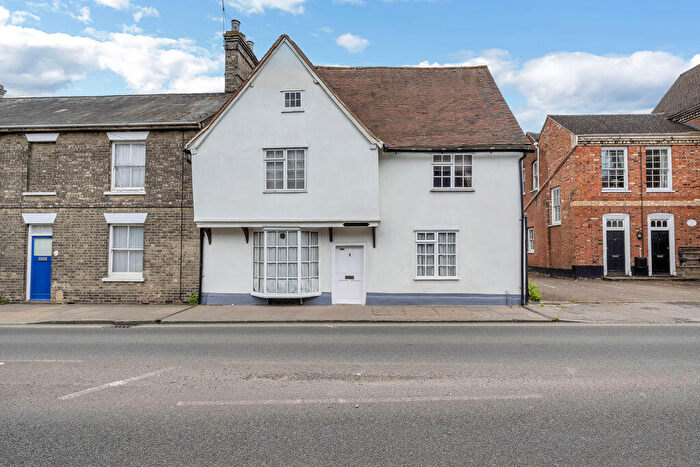
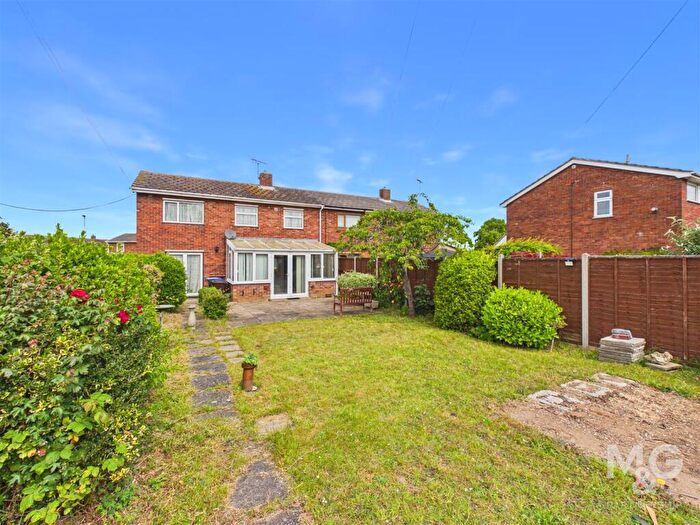
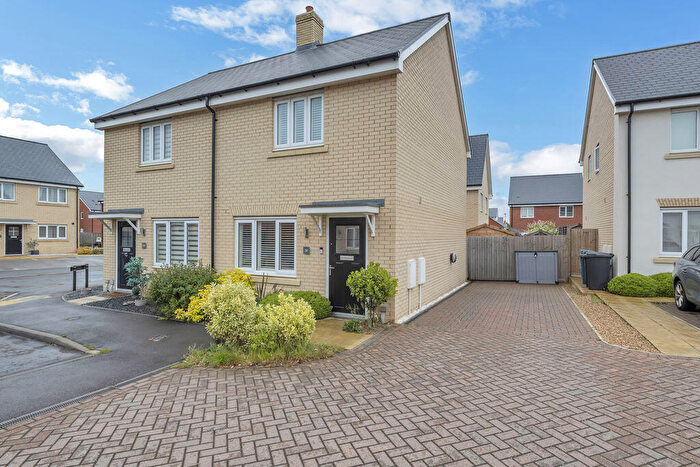
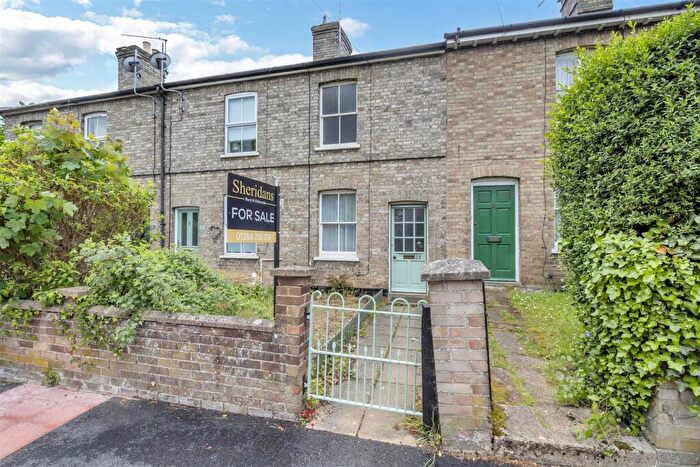
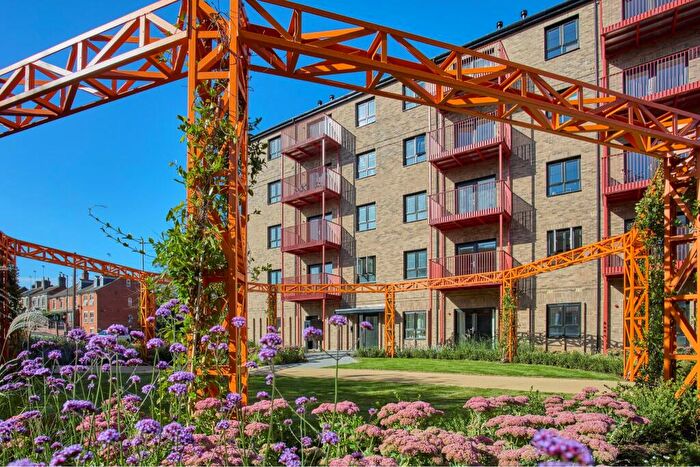
Properties for sale in Bury St Edmunds

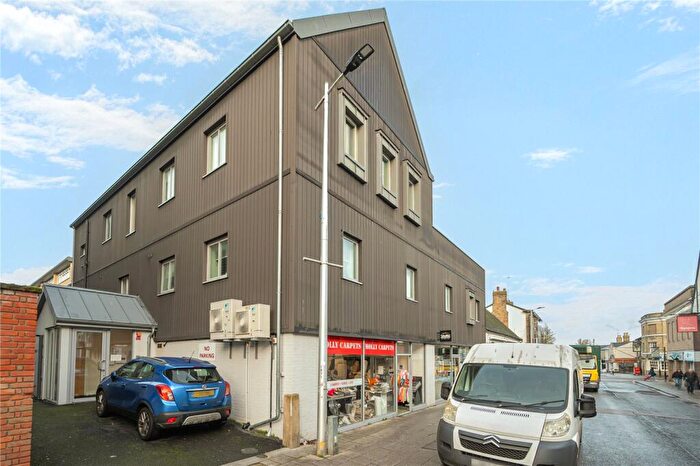
![]()
If you are looking to sell your house, let it out, or receive a property valuation, an expert can help you.
Click the button below to get started.


Neighbourhoods in Bury St Edmunds
Navigate through our locations to find the location of your next house in Bury St Edmunds, Suffolk for sale or to rent.
- Abbeygate
- Badwell Ash
- Bardwell
- Barningham
- Barrow
- Cavendish
- Chadacre
- Chedburgh
- Eastgate
- Elmswell And Norton
- Eriswell And The Rows
- Fornham
- Glemsford And Stanstead
- Great Barton
- Great Heath
- Horringer And Whelnetham
- Iceni
- Ixworth
- Manor
- Market
- Minden
- Moreton Hall
- North Cosford
- Northgate
- Pakenham
- Rattlesden
- Red Lodge
- Rickinghall And Walsham
- Risby
- Risbygate
- Rougham
- Southgate
- Stanton
- St Olaves
- Thurston And Hessett
- Westgate
- Wickhambrook
- Woolpit
- Mildenhall Queensway
- The Fornhams & Great Barton
- Kentford & Moulton
- Mildenhall Great Heath
- Mildenhall Kingsway & Market
- The Rows
- Fordham & Isleham
- Whepstead & Wickhambrook
- Chedburgh & Chevington
- Horringer
- North West Cosford
- Thurston
- Elmswell & Woolpit
- Haughley, Stowupland & Wetherden
- Pakenham & Troston
- Walsham-le-Willows
- Tollgate
- Lavenham
Transport in Bury St Edmunds
Please see below transportation links in this area:

- FAQ
- Price Paid By Year
- Property Type Price
Frequently asked questions about Bury St Edmunds
What is the average price for a property for sale in Bury St Edmunds?
The average price for a property for sale in Bury St Edmunds is £349,429. This amount is 9% higher than the average price in Suffolk. There are more than 10,000 property listings for sale in Bury St Edmunds.
What locations have the most expensive properties for sale in Bury St Edmunds?
The locations with the most expensive properties for sale in Bury St Edmunds are Thurston at an average of £584,000, Great Barton at an average of £559,108 and Wickhambrook at an average of £534,125.
What locations have the most affordable properties for sale in Bury St Edmunds?
The locations with the most affordable properties for sale in Bury St Edmunds are Horringer at an average of £203,721, Tollgate at an average of £216,793 and Great Heath at an average of £238,270.
Which train stations are available in or near Bury St Edmunds?
Some of the train stations available in or near Bury St Edmunds are Bury St.Edmunds, Thurston and Elmswell.
Property Price Paid in Bury St Edmunds by Year
The average sold property price by year was:
| Year | Average Sold Price | Price Change |
Sold Properties
|
|---|---|---|---|
| 2026 | £311,049 | -11% |
124 Properties |
| 2025 | £346,472 | -1% |
1,604 Properties |
| 2024 | £351,505 | -1% |
1,596 Properties |
| 2023 | £353,580 | -3% |
1,491 Properties |
| 2022 | £362,694 | 5% |
1,853 Properties |
| 2021 | £344,108 | 7% |
2,466 Properties |
| 2020 | £320,585 | 3% |
1,732 Properties |
| 2019 | £309,825 | -5% |
1,895 Properties |
| 2018 | £326,813 | 7% |
1,959 Properties |
| 2017 | £302,519 | 9% |
1,956 Properties |
| 2016 | £275,572 | 4% |
2,087 Properties |
| 2015 | £265,527 | 7% |
2,225 Properties |
| 2014 | £246,507 | 8% |
2,331 Properties |
| 2013 | £226,663 | 3% |
1,838 Properties |
| 2012 | £220,588 | 0,4% |
1,677 Properties |
| 2011 | £219,703 | 1% |
1,654 Properties |
| 2010 | £217,550 | 7% |
1,769 Properties |
| 2009 | £201,382 | -11% |
1,701 Properties |
| 2008 | £223,596 | -3% |
1,504 Properties |
| 2007 | £230,054 | 8% |
2,706 Properties |
| 2006 | £211,213 | 5% |
2,807 Properties |
| 2005 | £200,217 | 4% |
2,136 Properties |
| 2004 | £193,120 | 13% |
2,293 Properties |
| 2003 | £168,117 | 12% |
2,401 Properties |
| 2002 | £148,513 | 18% |
2,486 Properties |
| 2001 | £121,108 | 9% |
2,450 Properties |
| 2000 | £110,482 | 18% |
2,120 Properties |
| 1999 | £90,671 | 7% |
2,385 Properties |
| 1998 | £83,908 | 9% |
2,287 Properties |
| 1997 | £76,184 | 10% |
2,472 Properties |
| 1996 | £68,942 | 3% |
2,077 Properties |
| 1995 | £67,012 | - |
1,817 Properties |
Property Price per Property Type in Bury St Edmunds
Here you can find historic sold price data in order to help with your property search.
The average Property Paid Price for specific property types in the last three years are:
| Property Type | Average Sold Price | Sold Properties |
|---|---|---|
| Semi Detached House | £300,919.00 | 1,254 Semi Detached Houses |
| Terraced House | £275,405.00 | 1,280 Terraced Houses |
| Detached House | £470,544.00 | 1,855 Detached Houses |
| Flat | £187,259.00 | 426 Flats |