
Houses for sale in Barningham, Diss
House Prices in Barningham
Properties in Barningham have an average house price of £384k and had 66 Property Transactions within the last 3 years¹.
Barningham is an area in Diss, Suffolk with 741 households², where the most expensive property was sold for £1.58M.
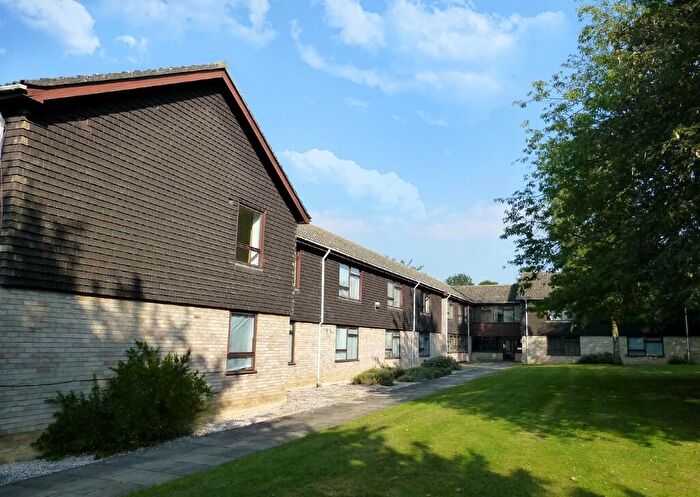
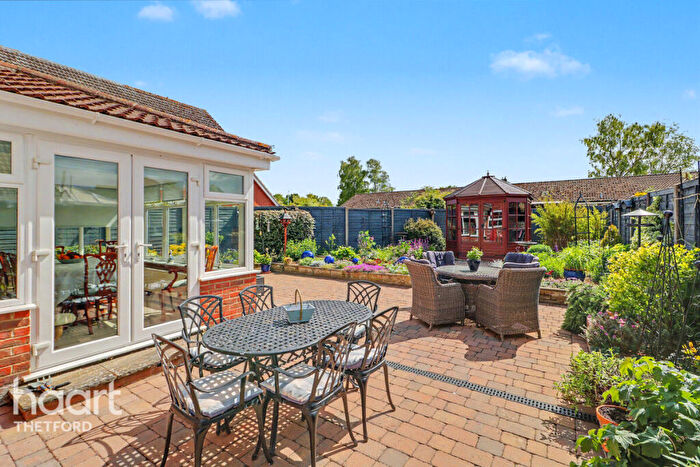
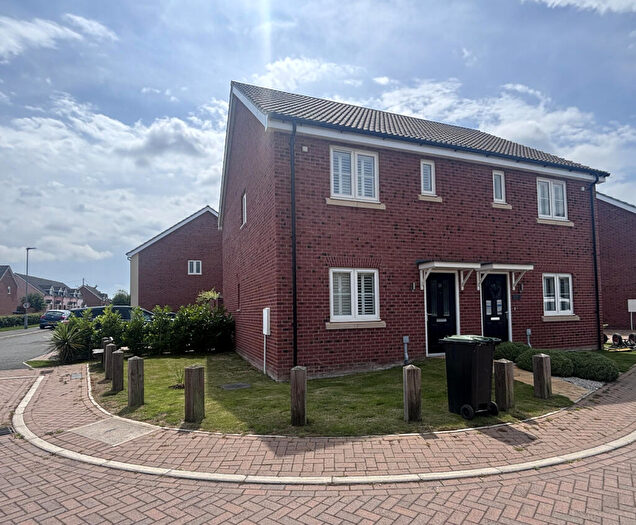
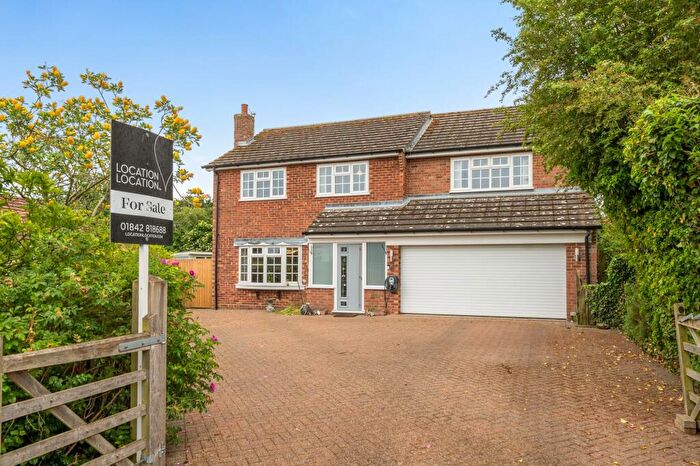
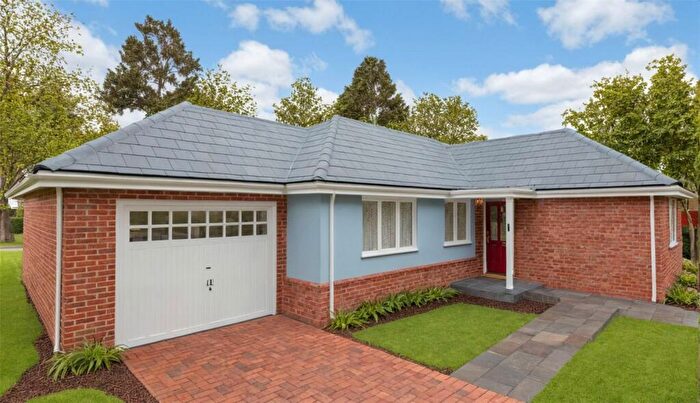
Properties for sale in Barningham
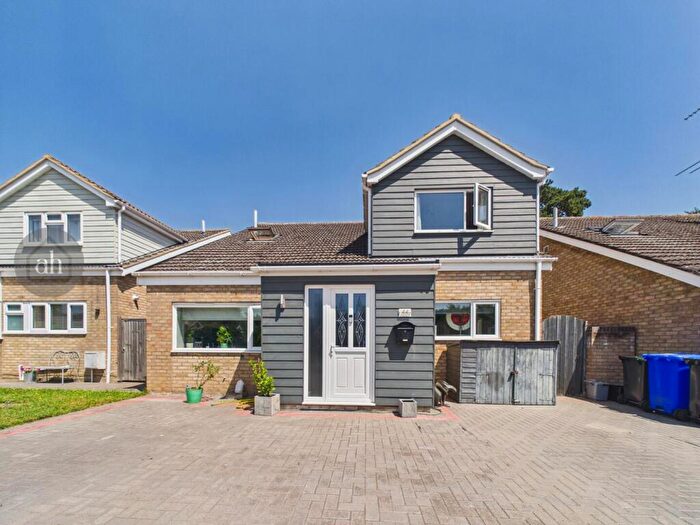
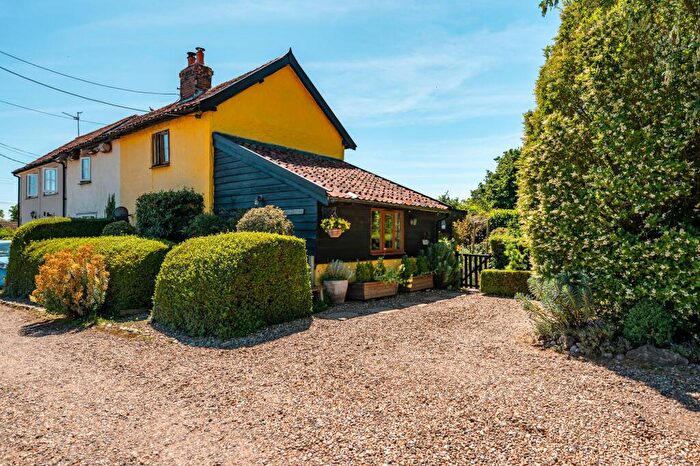
![]()
If you are looking to sell your house, let it out, or receive a property valuation, an expert can help you.
Click the button below to get started.

Roads and Postcodes in Barningham
Navigate through our locations to find the location of your next house in Barningham, Diss for sale or to rent.
| Streets | Postcodes |
|---|---|
| Beck Street | IP22 2PN |
| Buggs Hole Lane | IP22 1FE |
| Bury Road | IP22 2NU IP22 2PB IP22 2PD IP22 2QA |
| Church Close | IP22 2QF |
| Church Farm Lane | IP22 1JY |
| Church Hill | IP22 2TJ |
| Church Lane | IP22 1JZ IP22 2PU IP22 2PW IP22 2QE |
| Church Road | IP22 2NX |
| Clay Lane | IP22 2QD |
| Common Road | IP22 2QS IP22 2QT IP22 2QU |
| Cross Green | IP22 1JR |
| Dunhill Lane | IP22 2QB |
| Fen Road | IP22 1JX |
| Fen Street | IP22 2RF |
| Grove Close | IP22 2PY |
| Half Moon Close | IP22 2PJ |
| Heath Road | IP22 2TQ |
| Hepworth Road | IP22 2PF IP22 2PQ |
| High Street | IP22 1JL IP22 2QX |
| Holme Close | IP22 2QL |
| Homepiece | IP22 2PH |
| Hopton Road | IP22 1JN IP22 1JP IP22 1JW |
| Lewis Close | IP22 2QH |
| Market Weston Road | IP22 1JH IP22 1JJ IP22 2PL |
| Mill Lane | IP22 2RG |
| Mill Road | IP22 1JS IP22 1JT |
| Nethergate Street | IP22 2RB IP22 2QZ IP22 2RA IP22 2RD IP22 2RE |
| New Common Road | IP22 2PG |
| North Common | IP22 2PP IP22 2PR |
| North Drive | IP22 2BX |
| Norwich Lane | IP22 2TG |
| Pig Lane | IP22 1QU |
| Pine Tree Court | IP22 2QQ |
| Pond End Lane | IP22 2PA |
| School Lane | IP22 1LD |
| Shickle Place | IP22 2QR |
| Short Grove Lane | IP22 2RP |
| South Drive | IP22 2HF |
| Sumner Road | IP22 2PZ |
| The Crossroads | IP22 2TH |
| The Street | IP22 2NZ IP22 2PE IP22 2PS IP22 2PX |
| Thelnetham Road | IP22 2QY |
| Walnut Close | IP22 2NT |
| Water Lane | IP22 1JU |
| Wattisfield Road | IP22 1JE IP22 1JF IP22 1JG IP22 1JQ IP22 1NN |
| Wood Lane | IP22 2PT |
Property price trends in Barningham
According to the latest Land Registry data, the average home in Barningham sold for £302,500 in 2026. That figure comes from 802 sales logged over the past 31 years.
Prices have fallen back over the last three years. Compared with 2023, when the typical sale came in around £378,535, that's a fall of roughly 20.1%.
Looking back five years, average prices are down about 25.9% since 2021, a drop of around £105,471 in cash terms.
Zoom out to the past decade for the fuller picture. Back in 2016, homes here averaged £364,854, so the typical sold price has fallen about 17.1% since then, around 1.9% a year lower. Stretch the view to fifteen years and that annual pace edges up closer to -0.3%.
Frequently asked questions about Barningham
What is the average price for a property for sale in Barningham?
The average price for a property for sale in Barningham is £384,212. This amount is 7% lower than the average price in Diss. There are 629 property listings for sale in Barningham.
What streets have the most expensive properties for sale in Barningham?
The streets with the most expensive properties for sale in Barningham are Fen Road at an average of £650,000, The Street at an average of £508,727 and Market Weston Road at an average of £492,000.
What streets have the most affordable properties for sale in Barningham?
The streets with the most affordable properties for sale in Barningham are Grove Close at an average of £215,666, Pine Tree Court at an average of £225,000 and Lewis Close at an average of £229,000.
Which train stations are available in or near Barningham?
Some of the train stations available in or near Barningham are Harling Road, Eccles Road and Elmswell.
Property Price Paid in Barningham by Year
The average sold property price by year was:
| Year | Average Sold Price | Price Change |
Sold Properties
|
|---|---|---|---|
| 2026 | £302,500 | -13% |
2 Properties |
| 2025 | £342,270 | -26% |
24 Properties |
| 2024 | £432,269 | 12% |
26 Properties |
| 2023 | £378,535 | -19% |
14 Properties |
| 2022 | £451,619 | 10% |
21 Properties |
| 2021 | £407,971 | 27% |
21 Properties |
| 2020 | £299,048 | -28% |
22 Properties |
| 2019 | £382,750 | 0,2% |
30 Properties |
| 2018 | £381,901 | 6% |
26 Properties |
| 2017 | £358,041 | -2% |
26 Properties |
Property Price per Property Type in Barningham
Here you can find historic sold price data in order to help with your property search.
The average Property Paid Price for specific property types in the last three years are:
| Property Type | Average Sold Price | Sold Properties |
|---|---|---|
| Semi Detached House | £303,416.00 | 18 Semi Detached Houses |
| Detached House | £438,146.00 | 41 Detached Houses |
| Terraced House | £276,071.00 | 7 Terraced Houses |
