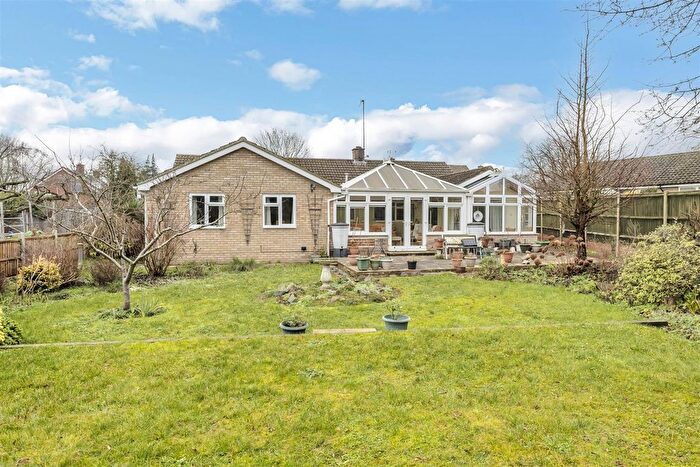
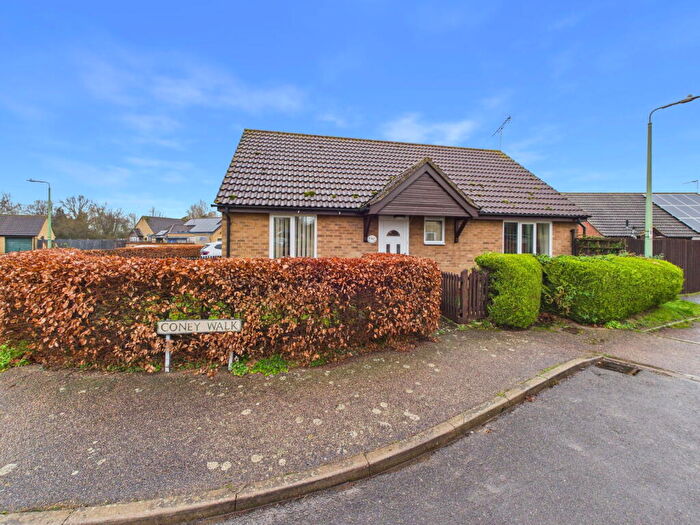
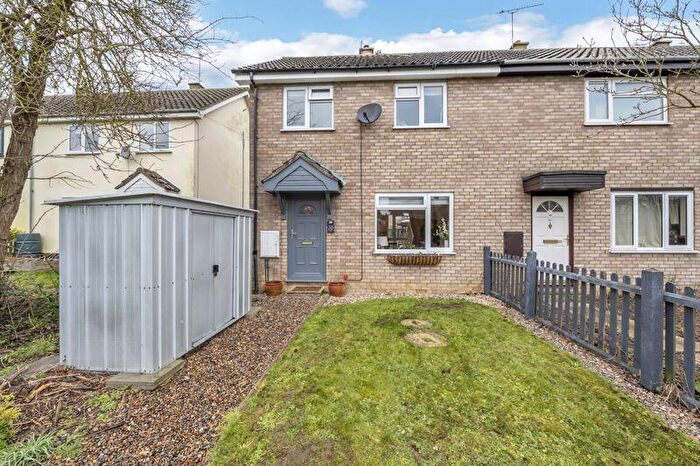
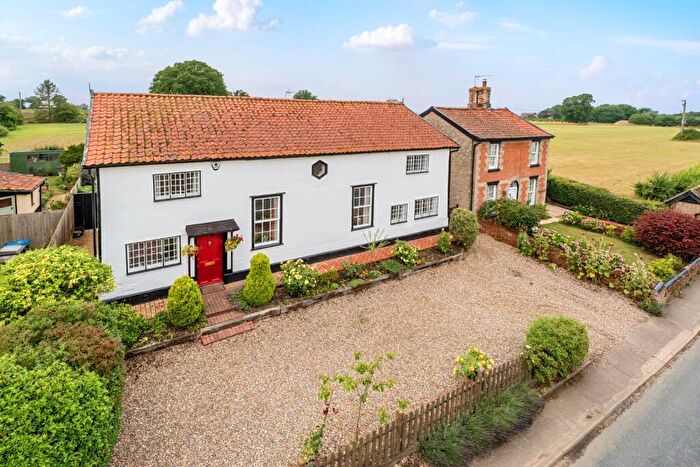
Houses for sale & to rent in Stanton, Bury St Edmunds
House Prices in Stanton
Properties in Stanton have an average house price of £284,643.00 and had 87 Property Transactions within the last 3 years¹.
Stanton is an area in Bury St Edmunds, Suffolk with 1,091 households², where the most expensive property was sold for £775,000.00.
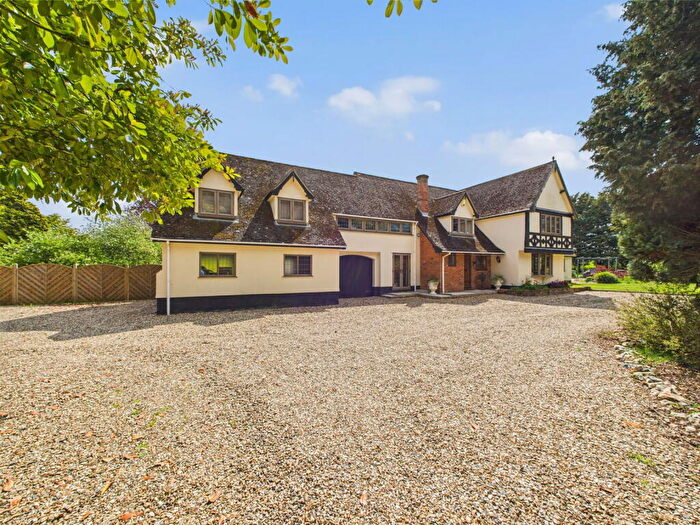
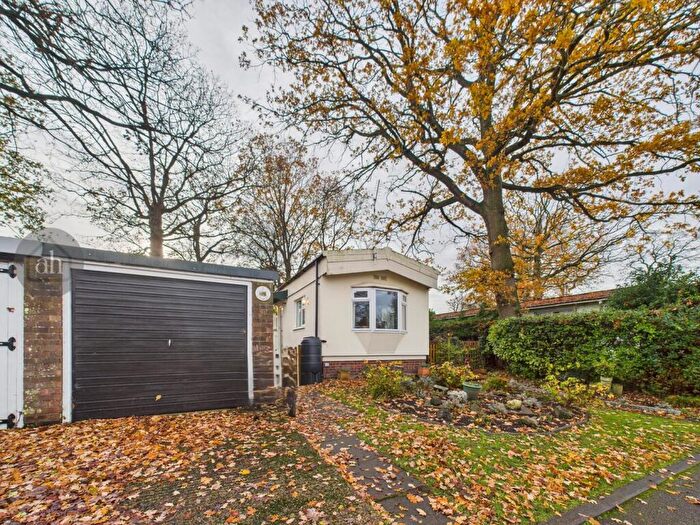
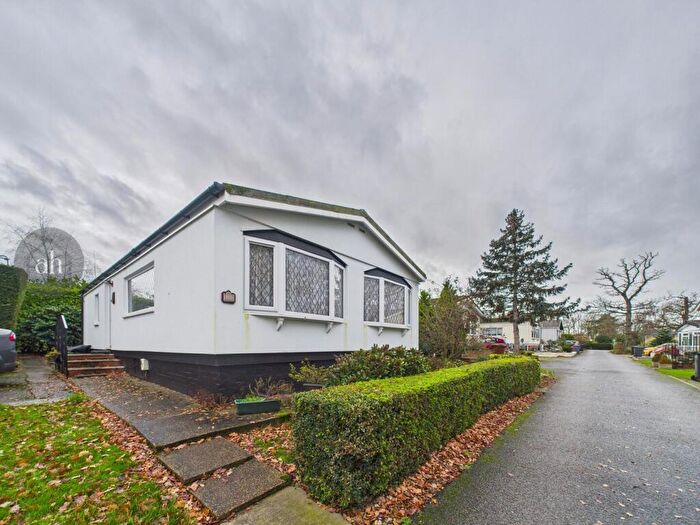
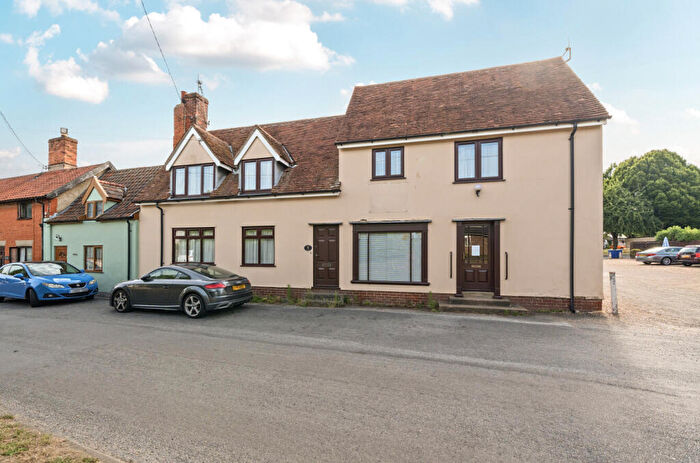
Properties for sale in Stanton
Roads and Postcodes in Stanton
Navigate through our locations to find the location of your next house in Stanton, Bury St Edmunds for sale or to rent.
| Streets | Postcodes |
|---|---|
| Angel Close | IP31 2HU |
| Avey Walk | IP31 2FA |
| Bardwell Road | IP31 2EA |
| Barningham Road | IP31 2DU IP31 2DT |
| Bobbys Way | IP31 2FE |
| Brook Close | IP31 2DD |
| Buckles Field | IP31 2BH |
| Bury Lane | IP31 2DE IP31 2DF |
| Bury Road | IP31 2BZ IP31 2DR |
| Capell Walk | IP31 2XJ |
| Catchpole Way | IP31 2BJ |
| Chapel Walk | IP31 2AG |
| Chare Road | IP31 2DX |
| Charity William Way | IP31 2FB |
| Church Close | IP31 2BY |
| Coney Walk | IP31 2XB |
| Culvers Meadow | IP31 2XT |
| Dale Road | IP31 2DY |
| Diss Road | IP31 2BD |
| Drovers Rise | IP31 2BW |
| Dudding Walk | IP31 2BQ |
| Duke Street | IP31 2AB IP31 2AA |
| Field Court | IP31 2AX |
| Field Way | IP31 2AH |
| Fordhams Close | IP31 2EE |
| George Hill | IP31 2AD |
| George Lane | IP31 2UB |
| Gilbert Road | IP31 2AS IP31 2AU |
| Goldsmith Way | IP31 2FD |
| Grove Lane | IP31 2BB |
| Grundle Close | IP31 2XD |
| Hepworth Road | IP31 2AE IP31 2UA IP31 2BT |
| Hervey Walk | IP31 2BE |
| Hilltop Way | IP31 2EB |
| Honeymeade Close | IP31 2EF |
| Horseshoe Rise | IP31 2AT |
| Jacobs Close | IP31 2JR |
| Lofft Close | IP31 2XE |
| Meadow Court | IP31 2AQ |
| Michaelhouse Way | IP31 2XG |
| Micklefields | IP31 2XF |
| Newlands Close | IP31 2EQ |
| North Close | IP31 2BL |
| Old Barningham Road | IP31 2BA |
| Old Bury Road | IP31 2BS IP31 2BX IP31 2DA |
| Old Rectory Gardens | IP31 2JH |
| Paddock View | IP31 2FF |
| Park Farm Drive | IP31 2DL |
| Parkside | IP31 2XL |
| Potters Lane | IP31 2AN |
| Rose & Crown Court | IP31 2FL |
| School Close | IP31 2DG |
| Shepherds Grove Industrial Estate | IP31 2AR IP31 2FN |
| Shepherds Grove Industrial Estate East | IP31 2BF |
| Shepherds Grove Park | IP31 2AY IP31 2AZ IP31 2BN |
| Shetlands | IP31 2XH |
| Stanton Chare | IP31 2DZ |
| Sturgeon Way | IP31 2ED |
| The Chase | IP31 2XA |
| The Knowle | IP31 2AF |
| The Street | IP31 2BP IP31 2DB IP31 2DQ |
| Upthorpe Road | IP31 2AP IP31 2AW IP31 2BU IP31 2AJ |
| Windmill Green | IP31 2AL |
| Woodlands Way | IP31 2UH |
| Wyken Road | IP31 2DJ IP31 2DN IP31 2DW IP31 2EG |
| IP31 2DH IP31 3AS IP31 3AR |
Transport near Stanton
- FAQ
- Price Paid By Year
- Property Type Price
Frequently asked questions about Stanton
What is the average price for a property for sale in Stanton?
The average price for a property for sale in Stanton is £284,643. This amount is 19% lower than the average price in Bury St Edmunds. There are 264 property listings for sale in Stanton.
What streets have the most expensive properties for sale in Stanton?
The streets with the most expensive properties for sale in Stanton are Dale Road at an average of £547,500, Old Bury Road at an average of £406,666 and Old Barningham Road at an average of £365,000.
What streets have the most affordable properties for sale in Stanton?
The streets with the most affordable properties for sale in Stanton are Field Court at an average of £87,500, Stanton Chare at an average of £160,000 and Sturgeon Way at an average of £180,333.
Which train stations are available in or near Stanton?
Some of the train stations available in or near Stanton are Elmswell, Thurston and Bury St.Edmunds.
Property Price Paid in Stanton by Year
The average sold property price by year was:
| Year | Average Sold Price | Price Change |
Sold Properties
|
|---|---|---|---|
| 2025 | £295,148 | 4% |
27 Properties |
| 2024 | £283,736 | 3% |
36 Properties |
| 2023 | £274,187 | -6% |
24 Properties |
| 2022 | £291,333 | 1% |
54 Properties |
| 2021 | £289,131 | 20% |
53 Properties |
| 2020 | £231,365 | -21% |
26 Properties |
| 2019 | £280,701 | 5% |
46 Properties |
| 2018 | £267,895 | 4% |
34 Properties |
| 2017 | £256,680 | 14% |
36 Properties |
| 2016 | £221,558 | 2% |
91 Properties |
| 2015 | £218,193 | 16% |
64 Properties |
| 2014 | £183,160 | 15% |
79 Properties |
| 2013 | £156,529 | -5% |
34 Properties |
| 2012 | £164,351 | -17% |
61 Properties |
| 2011 | £192,997 | 16% |
18 Properties |
| 2010 | £161,979 | -1% |
24 Properties |
| 2009 | £163,547 | -30% |
25 Properties |
| 2008 | £212,200 | 6% |
15 Properties |
| 2007 | £199,083 | 18% |
34 Properties |
| 2006 | £162,527 | -5% |
45 Properties |
| 2005 | £170,149 | 2% |
33 Properties |
| 2004 | £167,368 | 20% |
40 Properties |
| 2003 | £134,626 | 4% |
52 Properties |
| 2002 | £129,835 | 22% |
45 Properties |
| 2001 | £100,684 | -3% |
40 Properties |
| 2000 | £103,339 | 36% |
44 Properties |
| 1999 | £66,479 | -31% |
39 Properties |
| 1998 | £86,783 | 30% |
56 Properties |
| 1997 | £60,751 | -6% |
57 Properties |
| 1996 | £64,361 | 16% |
43 Properties |
| 1995 | £54,133 | - |
36 Properties |
Property Price per Property Type in Stanton
Here you can find historic sold price data in order to help with your property search.
The average Property Paid Price for specific property types in the last three years are:
| Property Type | Average Sold Price | Sold Properties |
|---|---|---|
| Semi Detached House | £264,737.00 | 40 Semi Detached Houses |
| Detached House | £359,683.00 | 30 Detached Houses |
| Terraced House | £218,214.00 | 14 Terraced Houses |
| Flat | £109,666.00 | 3 Flats |

