
Houses for sale & to rent in Wrentham, Wangford & Westleton, Saxmundham
House Prices in Wrentham, Wangford & Westleton
Properties in Wrentham, Wangford & Westleton have an average house price of £471k and had 7 Property Transactions within the last 3 years¹.
Wrentham, Wangford & Westleton is an area in Saxmundham, Suffolk with 56 households², where the most expensive property was sold for £650k.
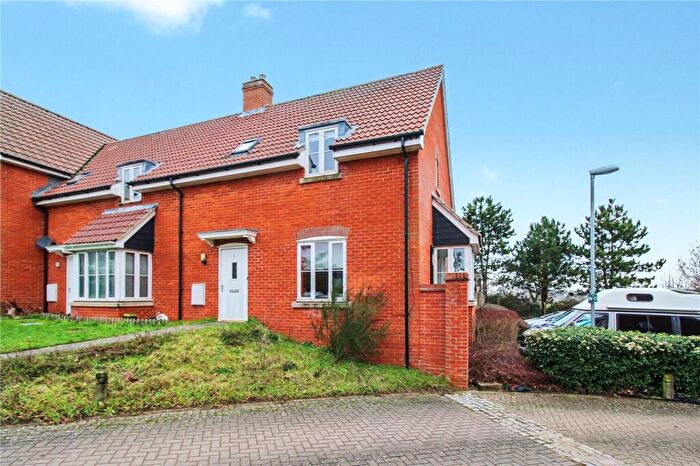
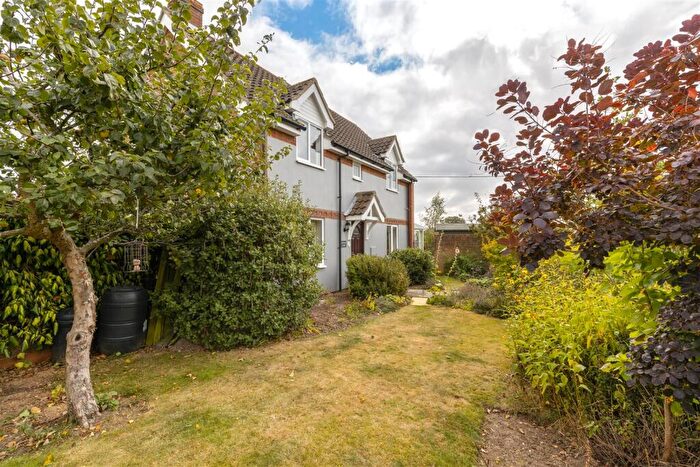
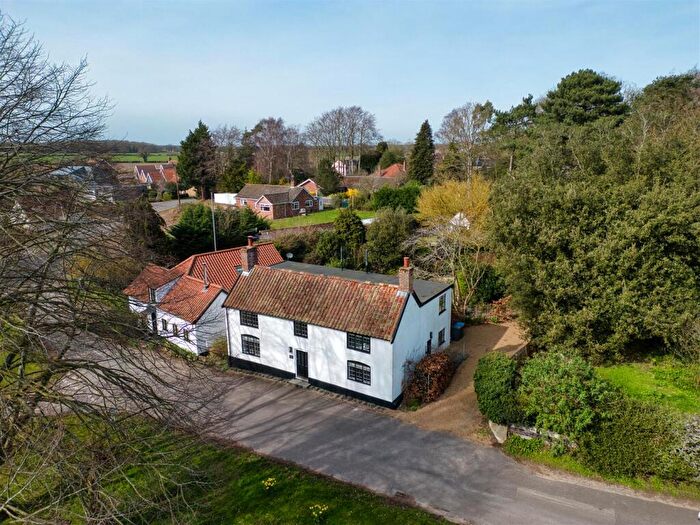
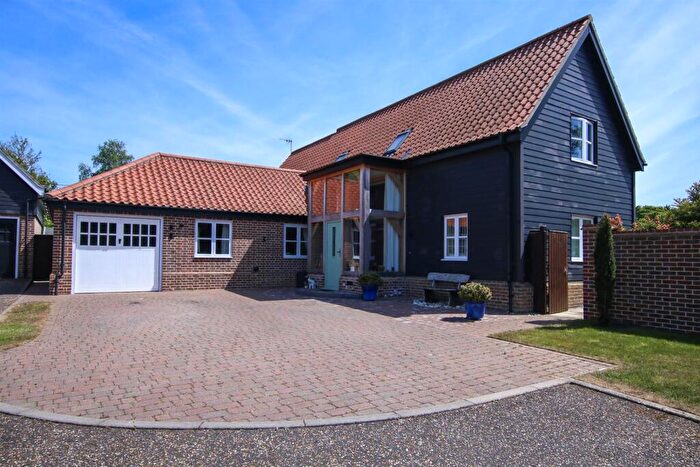
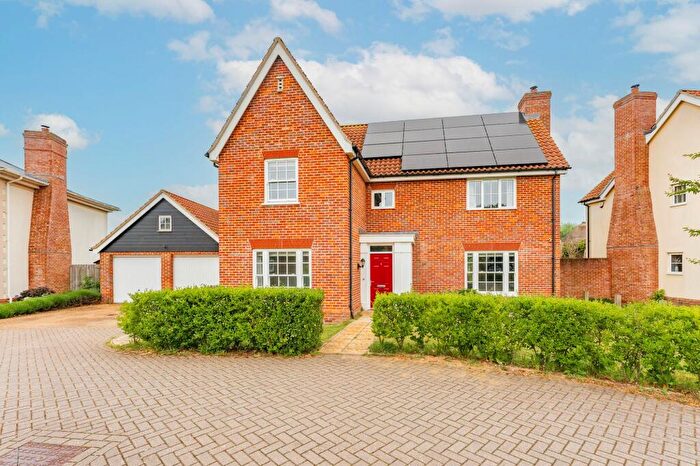
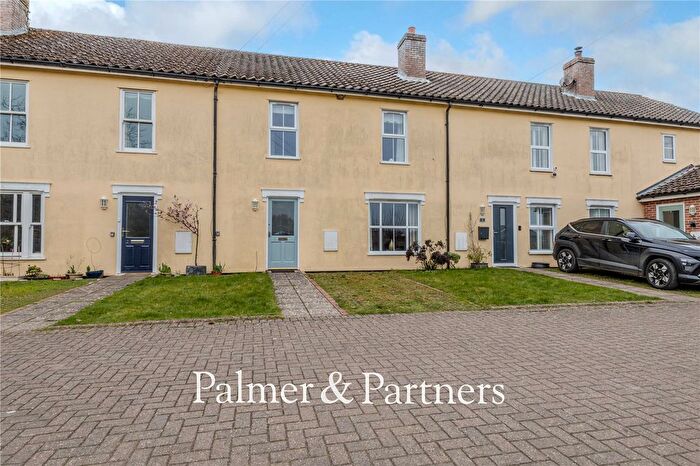
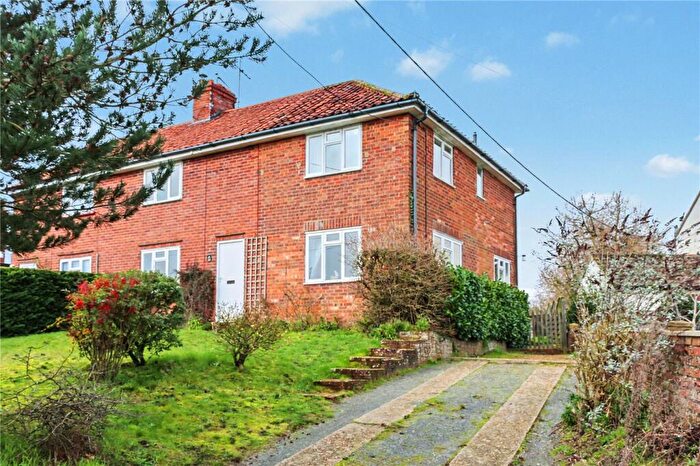
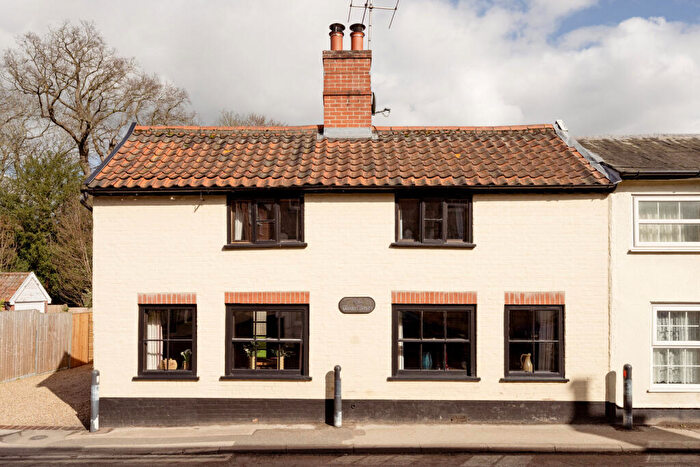
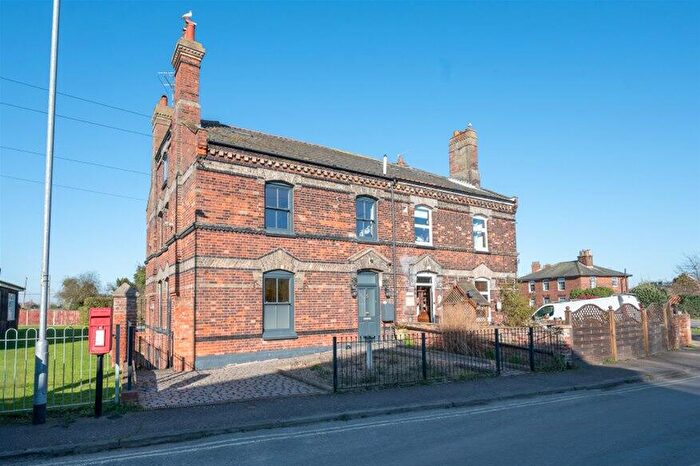
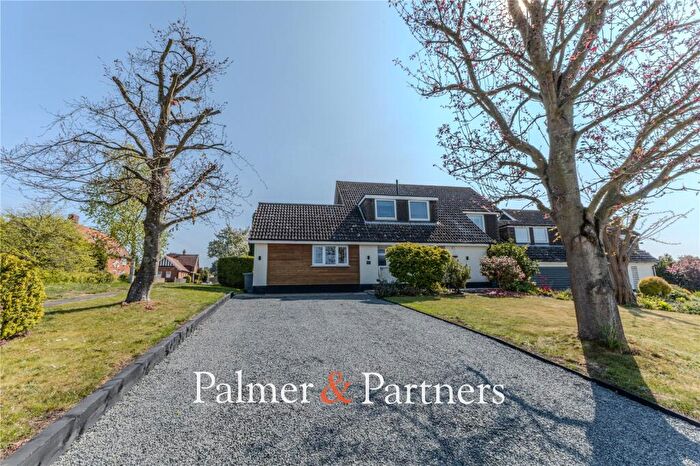
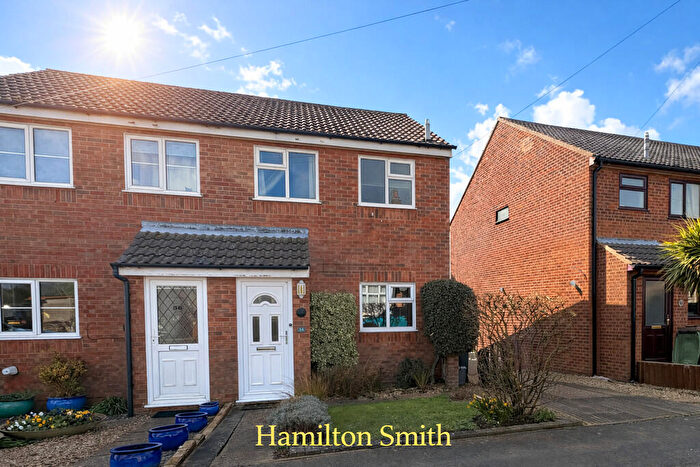
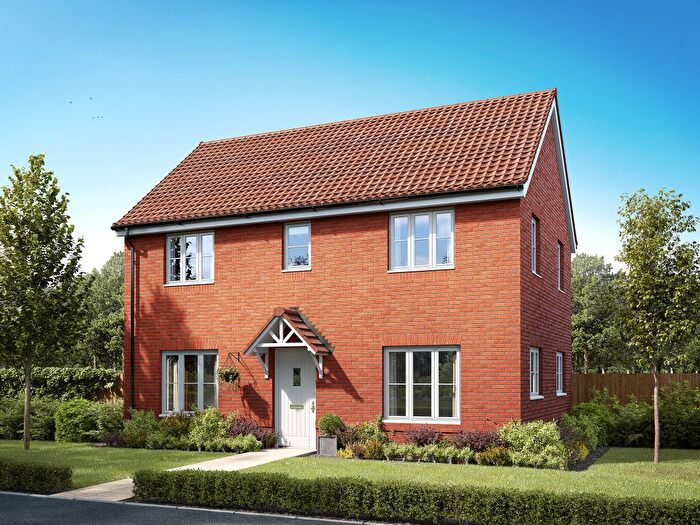
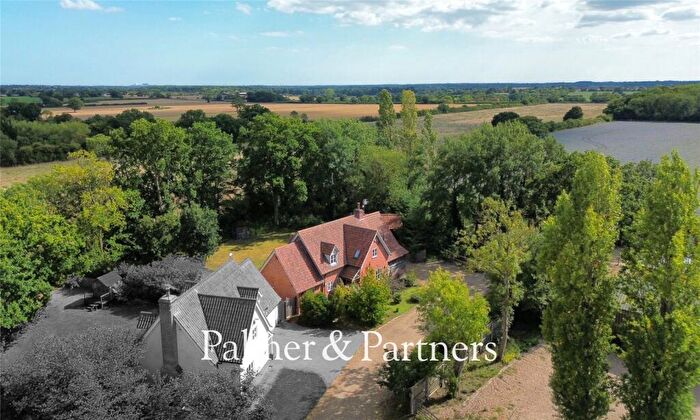
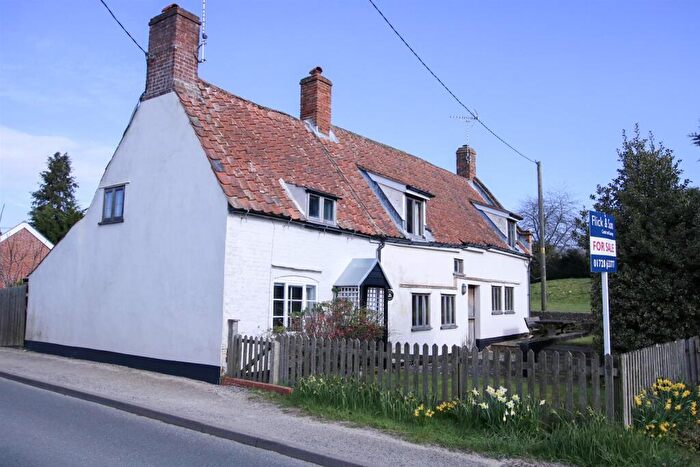
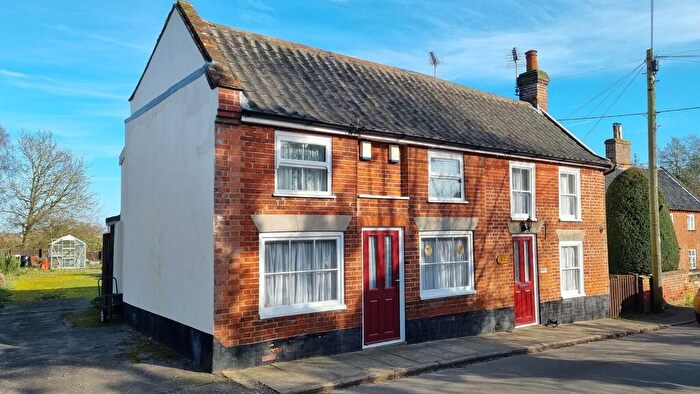
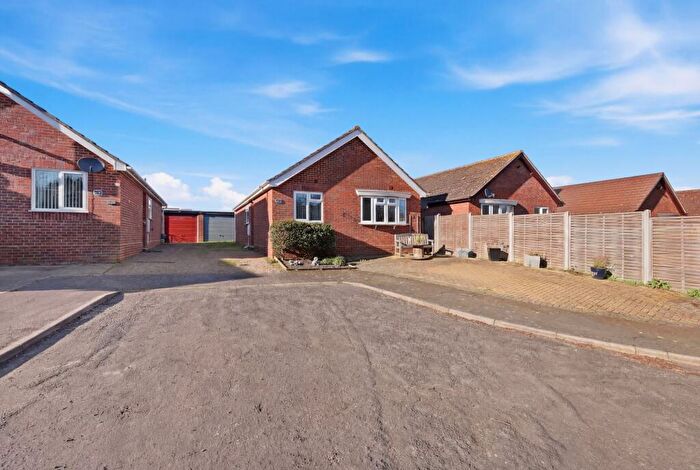
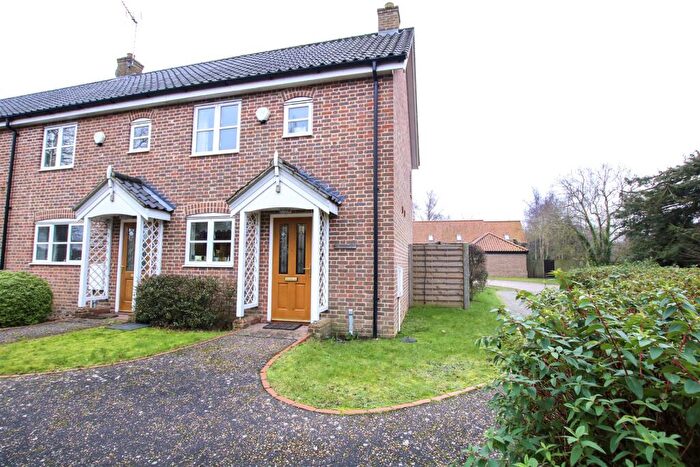
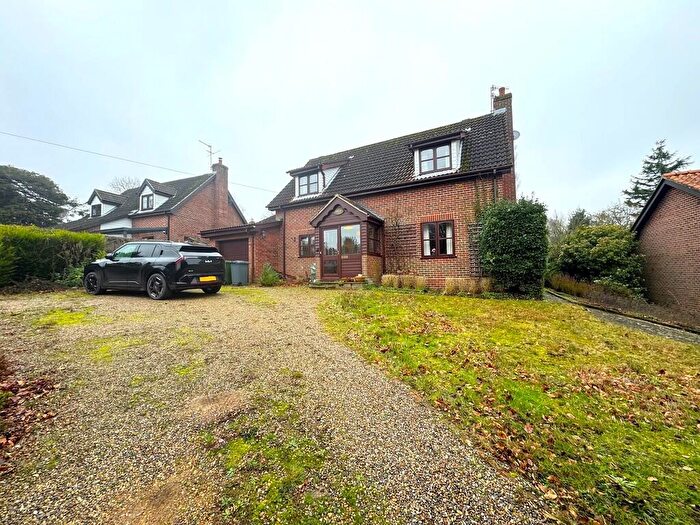
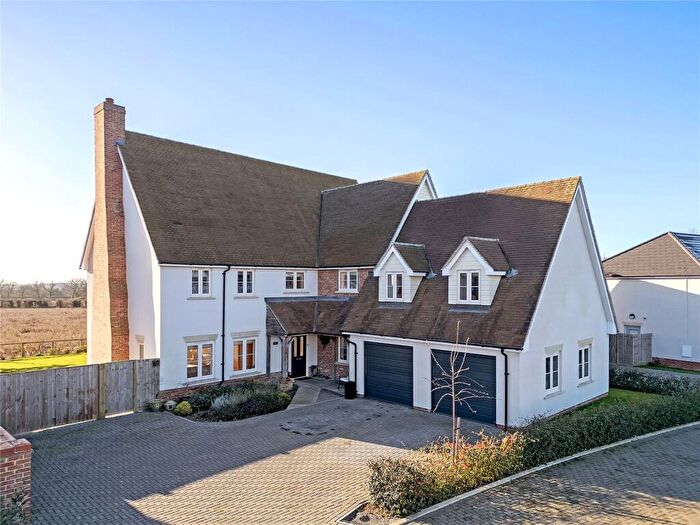
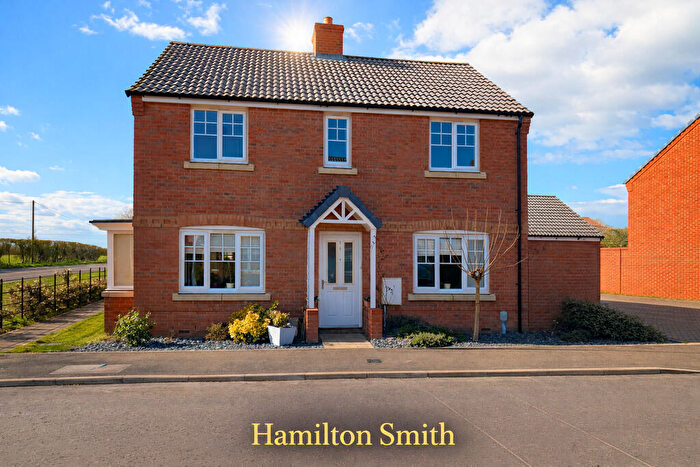
Properties for sale in Wrentham, Wangford & Westleton
![]()
If you are looking to sell your house, let it out, or receive a property valuation, an expert can help you.
Click the button below to get started.


Roads and Postcodes in Wrentham, Wangford & Westleton
Navigate through our locations to find the location of your next house in Wrentham, Wangford & Westleton, Saxmundham for sale or to rent.
| Streets | Postcodes |
|---|---|
| Minsmere Road | IP17 3DG IP17 3DJ |
| Bakers Lane | IP17 3DA |
| Beach Road | IP17 3EN |
| Blythburgh Road | IP17 3EE IP17 3EF |
| Cheyney Green | IP17 3FA |
| Darsham Road | IP17 3BF |
| Dunwich Road | IP17 3DB |
| Fenstreet | IP17 3EL |
| Gorse Cottages | IP17 3EB |
| High Street | IP17 3DL IP17 3QW |
| Hinton Corner | IP17 3RH |
| Leet Hill | IP17 3FF |
| London Road | IP17 3QR IP17 3QU |
| Main Road | IP17 3PL |
| Millfields | IP17 3QJ |
| Minsmere Nature Reserve | IP17 3BY |
| Monastery Hill | IP17 3BQ |
| Priory Meadows | IP17 3QY |
| Sandy Lane | IP17 3DY |
| The Common | IP17 3BB |
| Westleton Road | IP17 3NX |
| Yoxford Road | IP17 3AF IP17 3BT IP17 3BU |
| IP17 3DZ IP17 3QP IP17 3QT IP17 3RB IP17 3RD IP17 3RF IP17 3RG IP17 3RJ IP17 3RQ IP17 3FB |
Transport near Wrentham, Wangford & Westleton

- FAQ
- Price Paid By Year
- Property Type Price
Frequently asked questions about Wrentham, Wangford & Westleton
What is the average price for a property for sale in Wrentham, Wangford & Westleton?
The average price for a property for sale in Wrentham, Wangford & Westleton is £471,357. This amount is 22% higher than the average price in Saxmundham. There are 680 property listings for sale in Wrentham, Wangford & Westleton.
What streets have the most expensive properties for sale in Wrentham, Wangford & Westleton?
The streets with the most expensive properties for sale in Wrentham, Wangford & Westleton are Priory Meadows at an average of £650,000, Westleton Road at an average of £605,000 and High Street at an average of £595,000.
What streets have the most affordable properties for sale in Wrentham, Wangford & Westleton?
The streets with the most affordable properties for sale in Wrentham, Wangford & Westleton are Millfields at an average of £292,500 and Cheyney Green at an average of £387,500.
Which train stations are available in or near Wrentham, Wangford & Westleton?
Some of the train stations available in or near Wrentham, Wangford & Westleton are Darsham, Halesworth and Saxmundham.
Property Price Paid in Wrentham, Wangford & Westleton by Year
The average sold property price by year was:
| Year | Average Sold Price | Price Change |
Sold Properties
|
|---|---|---|---|
| 2025 | £462,500 | -31% |
5 Properties |
| 2024 | £605,000 | 37% |
1 Property |
| 2023 | £382,000 | -86% |
1 Property |
| 2022 | £710,000 | 25% |
1 Property |
| 2021 | £532,457 | 19% |
12 Properties |
| 2020 | £429,669 | 14% |
10 Properties |
| 2019 | £368,500 | -56% |
4 Properties |
| 2017 | £575,713 | 28% |
7 Properties |
| 2016 | £413,134 | 16% |
11 Properties |
| 2015 | £346,000 | -174% |
1 Property |
| 2014 | £947,500 | 85% |
2 Properties |
| 2007 | £145,000 | -68% |
1 Property |
| 1999 | £243,000 | - |
1 Property |
Property Price per Property Type in Wrentham, Wangford & Westleton
Here you can find historic sold price data in order to help with your property search.
The average Property Paid Price for specific property types in the last three years are:
| Property Type | Average Sold Price | Sold Properties |
|---|---|---|
| Semi Detached House | £337,250.00 | 2 Semi Detached Houses |
| Detached House | £581,250.00 | 4 Detached Houses |
| Terraced House | £300,000.00 | 1 Terraced House |