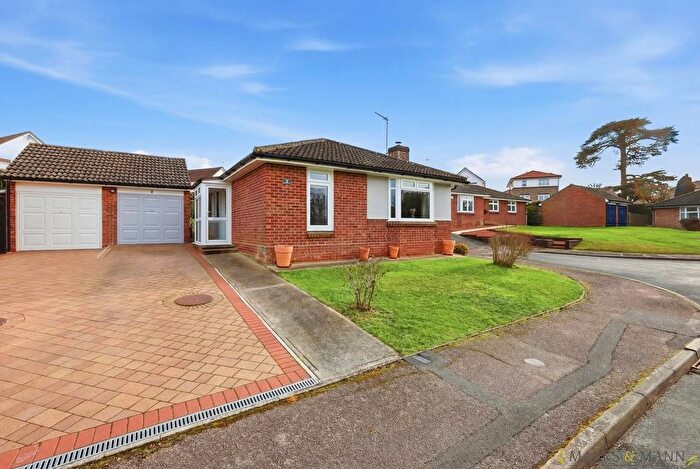
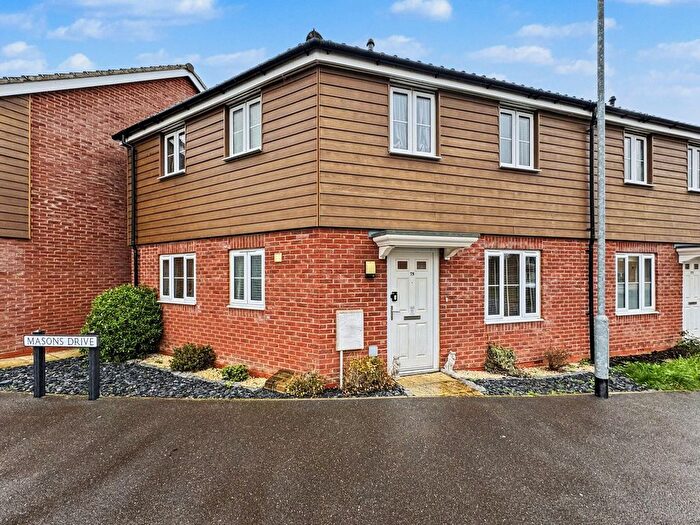
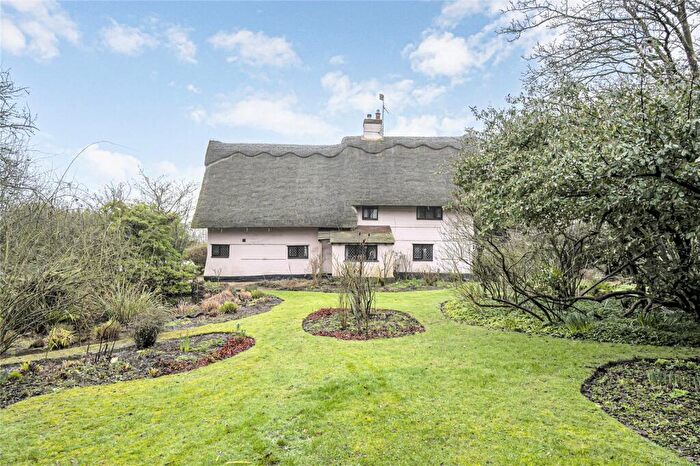
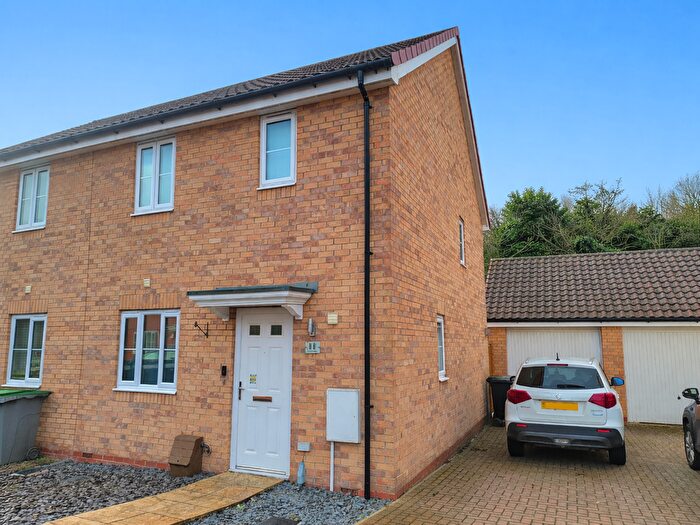
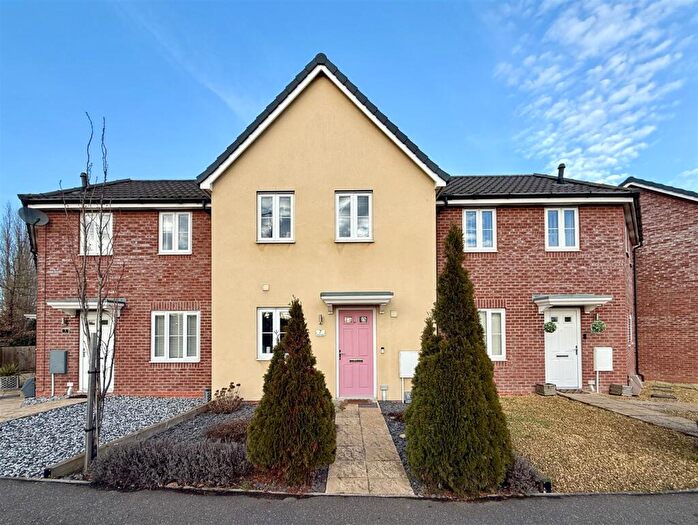
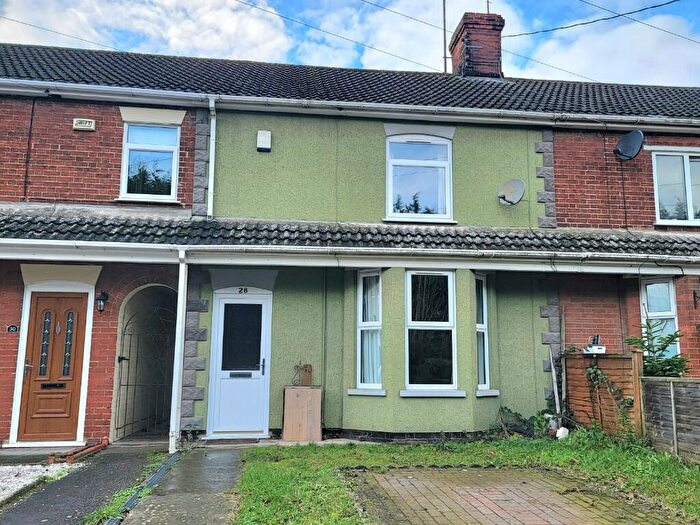
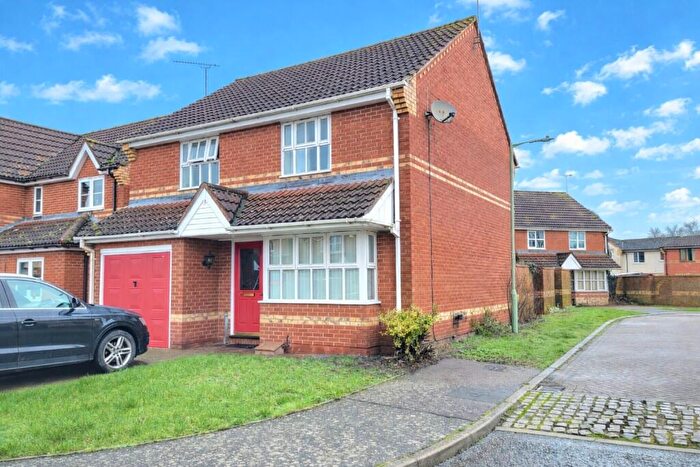
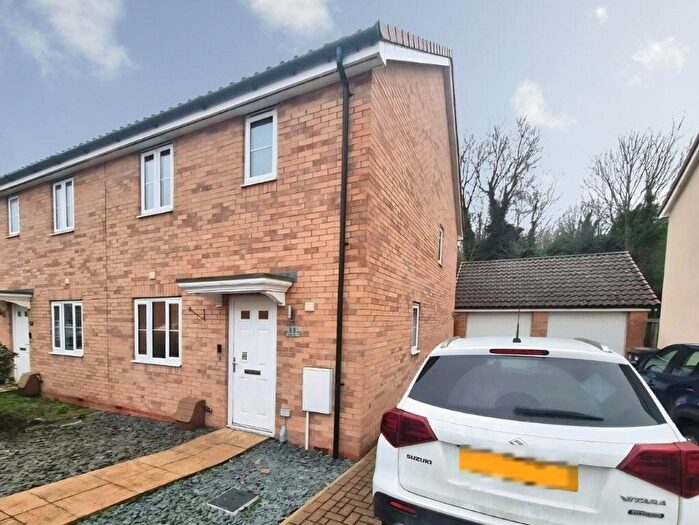
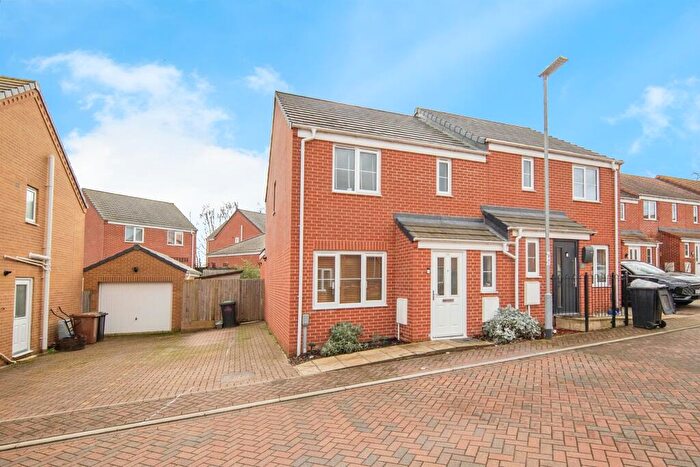
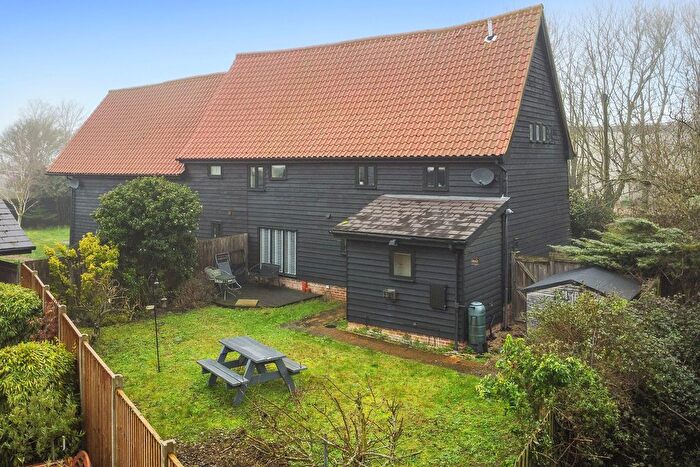
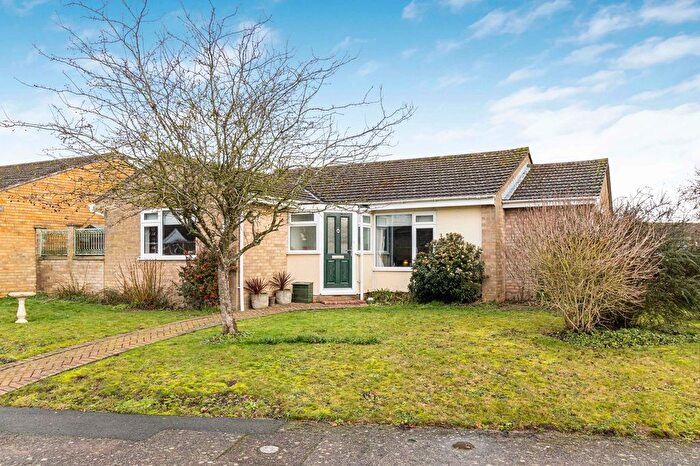
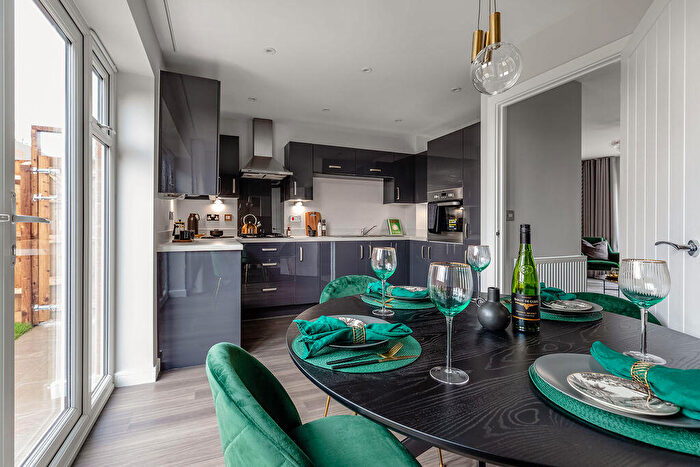
Houses for sale & to rent in Barking And Somersham, Ipswich
House Prices in Barking And Somersham
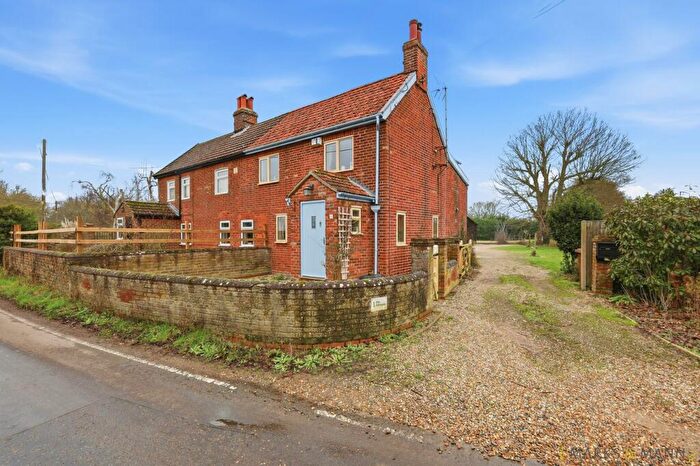
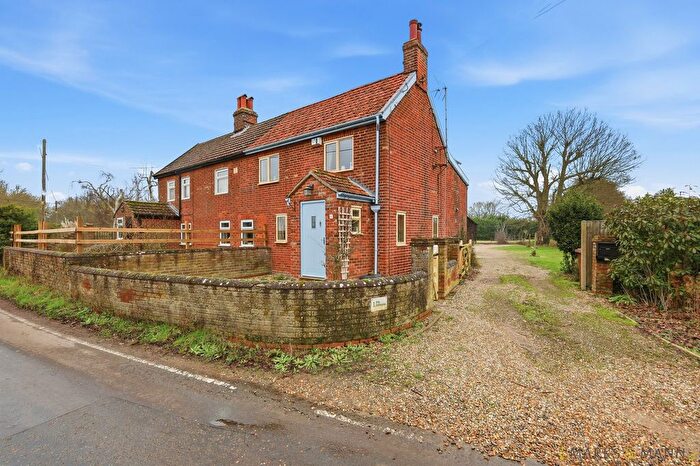
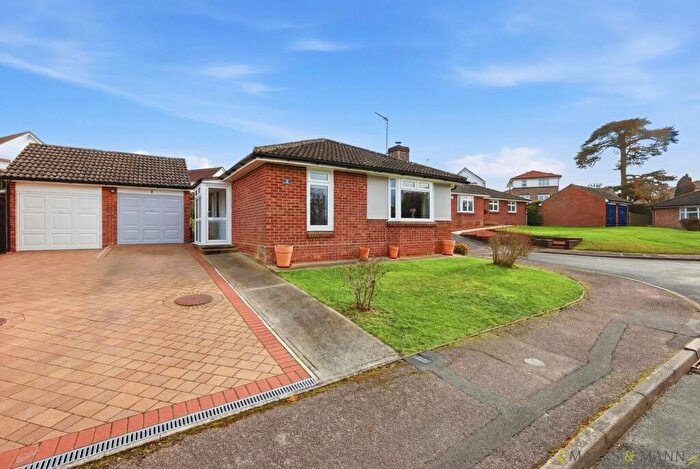
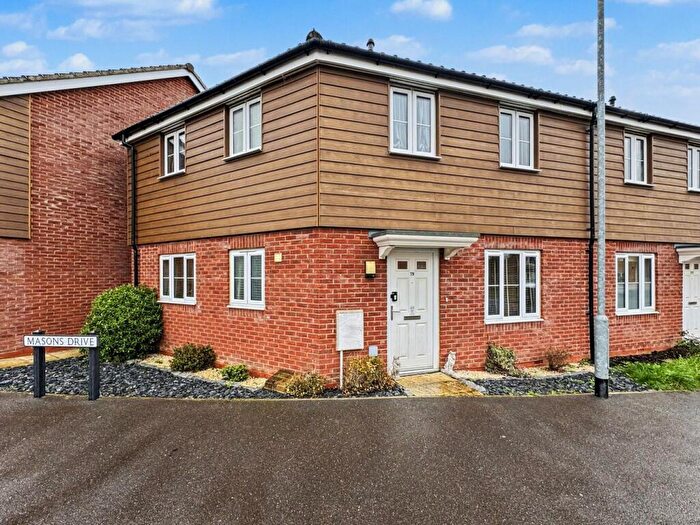
Properties in Barking And Somersham have an average house price of £412,650.00 and had 65 Property Transactions within the last 3 years¹.
Barking And Somersham is an area in Ipswich, Suffolk with 835 households², where the most expensive property was sold for £985,000.00.
Properties for sale in Barking And Somersham
Roads and Postcodes in Barking And Somersham
Navigate through our locations to find the location of your next house in Barking And Somersham, Ipswich for sale or to rent.
| Streets | Postcodes |
|---|---|
| Barking Road | IP6 8HG |
| Barretts Lane | IP6 8SB |
| Battisford Road | IP6 8HL |
| Bildeston Road | IP8 4RS IP8 4SE |
| Black Barn Close | IP8 4PX |
| Brook Way | IP8 4PE |
| Castle Lane | IP8 4RH |
| Castle Meadow | IP8 4RQ |
| Castle Road | IP8 4RG IP8 4RN |
| Cats Hill | IP6 8LQ |
| Chalk Pit Cottages | IP8 4SF |
| Chapel Lane | IP8 4QE |
| Church Close | IP8 4PW |
| Church Lane | IP8 4PL |
| Fiske Pightle | IP8 4SN |
| Fox Meadow | IP6 8HS |
| Glebe Close | IP6 8JT |
| Hall Cottages | IP8 4SL |
| Hall Lane | IP8 4QN |
| High View | IP8 4SG |
| Homechurch | IP6 8RF |
| Ipswich Road | IP7 7AR |
| Lady Field | IP6 8HR |
| Lower Coney Grove | IP8 4RA |
| Lower Street | IP6 8JP |
| Main Road | IP8 4PB IP8 4PD IP8 4QA IP8 4QF |
| Middlewood Cottages | IP8 4RR |
| Mill Lane | IP8 4PA |
| Needham Road | IP6 8HJ |
| Nettlestead Road | IP8 4LP |
| North Acres | IP8 4SS |
| Princes Gardens | IP8 4PF |
| Springfield Road | IP8 4PG IP8 4PQ |
| St Marys Close | IP8 4RZ |
| Stocks Hill | IP8 4QB |
| The Cedars | IP8 4RB |
| The Stone | IP6 8LA IP6 8LB |
| The Tye | IP6 8HU IP6 8HZ IP6 8JA IP6 8JB IP6 8JD IP6 8JE |
| Tye Green | IP6 8HT |
| Tye Lane | IP8 4SR |
| Upper Street | IP6 8JR |
| Wallow Lane | IP7 7BZ |
| Watering Close | IP8 4QG |
| Wentworth Close | IP8 4QR |
| Willisham Road | IP6 8HY |
| IP6 8HP IP6 8HW IP6 8JS IP6 8JU IP6 8JW IP6 8LD IP6 8LE IP6 8RA IP6 8RE IP8 4LN IP8 4PH IP8 4PJ IP8 4PP IP8 4PS IP8 4PT IP8 4QL IP8 4QS IP8 4RP IP8 4SP |
Transport near Barking And Somersham
- FAQ
- Price Paid By Year
- Property Type Price
Frequently asked questions about Barking And Somersham
What is the average price for a property for sale in Barking And Somersham?
The average price for a property for sale in Barking And Somersham is £412,650. This amount is 43% higher than the average price in Ipswich. There are 2,366 property listings for sale in Barking And Somersham.
What streets have the most expensive properties for sale in Barking And Somersham?
The streets with the most expensive properties for sale in Barking And Somersham are Battisford Road at an average of £857,500, Chalk Pit Cottages at an average of £855,000 and Bildeston Road at an average of £802,500.
What streets have the most affordable properties for sale in Barking And Somersham?
The streets with the most affordable properties for sale in Barking And Somersham are Brook Way at an average of £248,500, Springfield Road at an average of £261,000 and Black Barn Close at an average of £271,000.
Which train stations are available in or near Barking And Somersham?
Some of the train stations available in or near Barking And Somersham are Needham Market, Stowmarket and Westerfield.
Property Price Paid in Barking And Somersham by Year
The average sold property price by year was:
| Year | Average Sold Price | Price Change |
Sold Properties
|
|---|---|---|---|
| 2025 | £435,735 | 7% |
17 Properties |
| 2024 | £403,194 | -1% |
27 Properties |
| 2023 | £406,119 | -23% |
21 Properties |
| 2022 | £501,194 | 18% |
29 Properties |
| 2021 | £412,266 | -12% |
30 Properties |
| 2020 | £461,795 | 36% |
22 Properties |
| 2019 | £295,981 | -36% |
30 Properties |
| 2018 | £402,428 | - |
28 Properties |
| 2017 | £402,544 | 24% |
27 Properties |
| 2016 | £306,890 | 1% |
27 Properties |
| 2015 | £302,333 | 7% |
24 Properties |
| 2014 | £282,133 | -1% |
41 Properties |
| 2013 | £283,950 | 23% |
25 Properties |
| 2012 | £218,250 | -26% |
22 Properties |
| 2011 | £276,045 | 10% |
22 Properties |
| 2010 | £248,956 | -17% |
29 Properties |
| 2009 | £291,944 | 5% |
18 Properties |
| 2008 | £276,624 | 2% |
8 Properties |
| 2007 | £271,400 | 2% |
25 Properties |
| 2006 | £265,577 | -3% |
46 Properties |
| 2005 | £274,299 | 16% |
35 Properties |
| 2004 | £229,515 | 25% |
32 Properties |
| 2003 | £172,375 | -11% |
32 Properties |
| 2002 | £191,700 | 37% |
27 Properties |
| 2001 | £120,127 | -33% |
37 Properties |
| 2000 | £160,107 | 21% |
39 Properties |
| 1999 | £126,757 | 32% |
47 Properties |
| 1998 | £86,786 | 13% |
19 Properties |
| 1997 | £75,349 | 10% |
35 Properties |
| 1996 | £67,638 | -17% |
32 Properties |
| 1995 | £78,880 | - |
26 Properties |
Property Price per Property Type in Barking And Somersham
Here you can find historic sold price data in order to help with your property search.
The average Property Paid Price for specific property types in the last three years are:
| Property Type | Average Sold Price | Sold Properties |
|---|---|---|
| Semi Detached House | £286,736.00 | 19 Semi Detached Houses |
| Detached House | £489,908.00 | 41 Detached Houses |
| Terraced House | £257,600.00 | 5 Terraced Houses |

