
Houses for sale in Ipswich, Suffolk
House Prices in Ipswich
Properties in Ipswich have an average house price of £289k and had 8,875 Property Transactions within the last 3 years.¹
Ipswich is an area in Suffolk with 97,762 households², where the most expensive property was sold for £2.15M.
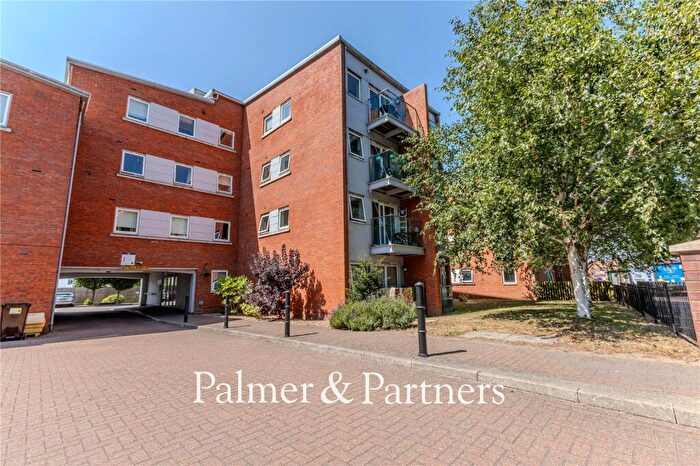
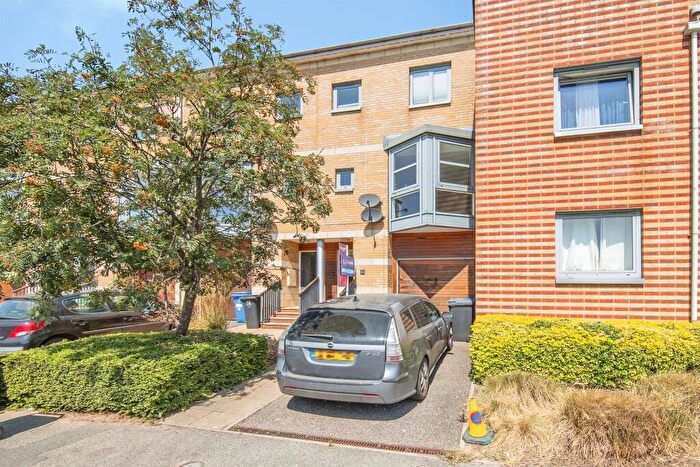
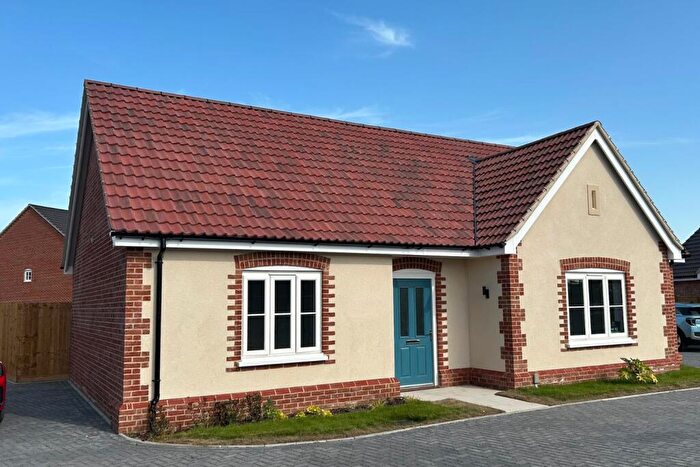
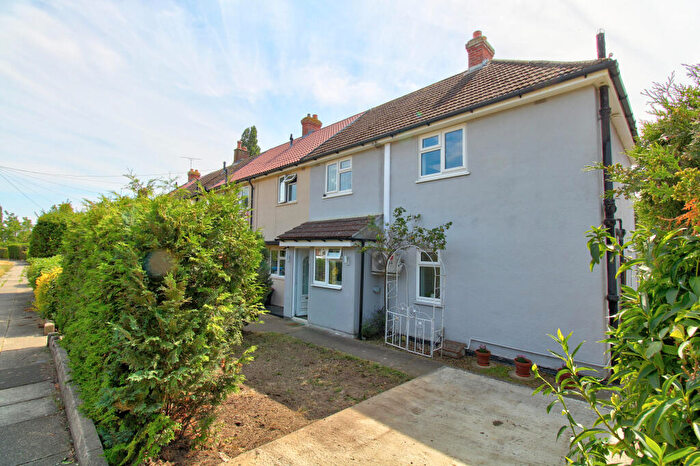
Properties for sale in Ipswich
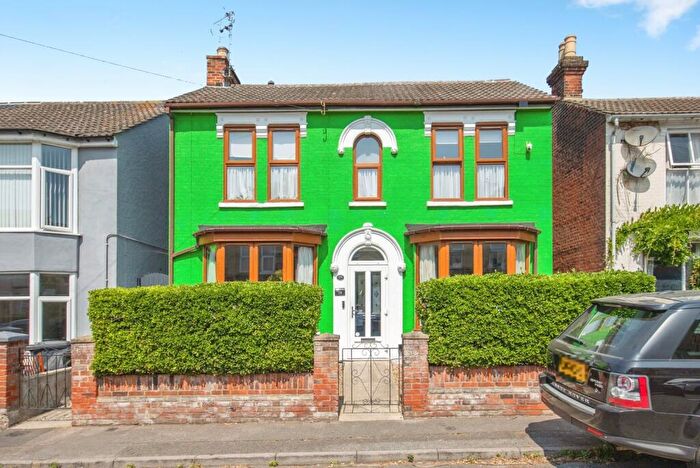
![]()
If you are looking to sell your house, let it out, or receive a property valuation, an expert can help you.
Click the button below to get started.
Neighbourhoods in Ipswich
Navigate through our locations to find the location of your next house in Ipswich, Suffolk for sale or to rent.
- Alexandra
- Alton
- Barking And Somersham
- Berners
- Bixley
- Boxford
- Bramford And Blakenham
- Brett Vale
- Bridge
- Brook
- Castle Hill
- Claydon And Barham
- Dodnash
- Gainsborough
- Gipping
- Grundisburgh
- Hadleigh North
- Hadleigh South
- Helmingham And Coddenham
- Holbrook
- Holywells
- Kesgrave East
- Kesgrave West
- Lower Brett
- Martlesham
- Mid Samford
- Nacton
- Needham Market
- North Cosford
- Otley
- Pinewood
- Priory Heath
- Ringshall
- Rushmere
- Rushmere St Andrew
- South Cosford
- Sprites
- St Johns
- St Margarets
- Stoke Park
- Stowupland
- The Stonhams
- Trimleys With Kirton
- Westgate
- Whitehouse
- Whitton
- Witnesham
- Sproughton & Pinewood
- Martlesham & Purdis Farm
- Kesgrave
- Orwell & Villages
- Orwell
- Carlford & Fynn Valley
- Claydon & Barham
- Blakenham
- Battisford & Ringshall
- Stonham
- South East Cosford
- Box Vale
- North West Cosford
- Copdock & Washbrook
- Bramford
- Ganges
- Capel St Mary
- Stour
Property price trends in Ipswich
According to the latest Land Registry data, the average home in Ipswich sold for £266,595 in 2026. That figure comes from a substantial record of 121,407 sales logged over the past 31 years.
Prices have fallen back over the last three years. Compared with 2023, when the typical sale came in around £294,938, that's a fall of roughly 9.6%.
Looking back five years, average prices are down about 6.4% since 2021, a drop of around £18,230 in cash terms.
Zoom out to the past decade for the fuller picture. Back in 2016, homes here averaged £224,124, so the typical sold price has climbed about 18.9% since then, roughly 1.8% a year. Stretch the view to fifteen years and that annual pace edges up closer to 2.7%.
Frequently asked questions about Ipswich
What is the average price for a property for sale in Ipswich?
The average price for a property for sale in Ipswich is £288,975. This amount is 9% lower than the average price in Suffolk. There are more than 10,000 property listings for sale in Ipswich.
What locations have the most expensive properties for sale in Ipswich?
The locations with the most expensive properties for sale in Ipswich are Copdock & Washbrook at an average of £830,000, Orwell at an average of £655,000 and North Cosford at an average of £593,944.
What locations have the most affordable properties for sale in Ipswich?
The locations with the most affordable properties for sale in Ipswich are Gipping at an average of £194,015, Westgate at an average of £195,854 and Bridge at an average of £197,541.
Which train stations are available in or near Ipswich?
Some of the train stations available in or near Ipswich are Ipswich, Westerfield and Derby Road.
Property Price Paid in Ipswich by Year
The average sold property price by year was:
| Year | Average Sold Price | Price Change |
Sold Properties
|
|---|---|---|---|
| 2026 | £266,595 | -10% |
248 Properties |
| 2025 | £293,656 | 4% |
2,743 Properties |
| 2024 | £281,035 | -5% |
3,048 Properties |
| 2023 | £294,938 | -1% |
2,836 Properties |
| 2022 | £297,296 | 4% |
3,497 Properties |
| 2021 | £284,825 | 7% |
4,490 Properties |
| 2020 | £265,266 | 3% |
3,222 Properties |
| 2019 | £257,394 | 4% |
3,611 Properties |
| 2018 | £246,039 | 1% |
3,652 Properties |
| 2017 | £242,548 | 8% |
3,871 Properties |
Property Price per Property Type in Ipswich
Here you can find historic sold price data in order to help with your property search.
The average Property Paid Price for specific property types in the last three years are:
| Property Type | Average Sold Price | Sold Properties |
|---|---|---|
| Semi Detached House | £275,127.00 | 3,074 Semi Detached Houses |
| Terraced House | £223,537.00 | 2,442 Terraced Houses |
| Detached House | £453,729.00 | 2,233 Detached Houses |
| Flat | £141,970.00 | 1,126 Flats |
Transport in Ipswich
Please see below transportation links in this area:
