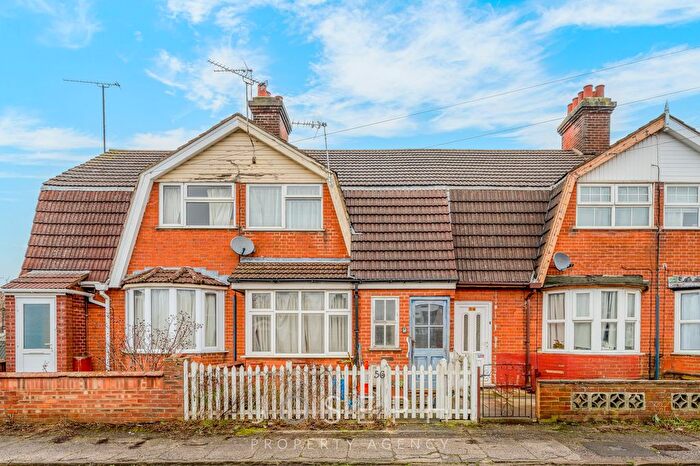
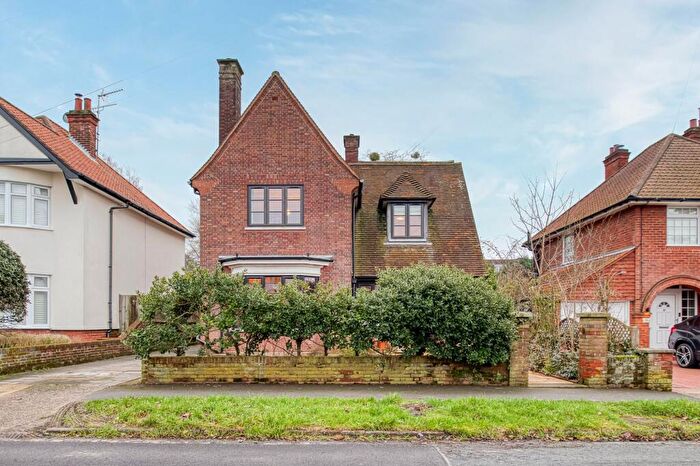
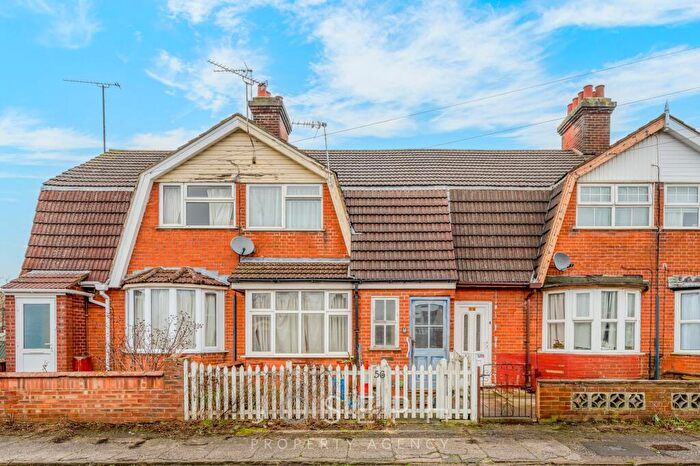
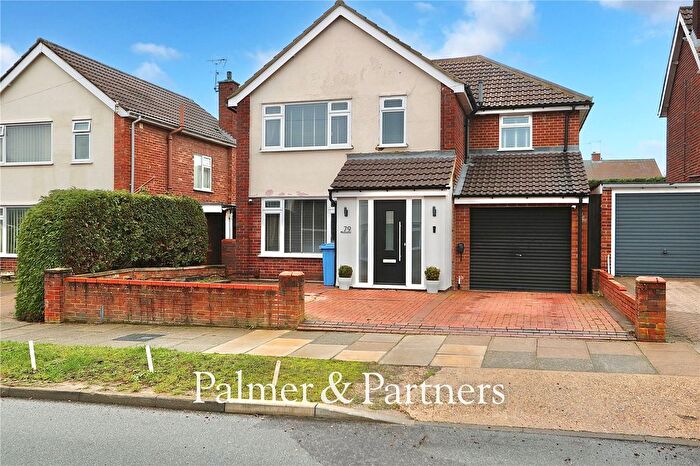
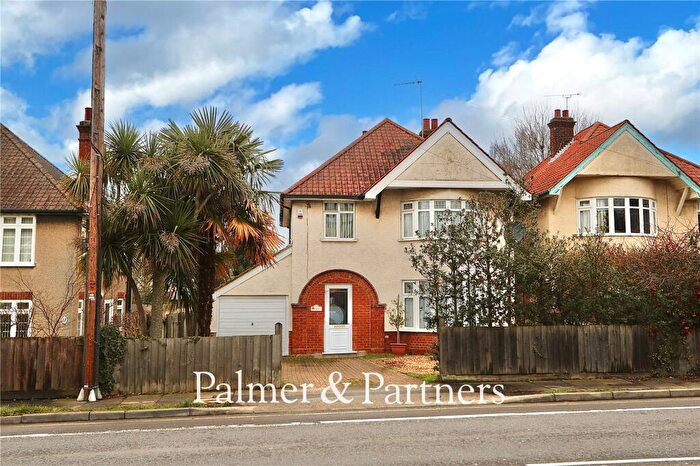
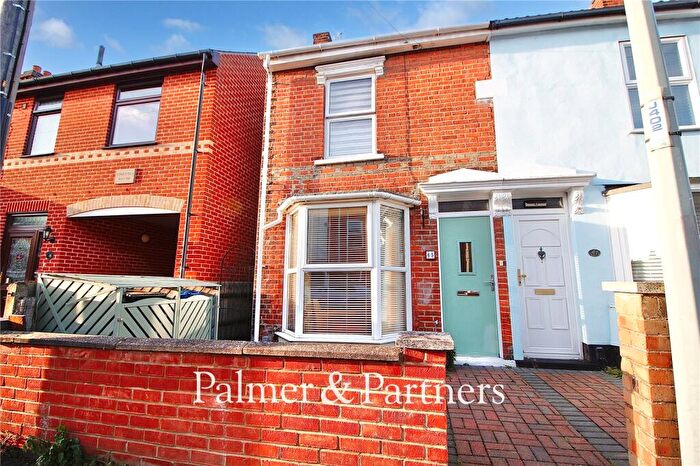
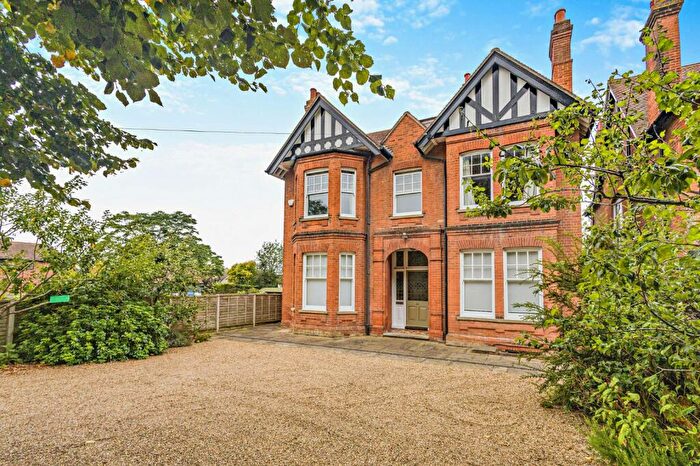
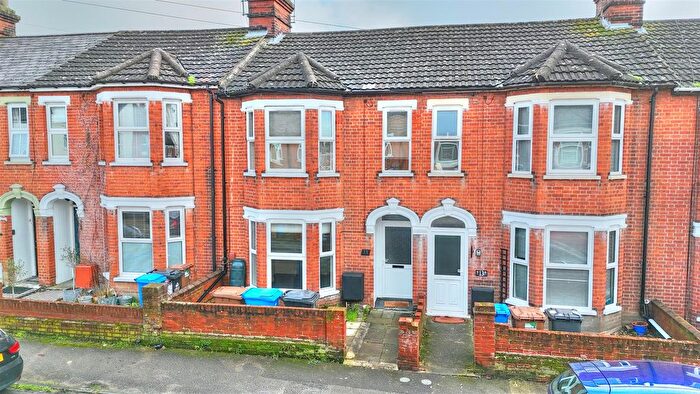
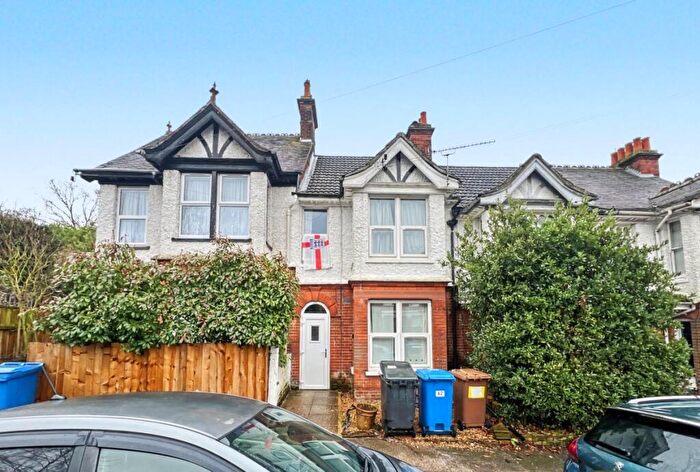
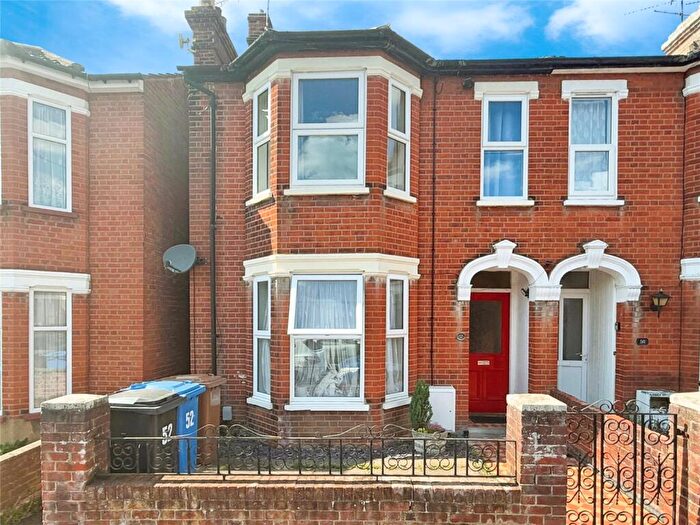
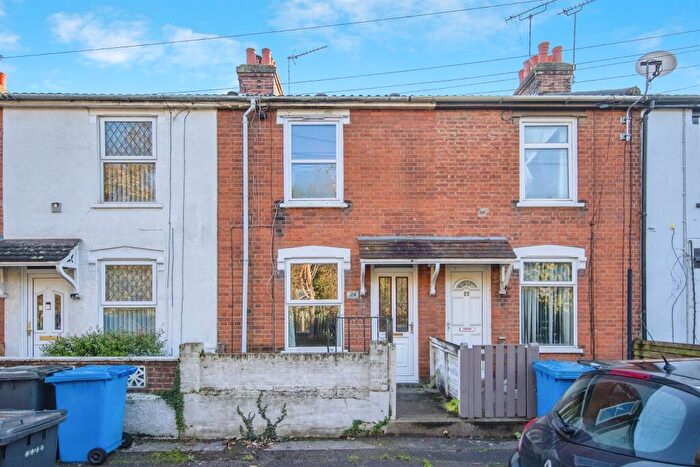
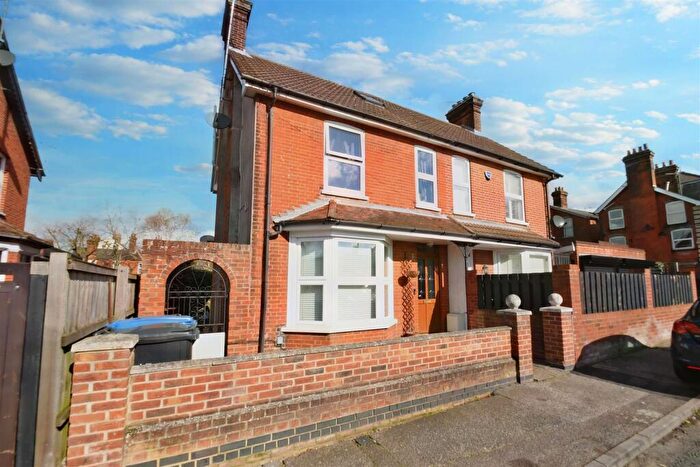
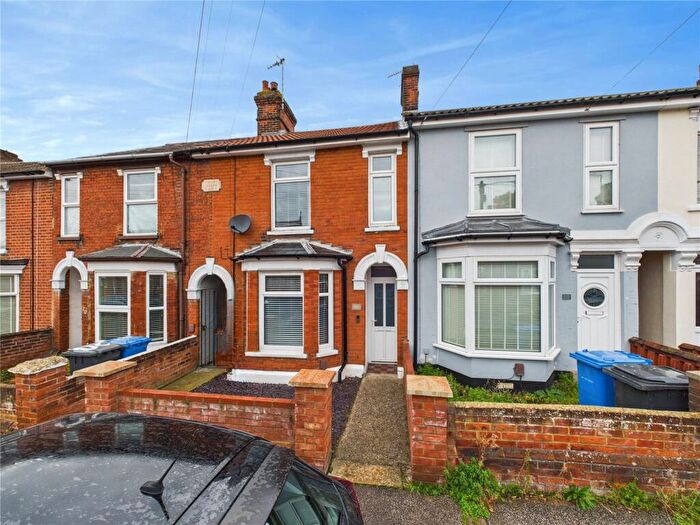
Houses for sale & to rent in Castle Hill, Ipswich
House Prices in Castle Hill
Properties in Castle Hill have an average house price of £302,666.00 and had 279 Property Transactions within the last 3 years¹.
Castle Hill is an area in Ipswich, Suffolk with 3,004 households², where the most expensive property was sold for £800,000.00.
Properties for sale in Castle Hill
Roads and Postcodes in Castle Hill
Navigate through our locations to find the location of your next house in Castle Hill, Ipswich for sale or to rent.
| Streets | Postcodes |
|---|---|
| Ashcroft Lane | IP1 6AT |
| Ashcroft Road | IP1 6AA IP1 6AB IP1 6AD IP1 6AE IP1 6AF |
| Baronsdale Close | IP1 4JX |
| Beechcroft Road | IP1 6BA IP1 6BB IP1 6BD IP1 6BE |
| Broadway Lane | IP1 5EZ |
| Castle Road | IP1 5DY IP1 5DZ |
| Cedarcroft Road | IP1 6BG IP1 6BJ IP1 6BL IP1 6BP IP1 6BQ |
| Charlton Avenue | IP1 6BH |
| Chelsea Close | IP1 6DE |
| Cheltenham Avenue | IP1 4LN |
| Chesterfield Drive | IP1 6DL IP1 6DN IP1 6DP IP1 6DW |
| Clive Avenue | IP1 4LU |
| Congreve Road | IP1 6AL |
| Cotswold Avenue | IP1 4LJ IP1 4LL |
| Dale Hall Lane | IP1 4LH IP1 4LS IP1 4LW IP1 4LX IP1 4LY |
| Dales Road | IP1 4JD IP1 4JE IP1 4JR IP1 4JY IP1 4LR |
| Dales View Road | IP1 4HJ IP1 4HL |
| Elmcroft Road | IP1 6NA IP1 6NB IP1 6ND |
| Everton Crescent | IP1 6DB |
| Garrick Way | IP1 6NF IP1 6NX |
| Hazelcroft Road | IP1 6AW |
| Henley Road | IP1 4NG IP1 4NJ IP1 4NL IP1 4NN IP1 4NQ IP1 4NS IP1 4NT IP1 4NU IP1 4NX IP1 6AU |
| Highfield Approach | IP1 6DF |
| Highfield Road | IP1 6DA IP1 6DD IP1 6DG IP1 6DH IP1 6DJ |
| June Avenue | IP1 4LT |
| Karen Close | IP1 4LP |
| Kensington Road | IP1 4LB IP1 4LD |
| Knightsdale Road | IP1 4JQ IP1 4HE IP1 4JJ IP1 4LE |
| Larchcroft Road | IP1 6AN IP1 6AR |
| Lower Dales View Road | IP1 4HG |
| Mansfield Avenue | IP1 6DQ |
| Meredith Road | IP1 6EB |
| Mornington Avenue | IP1 4LA |
| Norwich Road | IP1 4EJ IP1 4HD IP1 5DT IP1 5DU IP1 5DX IP1 6JR IP1 6JS IP1 6JT IP1 6JU |
| One House Lane | IP1 4NH |
| Park View Road | IP1 4HN IP1 4HP IP1 4HY |
| Pine Avenue | IP1 4HW |
| Pine View Road | IP1 4HR IP1 4HS |
| Pinecroft Road | IP1 6BN IP1 6BW |
| Preston Drive | IP1 6DR IP1 6DS |
| Princedale Close | IP1 4JG |
| Queensdale Close | IP1 4JZ |
| Ravensfield Road | IP1 5ED |
| Rosecroft Road | IP1 6AP |
| Shakespeare Road | IP1 6HD |
| Sherrington Road | IP1 4HT IP1 4HU IP1 4HX |
| Shrubland Avenue | IP1 5EA IP1 5EB |
| Silverdale Close | IP1 4JF |
| The Grove | IP1 4NP IP1 4NR IP1 4NW |
| Tranmere Grove | IP1 6DT IP1 6DU |
| Vere Gardens | IP1 4NZ |
| Westholme Road | IP1 4HH IP1 4HQ |
| Wharfedale Road | IP1 4JP |
| Willowcroft Road | IP1 6BS IP1 6BT |
Transport near Castle Hill
- FAQ
- Price Paid By Year
- Property Type Price
Frequently asked questions about Castle Hill
What is the average price for a property for sale in Castle Hill?
The average price for a property for sale in Castle Hill is £302,666. This amount is 5% higher than the average price in Ipswich. There are 2,095 property listings for sale in Castle Hill.
What streets have the most expensive properties for sale in Castle Hill?
The streets with the most expensive properties for sale in Castle Hill are Vere Gardens at an average of £547,500, Henley Road at an average of £546,000 and Cheltenham Avenue at an average of £446,875.
What streets have the most affordable properties for sale in Castle Hill?
The streets with the most affordable properties for sale in Castle Hill are Wharfedale Road at an average of £195,000, Ashcroft Lane at an average of £198,000 and Baronsdale Close at an average of £222,500.
Which train stations are available in or near Castle Hill?
Some of the train stations available in or near Castle Hill are Westerfield, Ipswich and Derby Road.
Property Price Paid in Castle Hill by Year
The average sold property price by year was:
| Year | Average Sold Price | Price Change |
Sold Properties
|
|---|---|---|---|
| 2025 | £299,438 | 0,3% |
81 Properties |
| 2024 | £298,439 | -4% |
108 Properties |
| 2023 | £310,644 | -3% |
90 Properties |
| 2022 | £319,728 | 12% |
115 Properties |
| 2021 | £280,944 | 6% |
151 Properties |
| 2020 | £262,921 | -5% |
128 Properties |
| 2019 | £274,884 | 12% |
105 Properties |
| 2018 | £242,370 | -2% |
128 Properties |
| 2017 | £246,419 | 1% |
119 Properties |
| 2016 | £244,592 | 14% |
119 Properties |
| 2015 | £209,364 | 6% |
115 Properties |
| 2014 | £197,217 | 12% |
121 Properties |
| 2013 | £173,688 | 2% |
139 Properties |
| 2012 | £170,390 | 1% |
105 Properties |
| 2011 | £168,668 | 7% |
93 Properties |
| 2010 | £156,611 | -0,1% |
89 Properties |
| 2009 | £156,752 | -7% |
83 Properties |
| 2008 | £167,671 | -10% |
72 Properties |
| 2007 | £184,778 | 9% |
135 Properties |
| 2006 | £167,956 | 5% |
137 Properties |
| 2005 | £159,249 | 7% |
120 Properties |
| 2004 | £148,446 | 13% |
128 Properties |
| 2003 | £128,408 | 8% |
127 Properties |
| 2002 | £118,285 | 19% |
133 Properties |
| 2001 | £95,463 | 14% |
151 Properties |
| 2000 | £82,451 | 13% |
132 Properties |
| 1999 | £71,582 | 8% |
161 Properties |
| 1998 | £66,174 | 14% |
136 Properties |
| 1997 | £56,974 | 5% |
125 Properties |
| 1996 | £54,162 | -4% |
135 Properties |
| 1995 | £56,171 | - |
98 Properties |
Property Price per Property Type in Castle Hill
Here you can find historic sold price data in order to help with your property search.
The average Property Paid Price for specific property types in the last three years are:
| Property Type | Average Sold Price | Sold Properties |
|---|---|---|
| Semi Detached House | £283,126.00 | 201 Semi Detached Houses |
| Detached House | £406,345.00 | 55 Detached Houses |
| Terraced House | £235,785.00 | 21 Terraced Houses |
| Flat | £117,500.00 | 2 Flats |

