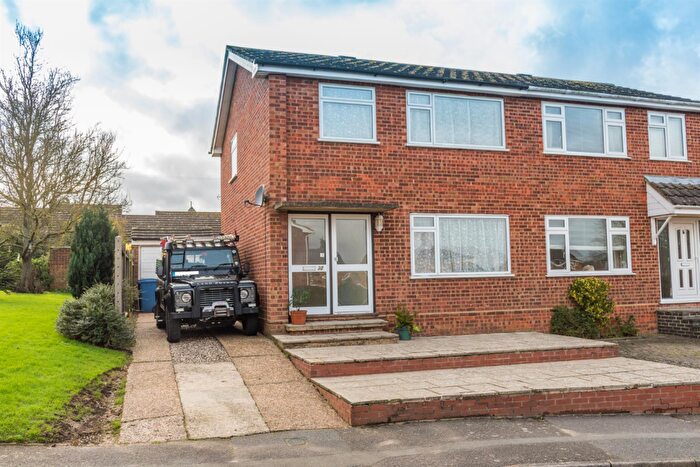
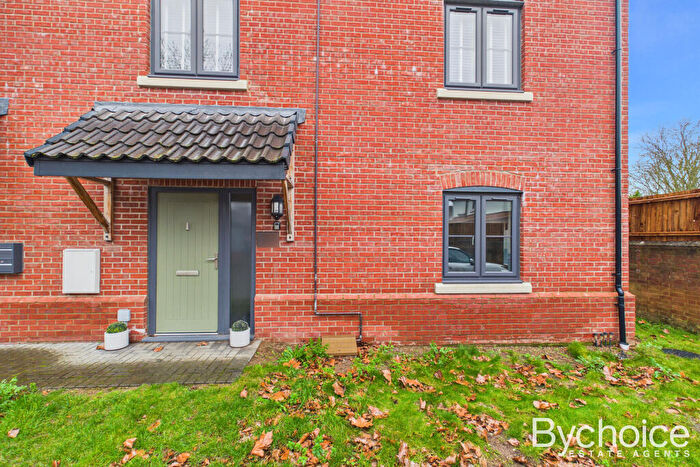
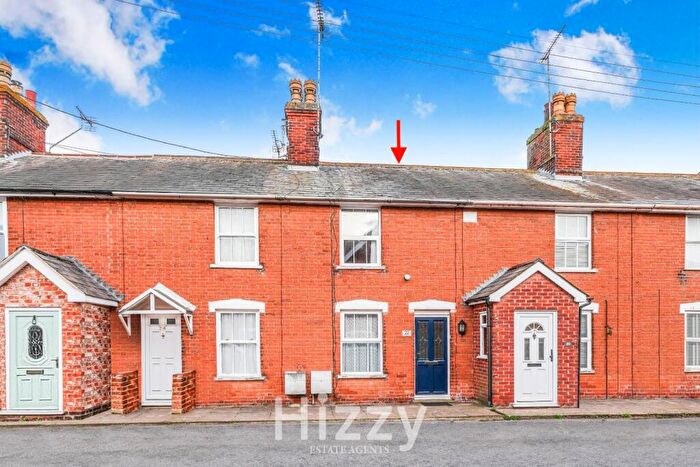
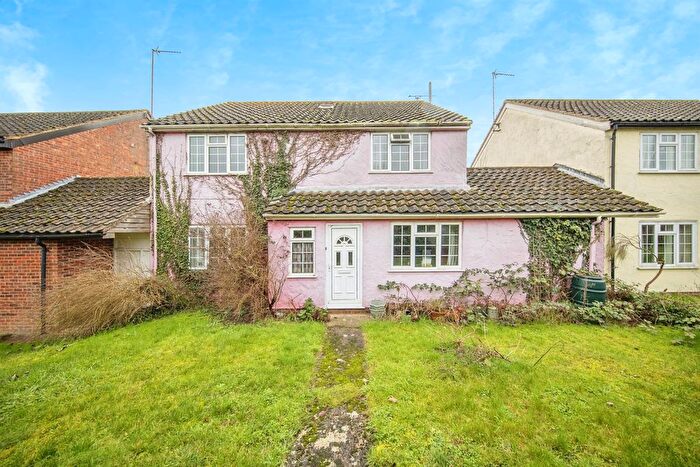
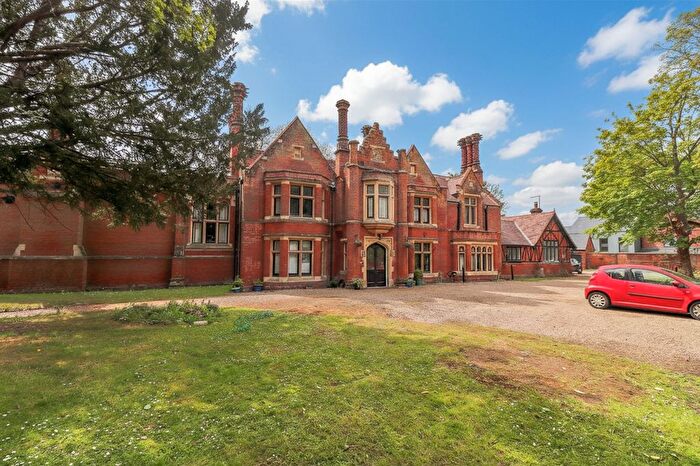
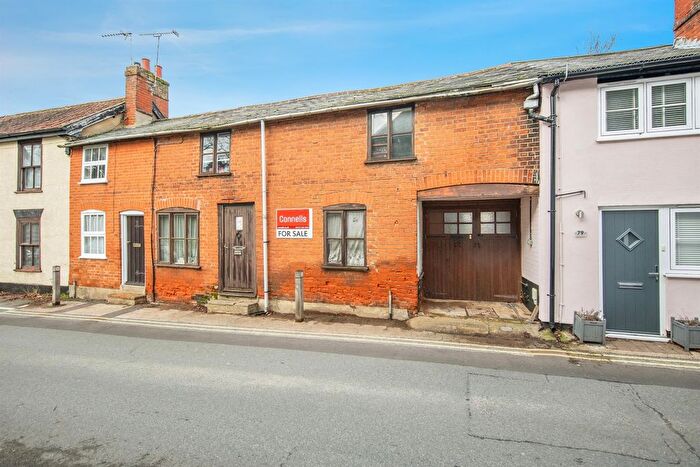
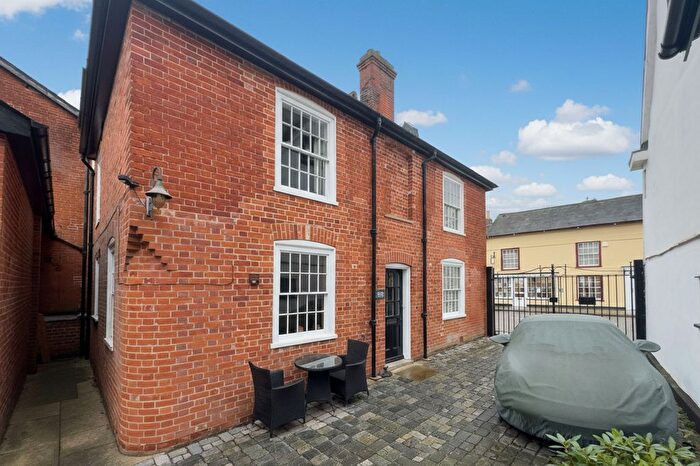
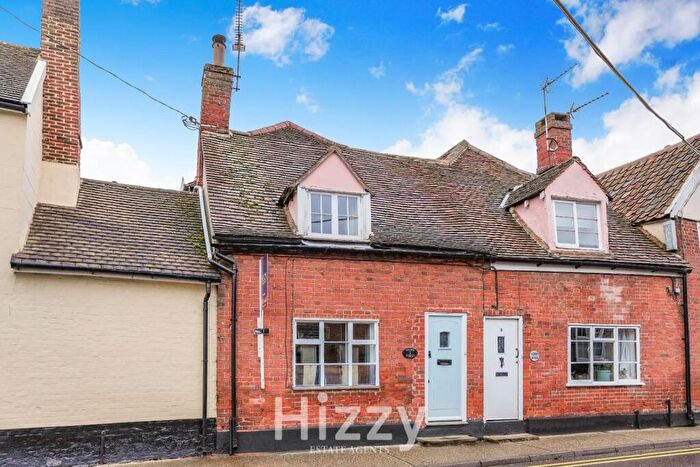
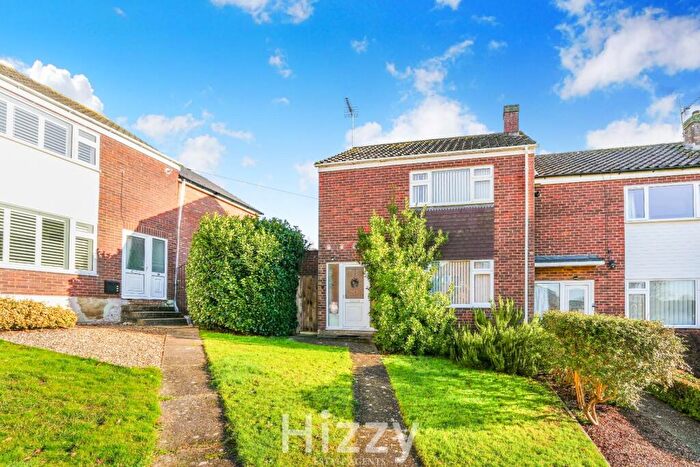
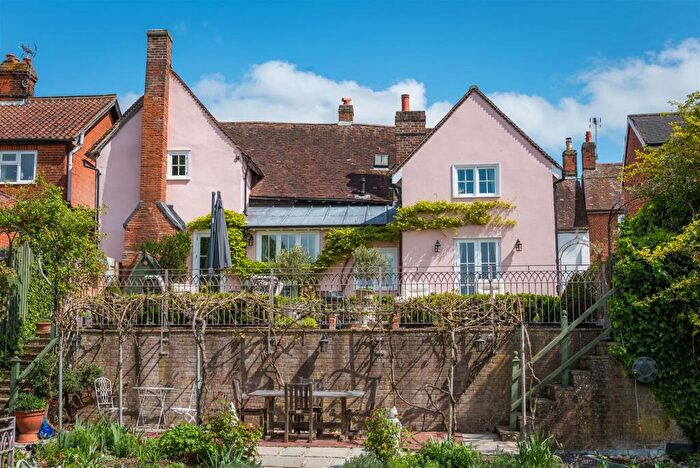
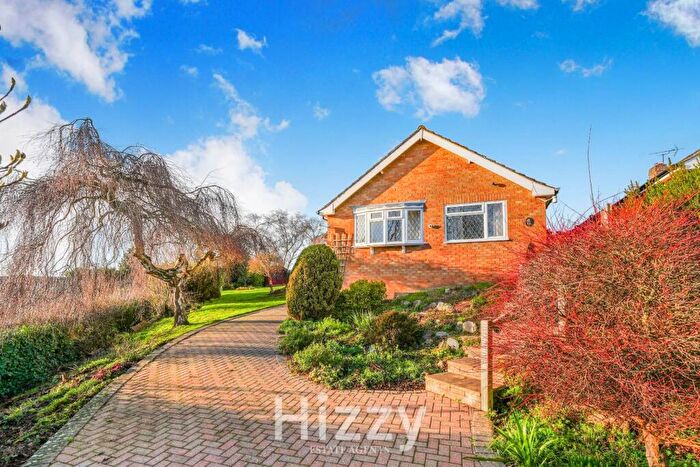
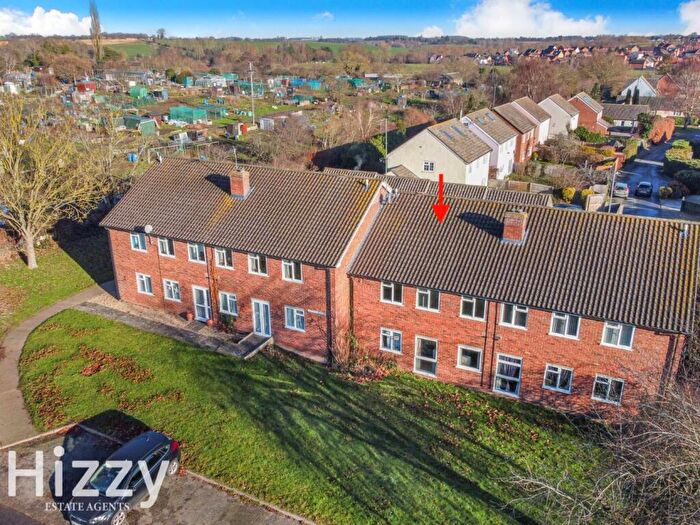
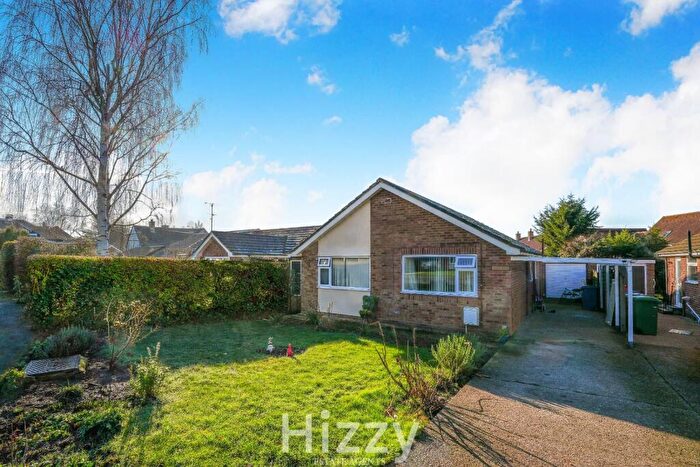
Houses for sale & to rent in Lower Brett, Ipswich
House Prices in Lower Brett
Properties in Lower Brett have an average house price of £523,089.00 and had 39 Property Transactions within the last 3 years¹.
Lower Brett is an area in Ipswich, Suffolk with 470 households², where the most expensive property was sold for £950,000.00.
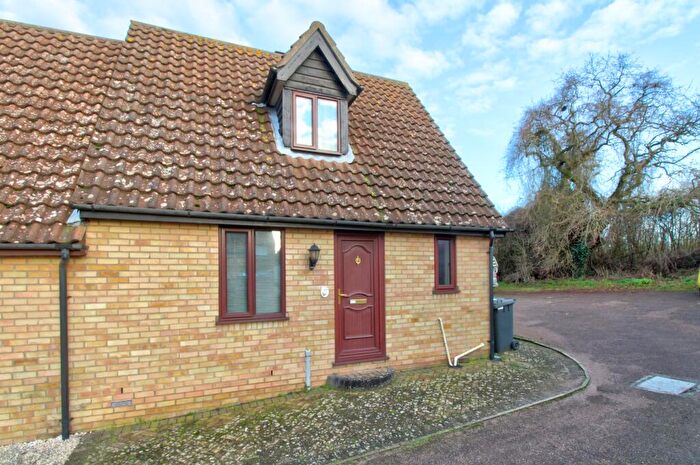
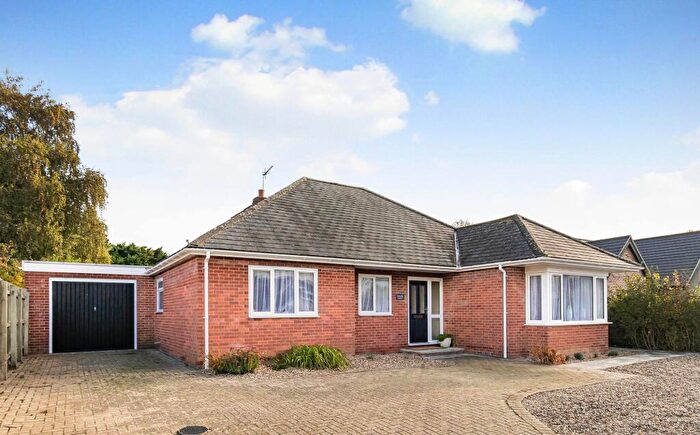
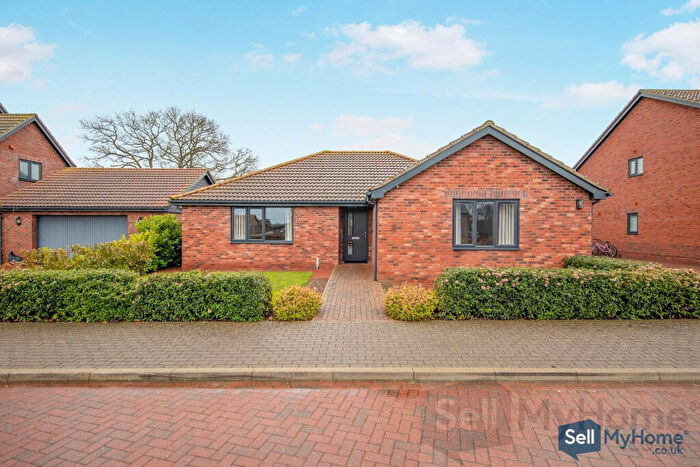
Properties for sale in Lower Brett
Roads and Postcodes in Lower Brett
Navigate through our locations to find the location of your next house in Lower Brett, Ipswich for sale or to rent.
| Streets | Postcodes |
|---|---|
| Brett Green | IP7 5LX |
| Church Lane | IP7 5LY |
| Evans Heath | IP7 5NX |
| Gardeners Close | IP7 5NL |
| Hadleigh Heath | IP7 5NT IP7 5NU IP7 5NY IP7 5NZ |
| Higham Hill | IP7 5QJ |
| Layham Road | IP7 5NB |
| Mill Lane | IP7 5JT IP7 5JY |
| Mount Pleasant | IP7 5QW |
| New Barn Lane | IP7 5LQ |
| Noaks Road | IP7 5LR |
| Old Orchard | IP7 5LB |
| Overbury Hall Road | IP7 5NA |
| Pipkin Hill | IP7 5JS |
| Ponds Farm Cottages | IP7 5QP |
| Rands Road | IP7 5RN IP7 5RW |
| Raworth Park | IP7 5JU |
| Rectory Close | IP7 5LS |
| Shelley Priory Cottages | IP7 5RQ |
| Stoke Road | IP7 5RB |
| Sulleys Hill | IP7 5QQ |
| The Gardens | IP7 5LU |
| The Street | IP7 5LP IP7 5LT IP7 5LW IP7 5LZ |
| Upper Street | IP7 5JX IP7 5JZ IP7 5LE |
| Vauxhall Bungalows | IP7 5QA |
| Water Farm Drive | IP7 5JD |
| Water Lane | IP7 5LA |
| Watermill Close | IP7 5LD |
| Waterworks Cottages | IP7 5LF |
| Woodlands Road | IP7 5LJ IP7 5QD |
| IP7 5LH IP7 5LN IP7 5PY IP7 5PZ IP7 5QH IP7 5QL IP7 5QN IP7 5QT IP7 5QX IP7 5QZ IP7 5RD IP7 5RR |
Transport near Lower Brett
-
Manningtree Station
-
Mistley Station
-
Ipswich Station
-
Colchester Station
-
Bures Station
-
Hythe Station
-
Colchester Town Station
-
Derby Road Station
-
Westerfield Station
-
Sudbury Station
- FAQ
- Price Paid By Year
- Property Type Price
Frequently asked questions about Lower Brett
What is the average price for a property for sale in Lower Brett?
The average price for a property for sale in Lower Brett is £523,089. This amount is 81% higher than the average price in Ipswich. There are 937 property listings for sale in Lower Brett.
What streets have the most expensive properties for sale in Lower Brett?
The streets with the most expensive properties for sale in Lower Brett are Church Lane at an average of £920,000, Vauxhall Bungalows at an average of £880,000 and Hadleigh Heath at an average of £875,000.
What streets have the most affordable properties for sale in Lower Brett?
The streets with the most affordable properties for sale in Lower Brett are Brett Green at an average of £243,416, Sulleys Hill at an average of £380,500 and Overbury Hall Road at an average of £425,000.
Which train stations are available in or near Lower Brett?
Some of the train stations available in or near Lower Brett are Manningtree, Mistley and Ipswich.
Property Price Paid in Lower Brett by Year
The average sold property price by year was:
| Year | Average Sold Price | Price Change |
Sold Properties
|
|---|---|---|---|
| 2025 | £661,000 | 20% |
8 Properties |
| 2024 | £525,921 | 19% |
19 Properties |
| 2023 | £426,666 | -28% |
12 Properties |
| 2022 | £544,875 | -14% |
12 Properties |
| 2021 | £621,210 | 41% |
19 Properties |
| 2020 | £368,343 | -25% |
16 Properties |
| 2019 | £460,666 | -1% |
18 Properties |
| 2018 | £466,176 | 13% |
17 Properties |
| 2017 | £405,611 | -3% |
18 Properties |
| 2016 | £417,375 | 11% |
14 Properties |
| 2015 | £370,483 | 27% |
17 Properties |
| 2014 | £270,307 | 27% |
13 Properties |
| 2013 | £197,050 | -98% |
10 Properties |
| 2012 | £390,944 | 31% |
9 Properties |
| 2011 | £268,071 | -28% |
14 Properties |
| 2010 | £343,806 | 5% |
24 Properties |
| 2009 | £326,021 | 12% |
23 Properties |
| 2008 | £286,381 | 5% |
11 Properties |
| 2007 | £271,636 | -19% |
33 Properties |
| 2006 | £322,968 | 27% |
16 Properties |
| 2005 | £236,772 | 0,3% |
22 Properties |
| 2004 | £236,102 | -29% |
23 Properties |
| 2003 | £305,622 | 40% |
24 Properties |
| 2002 | £183,073 | 1% |
34 Properties |
| 2001 | £180,873 | 4% |
31 Properties |
| 2000 | £173,627 | 41% |
22 Properties |
| 1999 | £102,762 | -43% |
27 Properties |
| 1998 | £146,738 | 32% |
21 Properties |
| 1997 | £99,094 | 4% |
18 Properties |
| 1996 | £94,716 | 11% |
18 Properties |
| 1995 | £84,759 | - |
11 Properties |
Property Price per Property Type in Lower Brett
Here you can find historic sold price data in order to help with your property search.
The average Property Paid Price for specific property types in the last three years are:
| Property Type | Average Sold Price | Sold Properties |
|---|---|---|
| Semi Detached House | £349,375.00 | 8 Semi Detached Houses |
| Detached House | £678,260.00 | 23 Detached Houses |
| Terraced House | £250,687.00 | 8 Terraced Houses |

