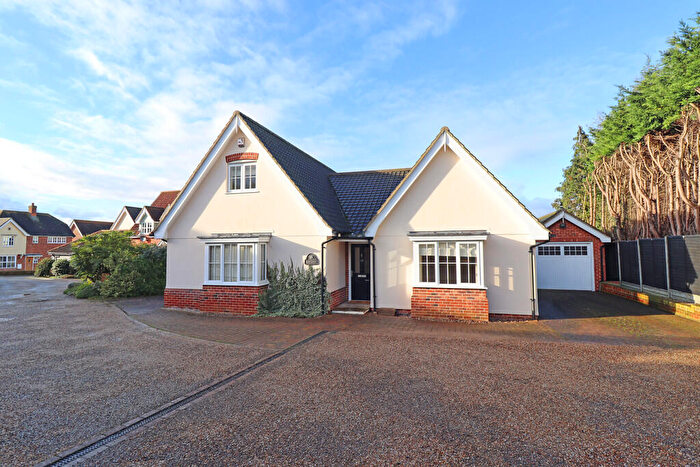
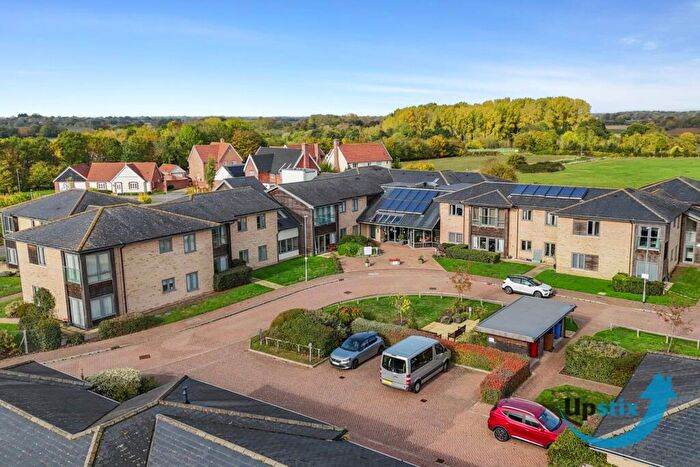
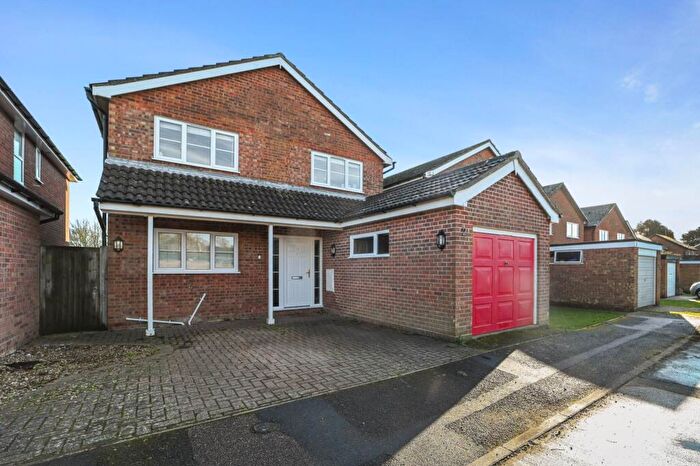
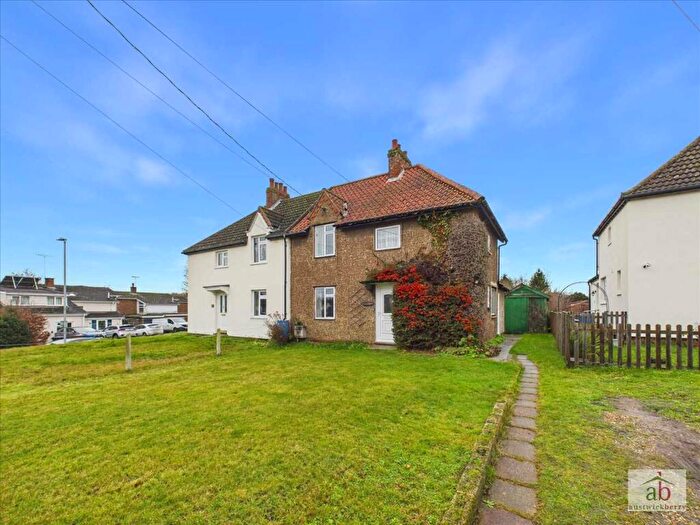
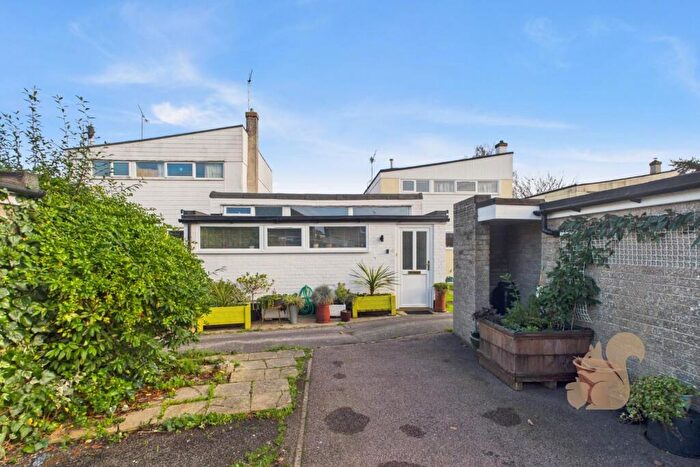
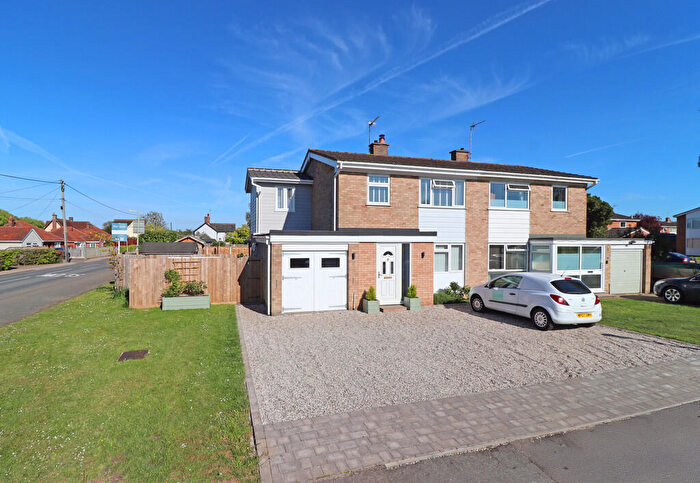
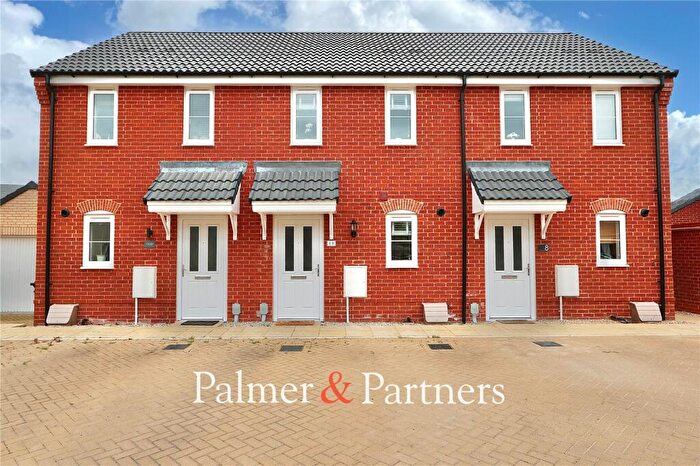
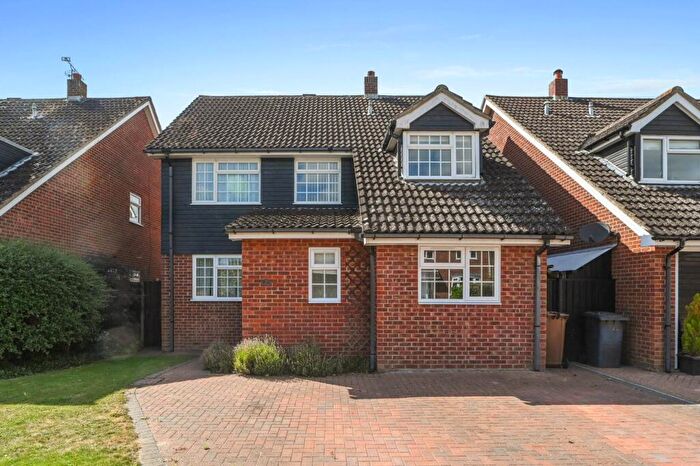
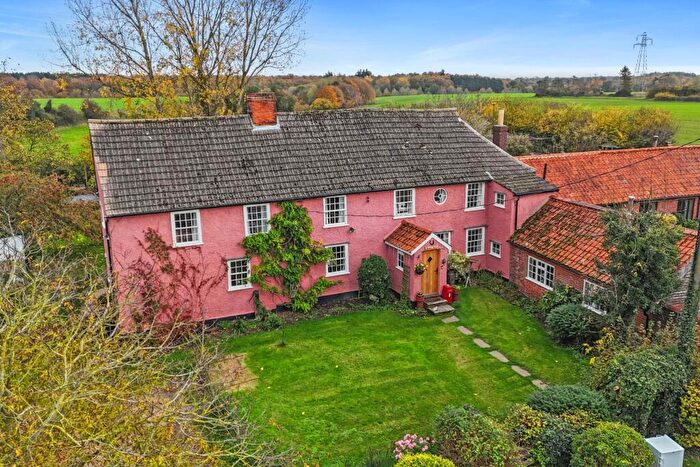
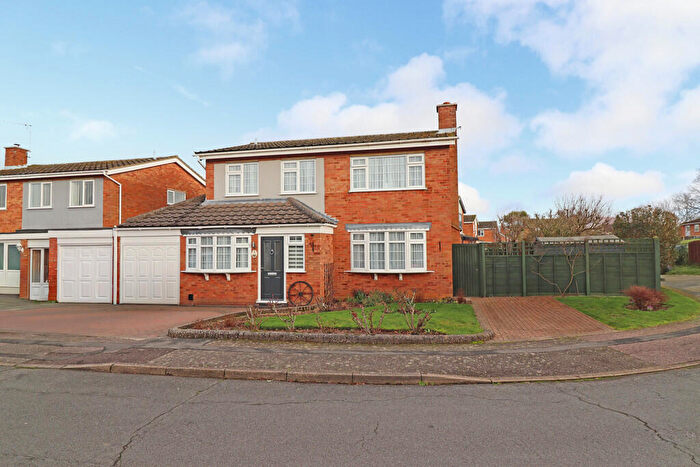
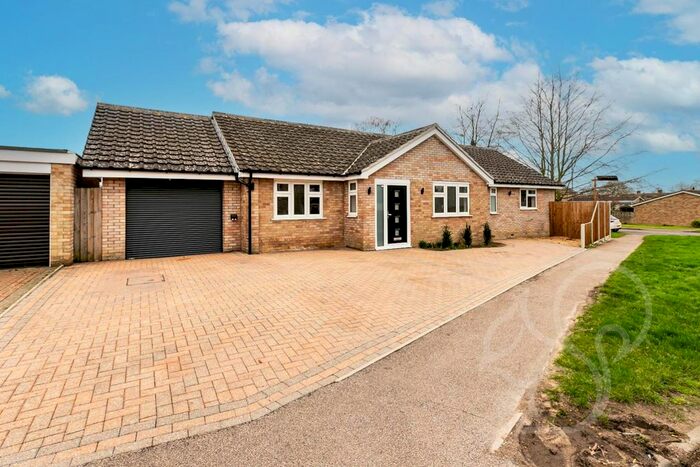
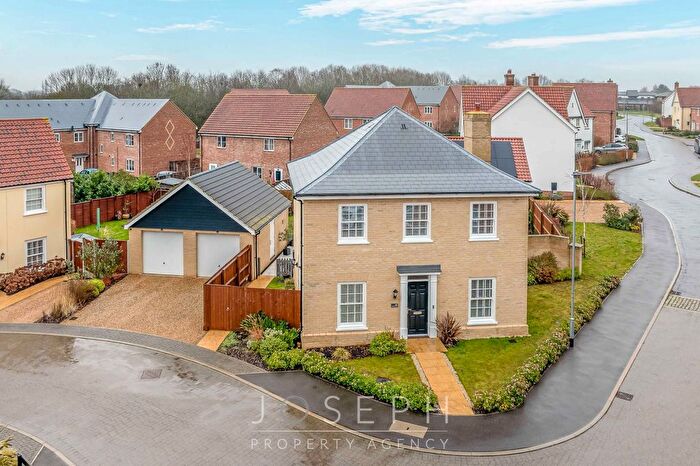
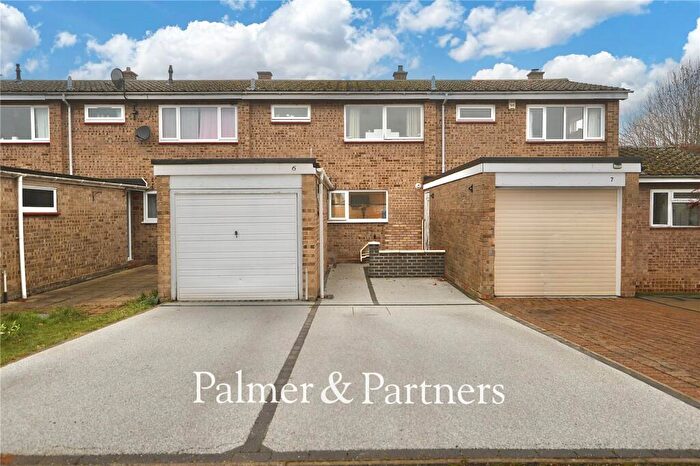
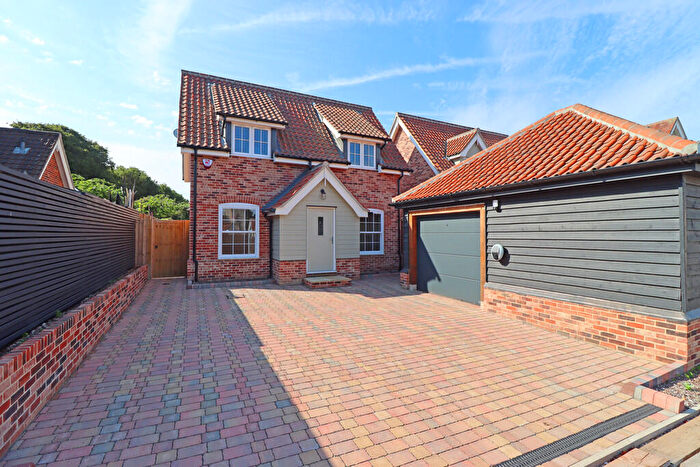
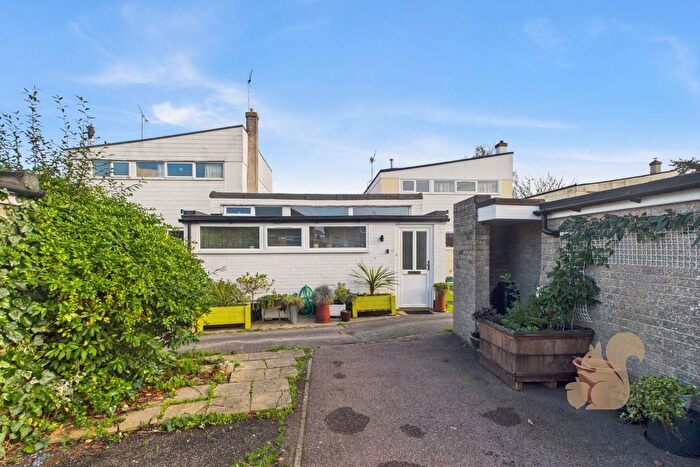
Houses for sale & to rent in Mid Samford, Ipswich
House Prices in Mid Samford
Properties in Mid Samford have an average house price of £408,547.00 and had 101 Property Transactions within the last 3 years¹.
Mid Samford is an area in Ipswich, Suffolk with 1,147 households², where the most expensive property was sold for £2,150,000.00.
Properties for sale in Mid Samford
Previously listed properties in Mid Samford
Roads and Postcodes in Mid Samford
Navigate through our locations to find the location of your next house in Mid Samford, Ipswich for sale or to rent.
| Streets | Postcodes |
|---|---|
| Aisthorpe | IP9 2HT |
| Ash Grove | IP9 2UW |
| Barnfield | IP9 2UL |
| Bluegate Lane | IP9 2JX |
| Boydlands | IP9 2UX |
| Broom Way | IP9 2XN |
| Bushey Close | IP9 2HW |
| Capel Grove | IP9 2JS |
| Catesbray | IP9 2UN |
| Cedars Lane | IP9 2JA |
| Chalkners Close | IP9 2HG |
| Chapel Close | IP9 2ES |
| Coombers | IP9 2EY |
| Crotchets Close | IP9 2UR |
| Dawes Close | IP9 2JQ |
| Days Green | IP9 2HZ |
| Days Road | IP9 2HY IP9 2LB IP9 2LE |
| Dodmans | IP9 2ET |
| Dove Close | IP9 2AW |
| Elm Lane | IP9 2HS |
| Farthings Went | IP9 2UJ |
| Friars | IP9 2XS |
| Garrods | IP9 2HJ |
| Glebe End | IP9 2XR |
| Great Tufts | IP9 2UB |
| Hawbridge | IP9 2XW |
| Homefield | IP9 2XE |
| Jermyns Close | IP9 2UQ |
| Lattinford Bridge | IP9 2JZ |
| Letton Close | IP9 2HF |
| Link Road | IP9 2HH |
| Little Grove | IP9 2HD |
| Little Gulls | IP9 2EZ |
| Little Tufts | IP9 2UD |
| London Road | IP9 2JJ IP9 2JR IP9 2JT |
| Long Perry | IP9 2XD |
| Longfield Road | IP9 2UA IP9 2XL |
| Mill Close | IP9 2JG |
| Mill Hill | IP9 2JE IP9 2LA |
| Mowlands | IP9 2XB |
| Old London Road | IP9 2JU |
| Old Rectory Walk | IP9 2HX |
| Penn Close | IP9 2UE |
| Penny Meadow | IP9 2UU |
| Peters Grove | IP9 2XF |
| Playfield Road | IP9 2HP |
| Plough Road | IP9 2EX |
| Pound Lane | IP9 2JB |
| Red Sleeve | IP9 2HA |
| Rembrow Road | IP9 2EU |
| Roundridge Road | IP9 2UG |
| Rylands | IP9 2XJ |
| School Close | IP9 2UP |
| Smithers Close | IP9 2HN |
| Snowcroft | IP9 2UT |
| Tawney Close | IP9 2HR |
| The Drift | IP9 2DU |
| The Old Street | IP9 2EA |
| The Parkins | IP9 2JH |
| The Pightle | IP9 2UF |
| The Queech | IP9 2UH |
| The Squirrells | IP9 2XQ |
| The Street | IP9 2EB IP9 2EE IP9 2EF IP9 2EG IP9 2EH IP9 2EL IP9 2EQ IP9 2LF |
| Thorney Road | IP9 2HL IP9 2LH IP9 2LJ IP9 2LL IP9 2LQ IP9 2UY IP9 2XH |
| Tollgate Road | IP9 2HB |
| Two Acres | IP9 2XP |
| Vine Walk | IP9 2ER |
| White Horse Road | IP9 2XA |
| Winding Piece | IP9 2UZ |
| Windmill Hill | IP9 2JF |
Transport near Mid Samford
-
Manningtree Station
-
Mistley Station
-
Ipswich Station
-
Derby Road Station
-
Wrabness Station
-
Westerfield Station
-
Hythe Station
-
Colchester Station
-
Harwich International Station
- FAQ
- Price Paid By Year
- Property Type Price
Frequently asked questions about Mid Samford
What is the average price for a property for sale in Mid Samford?
The average price for a property for sale in Mid Samford is £408,547. This amount is 41% higher than the average price in Ipswich. There are 345 property listings for sale in Mid Samford.
What streets have the most expensive properties for sale in Mid Samford?
The streets with the most expensive properties for sale in Mid Samford are The Drift at an average of £647,375, London Road at an average of £632,571 and Rembrow Road at an average of £585,000.
What streets have the most affordable properties for sale in Mid Samford?
The streets with the most affordable properties for sale in Mid Samford are Dove Close at an average of £153,750, Barnfield at an average of £245,125 and Garrods at an average of £265,000.
Which train stations are available in or near Mid Samford?
Some of the train stations available in or near Mid Samford are Manningtree, Mistley and Ipswich.
Property Price Paid in Mid Samford by Year
The average sold property price by year was:
| Year | Average Sold Price | Price Change |
Sold Properties
|
|---|---|---|---|
| 2025 | £474,880 | 20% |
21 Properties |
| 2024 | £378,835 | -6% |
39 Properties |
| 2023 | £402,834 | -2% |
41 Properties |
| 2022 | £412,586 | 14% |
52 Properties |
| 2021 | £355,556 | 13% |
37 Properties |
| 2020 | £310,175 | -10% |
35 Properties |
| 2019 | £341,410 | -0,1% |
25 Properties |
| 2018 | £341,775 | -0,1% |
39 Properties |
| 2017 | £342,110 | 20% |
47 Properties |
| 2016 | £273,399 | -0,4% |
49 Properties |
| 2015 | £274,362 | - |
49 Properties |
| 2014 | £274,271 | 19% |
35 Properties |
| 2013 | £222,723 | -25% |
35 Properties |
| 2012 | £278,084 | 23% |
34 Properties |
| 2011 | £213,974 | -12% |
39 Properties |
| 2010 | £240,454 | 0,1% |
33 Properties |
| 2009 | £240,237 | 2% |
38 Properties |
| 2008 | £236,491 | -0,4% |
29 Properties |
| 2007 | £237,534 | 8% |
58 Properties |
| 2006 | £219,692 | 4% |
61 Properties |
| 2005 | £210,551 | -1% |
45 Properties |
| 2004 | £213,107 | 8% |
39 Properties |
| 2003 | £196,193 | 12% |
41 Properties |
| 2002 | £172,109 | 18% |
61 Properties |
| 2001 | £141,186 | 21% |
44 Properties |
| 2000 | £111,425 | 12% |
44 Properties |
| 1999 | £98,248 | 29% |
50 Properties |
| 1998 | £70,084 | -16% |
49 Properties |
| 1997 | £81,440 | 1% |
59 Properties |
| 1996 | £80,298 | 18% |
51 Properties |
| 1995 | £65,921 | - |
46 Properties |
Property Price per Property Type in Mid Samford
Here you can find historic sold price data in order to help with your property search.
The average Property Paid Price for specific property types in the last three years are:
| Property Type | Average Sold Price | Sold Properties |
|---|---|---|
| Semi Detached House | £312,697.00 | 32 Semi Detached Houses |
| Detached House | £492,544.00 | 56 Detached Houses |
| Terraced House | £295,583.00 | 12 Terraced Houses |
| Flat | £127,500.00 | 1 Flat |

