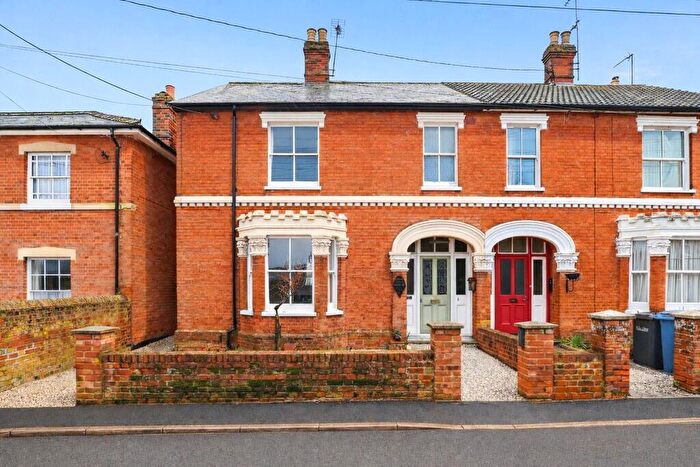
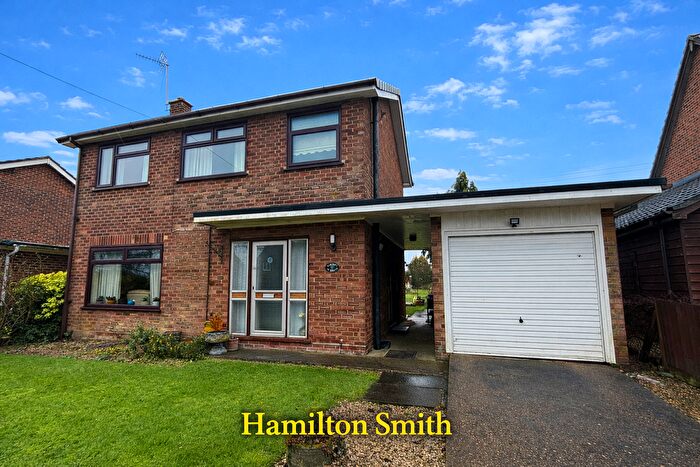
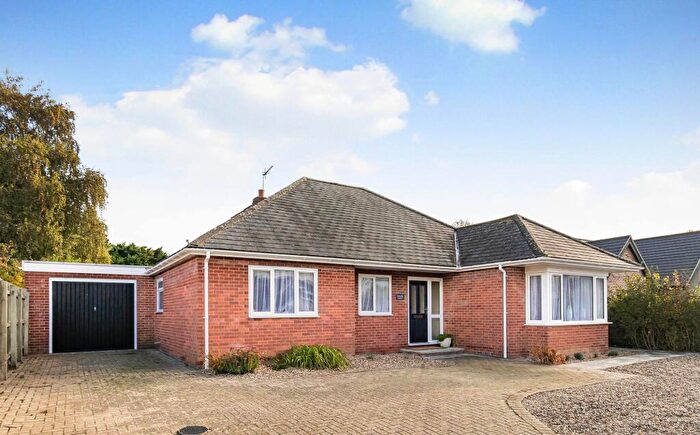
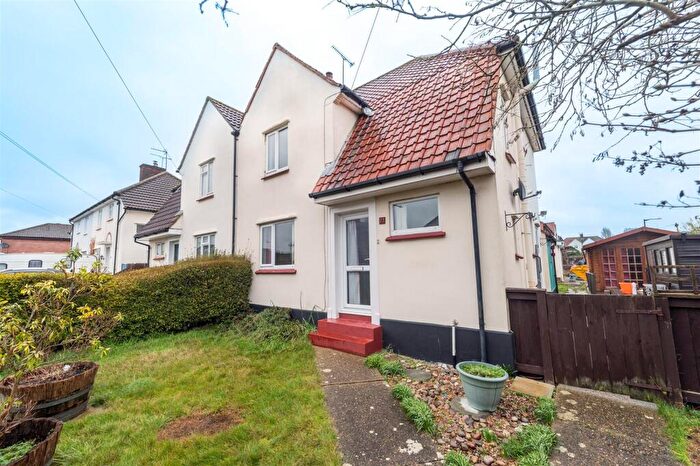
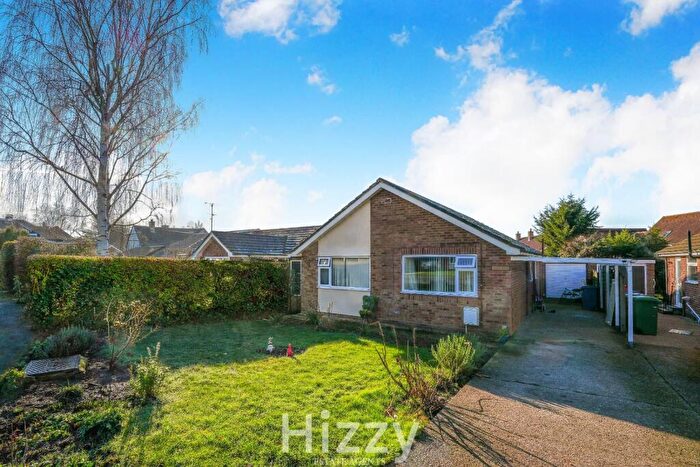
Houses for sale & to rent in South Cosford, Ipswich
House Prices in South Cosford
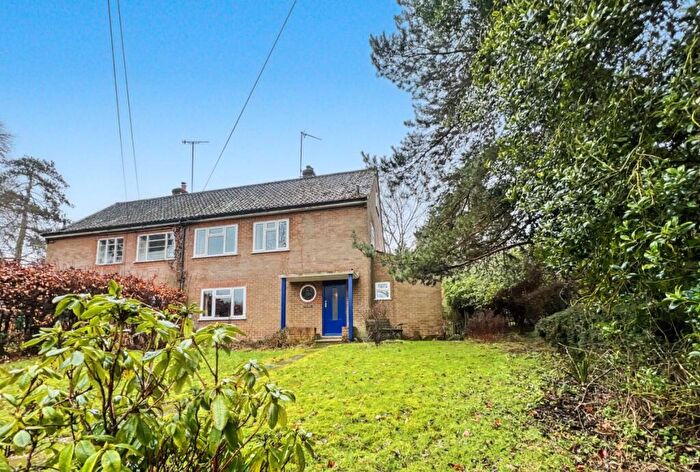
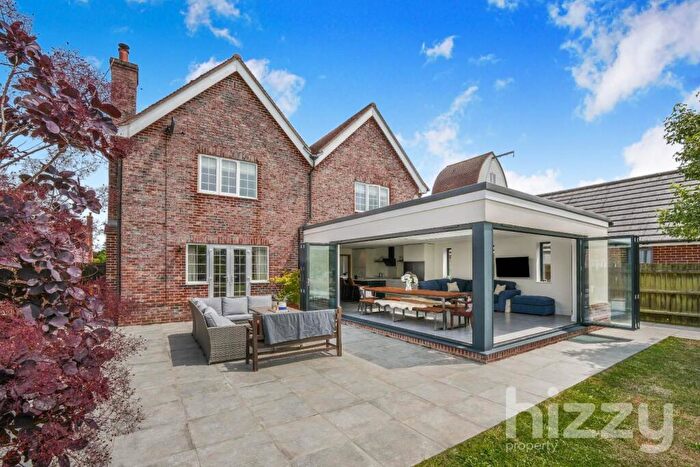
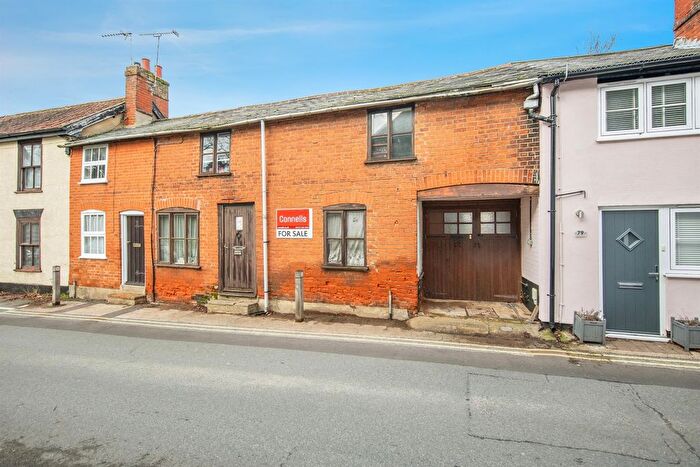
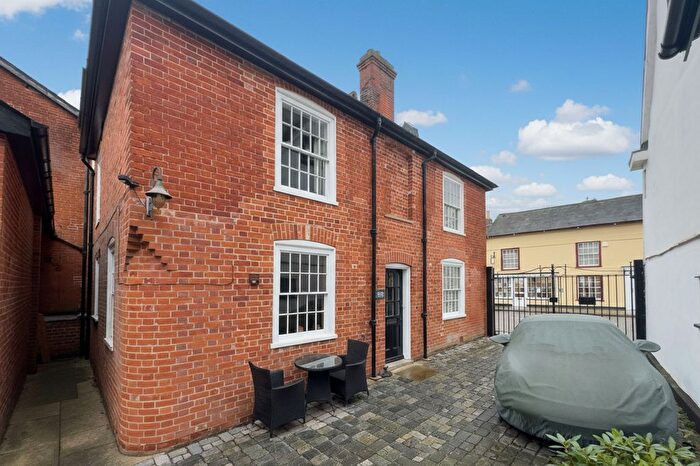
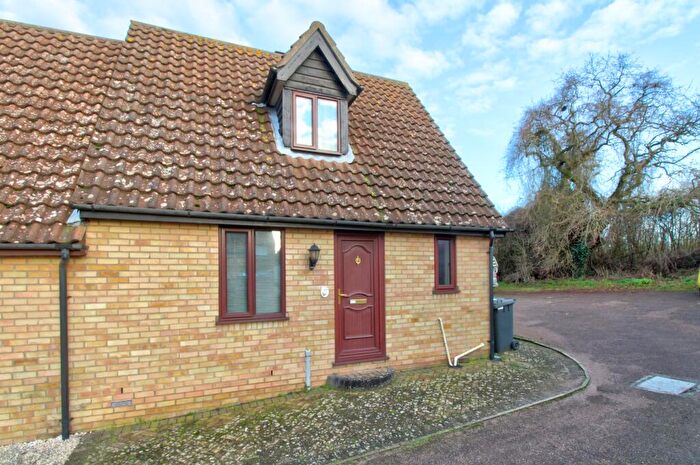
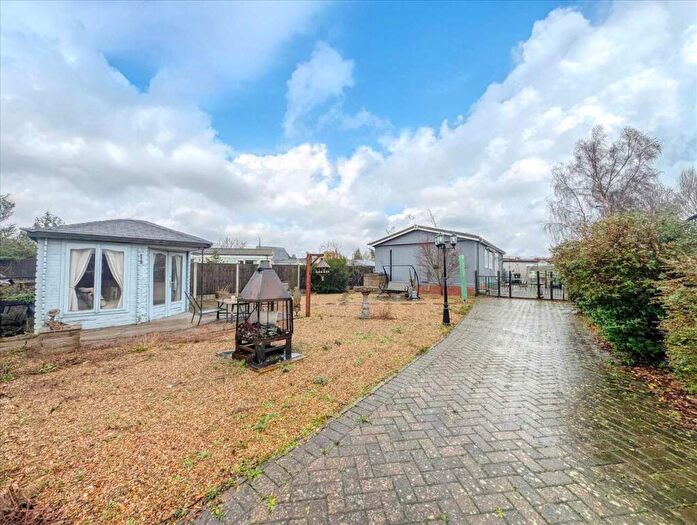
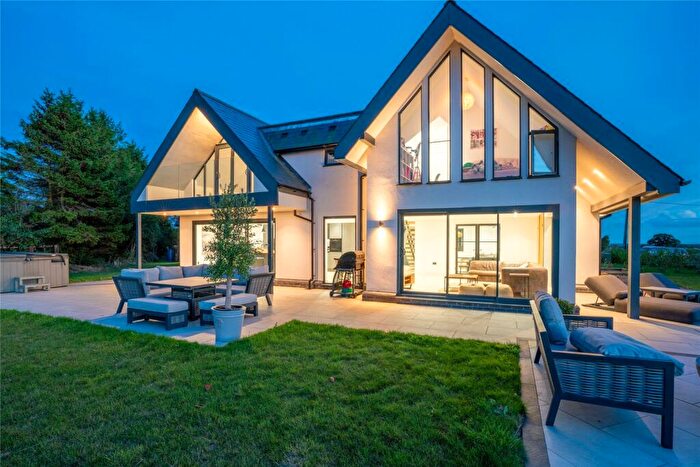
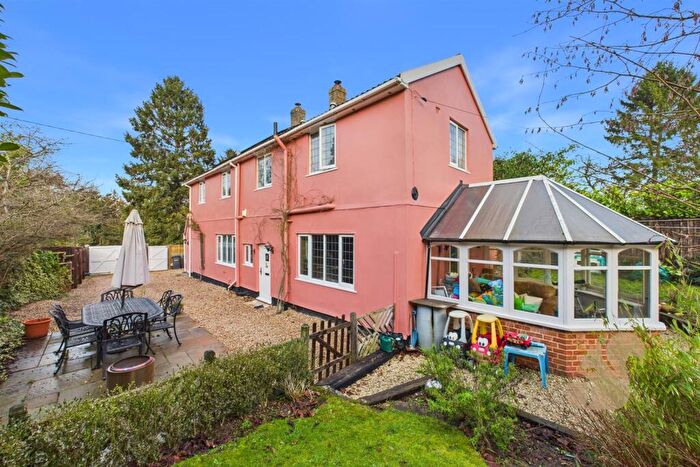
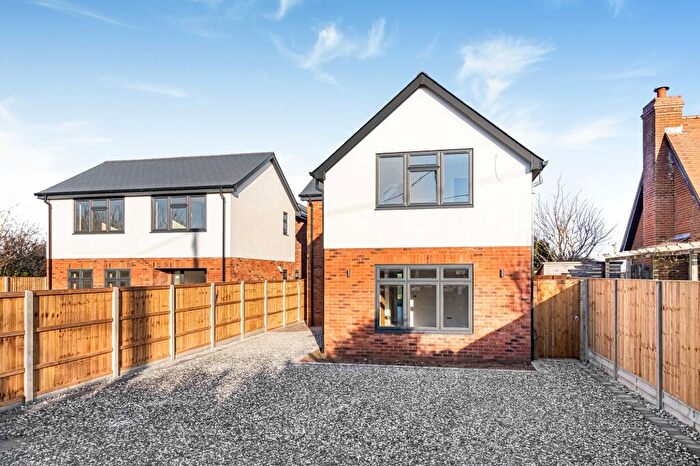
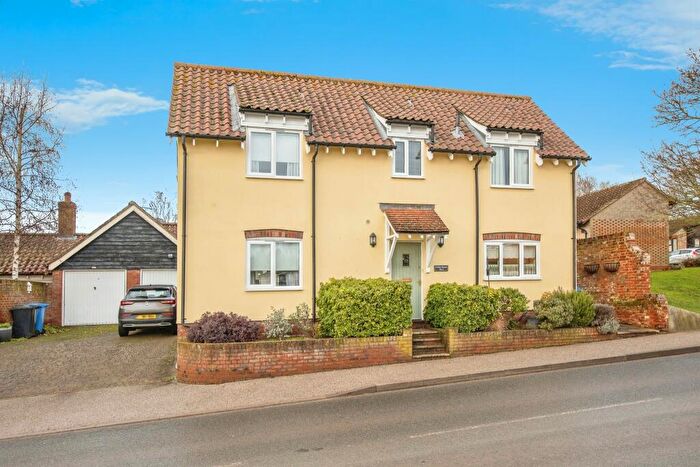
Properties in South Cosford have an average house price of £476,295.00 and had 62 Property Transactions within the last 3 years¹.
South Cosford is an area in Ipswich, Suffolk with 832 households², where the most expensive property was sold for £995,000.00.
Properties for sale in South Cosford
Roads and Postcodes in South Cosford
Navigate through our locations to find the location of your next house in South Cosford, Ipswich for sale or to rent.
| Streets | Postcodes |
|---|---|
| Aldham Priory Cottages | IP7 6NT |
| Ancient Houses | IP7 6EA |
| Ash Street | IP7 6QZ |
| Bildeston Road | IP7 6JG |
| Blenheim Meadow | IP7 7GA |
| Cherry Hill | IP7 6EG |
| Church Farm Cottages | IP7 6PB |
| Church Hill | IP7 6DZ IP7 6EE IP7 6EF |
| Church Lane | IP7 6JB IP7 6JD IP7 6QR |
| Cookes Hill | IP7 6JF |
| Corn Hatches Lane | IP7 6NE |
| Cosford Road | IP7 6LF |
| Crowcroft Glebe | IP7 7LH |
| Crowcroft Road | IP7 7GZ IP7 7HR |
| Dairy Road | IP7 6RA |
| Downlands | IP7 6QF |
| Elm Cottages | IP7 6LU |
| Elmsett Road | IP7 6LL IP7 6NQ |
| Fir Tree Cottages | IP7 6NJ |
| Flowton Road | IP7 6PF |
| Garrards Road | IP7 6NB |
| Hadleigh Road | IP7 6ND IP7 7HD |
| Hazelwood | IP7 6QD |
| Hollies Cottages | IP7 6HA |
| Ipswich Road | IP7 6NY IP7 7BN IP7 7BW IP7 7DA |
| Ladbrook Close | IP7 6LD |
| Lodge Cottages | IP7 6HW |
| Manor Road | IP7 6PL IP7 6PN |
| Mill Lane | IP7 6LP |
| Mill Place | IP7 6GZ |
| Naughton Road | IP7 6QL |
| Nedging Road | IP7 7HH IP7 7HJ IP7 7HL IP7 7HN IP7 7HQ IP7 7HW |
| New Road | IP7 7BU |
| Newlands | IP7 6NZ |
| Old Post Office Cottages | IP7 6NA |
| Priory Hill | IP7 6DU |
| Rectory Road | IP7 6QU |
| Redhill Road | IP7 6NR |
| Sawyers | IP7 6QH |
| Semer Road | IP7 6QX IP7 7BY |
| The Green | IP7 6EB IP7 6QS IP7 7BT |
| The Street | IP7 6DY IP7 6ED IP7 6NH IP7 6NL IP7 6NN IP7 6PA IP7 6PE IP7 6QN IP7 6QP IP7 6QW |
| The Tye | IP7 6HB |
| Union Hill | IP7 6HN |
| Vale Lane | IP7 6EH |
| Whatfield Road | IP7 6LJ IP7 6LS IP7 6LT IP7 6LW IP7 6LZ IP7 7BP IP7 7BS |
| Wheatfields | IP7 6RB |
| Wickerstreet Green | IP7 6EY IP7 6EZ |
| Windings Road | IP7 6QE |
| IP7 6EN IP7 6EP IP7 6ER IP7 6ES IP7 6EU IP7 6EW IP7 6HS IP7 6HZ IP7 6NG IP7 6NS IP7 6QG |
Transport near South Cosford
-
Needham Market Station
-
Stowmarket Station
-
Ipswich Station
-
Westerfield Station
-
Sudbury Station
-
Manningtree Station
-
Derby Road Station
- FAQ
- Price Paid By Year
- Property Type Price
Frequently asked questions about South Cosford
What is the average price for a property for sale in South Cosford?
The average price for a property for sale in South Cosford is £476,295. This amount is 65% higher than the average price in Ipswich. There are 1,413 property listings for sale in South Cosford.
What streets have the most expensive properties for sale in South Cosford?
The streets with the most expensive properties for sale in South Cosford are The Green at an average of £870,000, Manor Road at an average of £785,000 and Old Post Office Cottages at an average of £760,000.
What streets have the most affordable properties for sale in South Cosford?
The streets with the most affordable properties for sale in South Cosford are Hazelwood at an average of £165,000, Crowcroft Glebe at an average of £249,000 and Ladbrook Close at an average of £280,000.
Which train stations are available in or near South Cosford?
Some of the train stations available in or near South Cosford are Needham Market, Stowmarket and Ipswich.
Property Price Paid in South Cosford by Year
The average sold property price by year was:
| Year | Average Sold Price | Price Change |
Sold Properties
|
|---|---|---|---|
| 2025 | £450,840 | -10% |
22 Properties |
| 2024 | £494,923 | 1% |
15 Properties |
| 2023 | £487,520 | 5% |
25 Properties |
| 2022 | £465,033 | 0,4% |
30 Properties |
| 2021 | £463,387 | 7% |
36 Properties |
| 2020 | £429,439 | 20% |
33 Properties |
| 2019 | £345,257 | -10% |
31 Properties |
| 2018 | £380,333 | -28% |
24 Properties |
| 2017 | £485,461 | 13% |
39 Properties |
| 2016 | £424,240 | 26% |
26 Properties |
| 2015 | £312,903 | -6% |
33 Properties |
| 2014 | £332,486 | -16% |
33 Properties |
| 2013 | £385,710 | 36% |
29 Properties |
| 2012 | £245,790 | -63% |
30 Properties |
| 2011 | £399,491 | 14% |
18 Properties |
| 2010 | £344,106 | 13% |
30 Properties |
| 2009 | £298,239 | -7% |
28 Properties |
| 2008 | £320,437 | 9% |
24 Properties |
| 2007 | £290,179 | -3% |
42 Properties |
| 2006 | £299,947 | 6% |
49 Properties |
| 2005 | £281,010 | 10% |
38 Properties |
| 2004 | £253,209 | 11% |
40 Properties |
| 2003 | £225,658 | 1% |
22 Properties |
| 2002 | £222,940 | 26% |
47 Properties |
| 2001 | £164,614 | -6% |
31 Properties |
| 2000 | £174,842 | 25% |
32 Properties |
| 1999 | £130,308 | 6% |
55 Properties |
| 1998 | £122,602 | -14% |
38 Properties |
| 1997 | £140,074 | 40% |
42 Properties |
| 1996 | £84,715 | -29% |
30 Properties |
| 1995 | £109,448 | - |
28 Properties |
Property Price per Property Type in South Cosford
Here you can find historic sold price data in order to help with your property search.
The average Property Paid Price for specific property types in the last three years are:
| Property Type | Average Sold Price | Sold Properties |
|---|---|---|
| Semi Detached House | £358,571.00 | 14 Semi Detached Houses |
| Detached House | £535,144.00 | 44 Detached Houses |
| Terraced House | £241,000.00 | 4 Terraced Houses |

