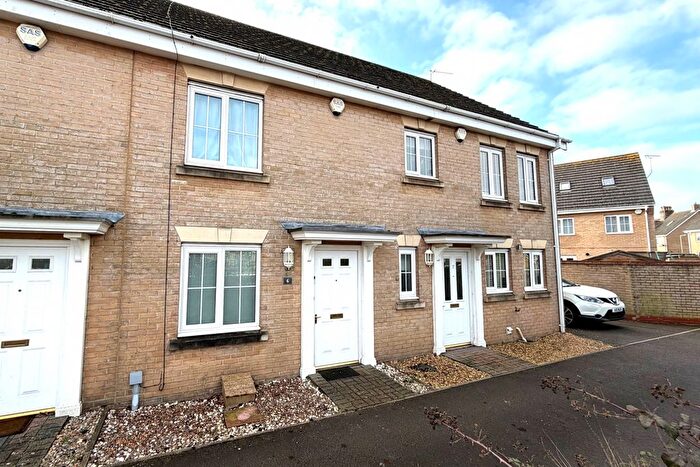
Houses for sale & to rent in Lothingland, Lowestoft
House Prices in Lothingland
Properties in Lothingland have an average house price of £340,551.00 and had 79 Property Transactions within the last 3 years¹.
Lothingland is an area in Lowestoft, Suffolk with 912 households², where the most expensive property was sold for £900,000.00.
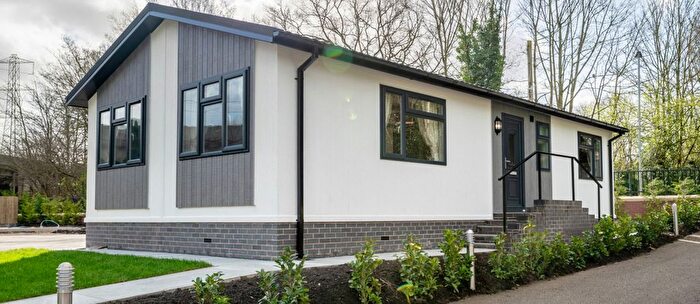
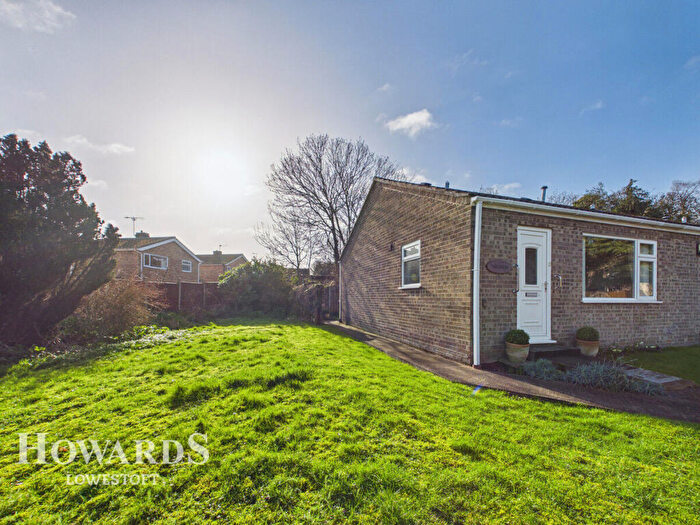
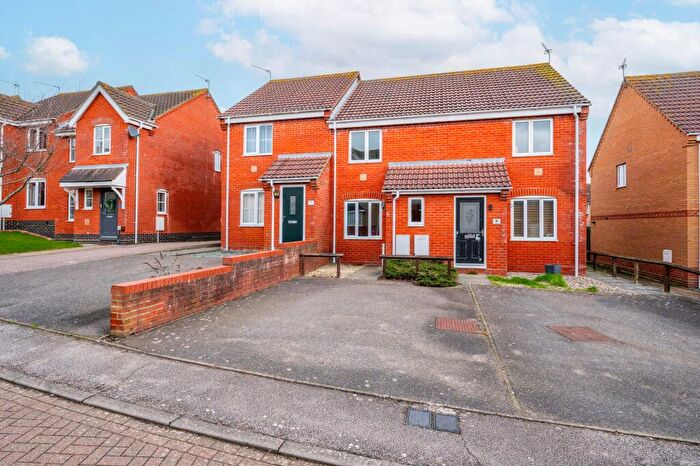
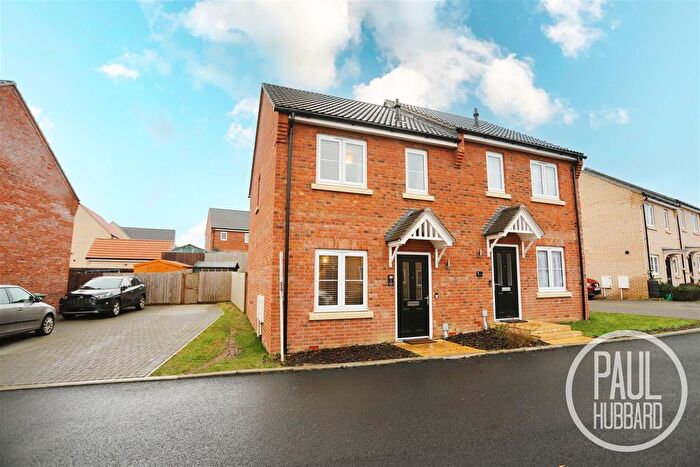
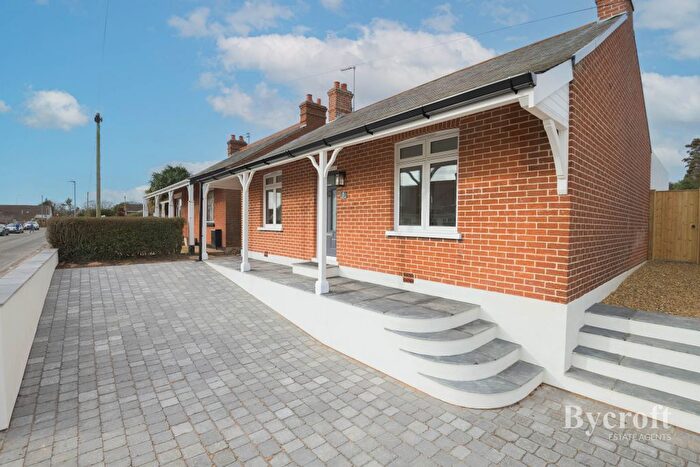
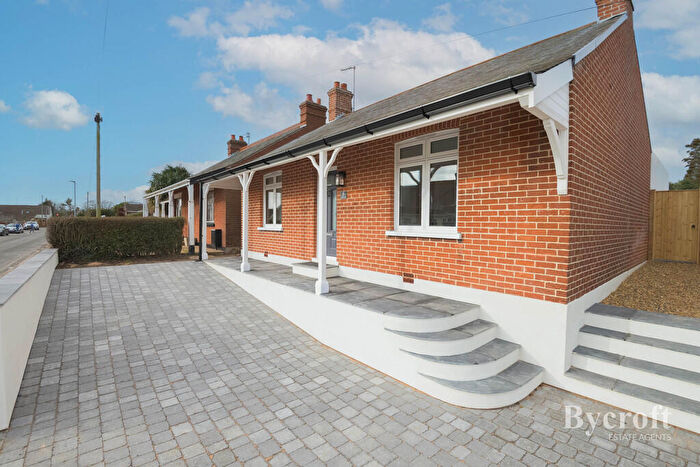
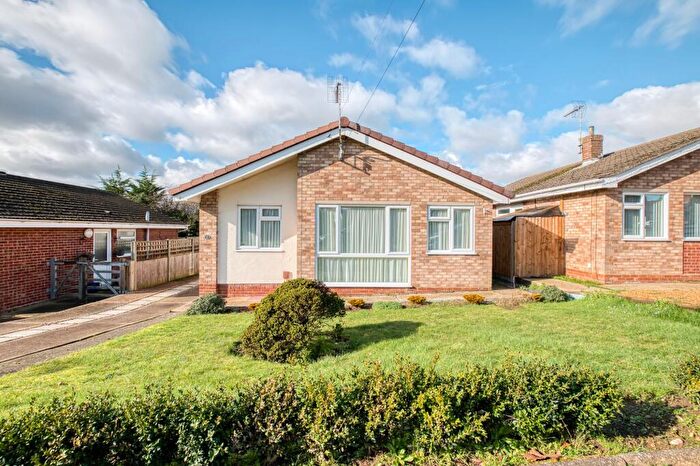
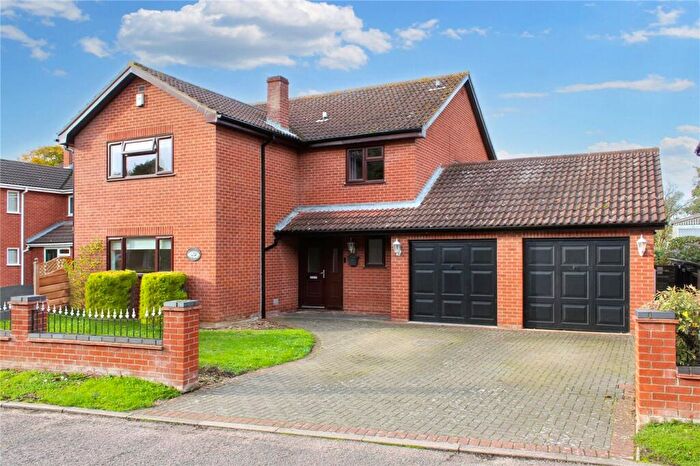
Properties for sale in Lothingland
Roads and Postcodes in Lothingland
Navigate through our locations to find the location of your next house in Lothingland, Lowestoft for sale or to rent.
| Streets | Postcodes |
|---|---|
| Azure Seas Caravan Park | NR32 5JP |
| Back Lane | NR32 5NE |
| Barkis Meadow | NR32 5AL |
| Blacksmiths Loke | NR32 5LS NR32 5PZ |
| Blocka Road | NR32 5ND NR32 5NW |
| Blundeston Road | NR32 5PP NR32 5PR |
| Border Lane | NR32 5EE |
| Brickfields | NR32 5QW |
| Bunkers Hill | NR32 5LY |
| Camps Heath | NR32 5DP NR32 5DW |
| Church Lane | NR32 5LL NR32 5HX |
| Church Road | NR32 5AJ NR32 5AX |
| Coast Road | NR32 5LG NR32 5LQ |
| Copperfield Terrace | NR32 5BP |
| Cuckoo Green | NR32 5NF |
| Dickens Court | NR32 5BA |
| Dorking Road | NR32 5NP |
| Douglas Close | NR32 5JN |
| Earth Lane | NR32 5LN |
| Flixton Marsh Lane | NR32 5PH |
| Flixton Road | NR32 5PD NR32 5PG NR32 5PJ NR32 5PL NR32 5PN NR32 5PQ NR32 5PE NR32 5PF |
| Floral Loke | NR32 5QA |
| Gorleston Road | NR32 5DG |
| Green Lane | NR32 5PW |
| Hall Lane | NR32 5BL NR32 5DL |
| Hall Road | NR32 5BJ |
| Jay Lane | NR32 5LH |
| Lakeside Rise | NR32 5BD NR32 5BE NR32 5BF |
| Lodge Lane | NR32 5ED |
| Lound Road | NR32 5AT NR32 5AU |
| Lowestoft Road | NR32 5BN NR32 5BW |
| Market Lane | NR32 5AN NR32 5AP NR32 5AW |
| Marsh Lane | NR32 5QX |
| Meadowlands | NR32 5AS |
| Micawber Mews | NR32 5BY |
| Morton Peto Close | NR32 5QY |
| Orchard Close | NR32 5AD NR32 5AF |
| Orchard Lane | NR32 5AG |
| Pheasant Drive | NR32 5DY |
| Pickwick Drive | NR32 5BX |
| Pound Lane | NR32 5AY |
| Queens Way | NR32 5BS |
| Rackhams Corner | NR32 5LB |
| Short Road | NR32 5AH |
| Slugs Lane | NR32 5QR |
| St Olaves Road | NR32 5QS NR32 5QT NR32 5QU |
| Staith Lane | NR32 5QP |
| Station Road | NR32 5QL NR32 5QN |
| Stephen George Way | NR32 5DX |
| The Common | NR32 5QJ |
| The Green | NR32 5NS NR32 5PX |
| The Hall | NR32 5QQ |
| The Hedgerows | NR32 5AZ |
| The Loke | NR32 5AR NR32 5PY |
| The Pippins | NR32 5AE |
| The Street | NR32 5AA NR32 5AB NR32 5AQ NR32 5LP NR32 5LR NR32 5LT NR32 5LW NR32 5QB NR32 5HN NR32 5PS NR32 5PT NR32 5PU NR32 5QD |
| Wickfield Close | NR32 5BB |
| Wood Lane | NR32 5DN NR32 5PB NR32 5PA |
| Yarmouth Road | NR32 5LU NR32 5LZ NR32 5DB NR32 5LX NR32 5NL |
| NR32 5LJ NR32 5HR NR32 5NA NR32 5NB NR32 5QE NR32 5QF NR32 5QG NR32 5QH |
Transport near Lothingland
-
Somerleyton Station
-
Oulton Broad North Station
-
Haddiscoe Station
-
Oulton Broad South Station
-
Lowestoft Station
- FAQ
- Price Paid By Year
- Property Type Price
Frequently asked questions about Lothingland
What is the average price for a property for sale in Lothingland?
The average price for a property for sale in Lothingland is £340,551. This amount is 47% higher than the average price in Lowestoft. There are 5,245 property listings for sale in Lothingland.
What streets have the most expensive properties for sale in Lothingland?
The streets with the most expensive properties for sale in Lothingland are Lound Road at an average of £537,500, Dickens Court at an average of £462,500 and Market Lane at an average of £461,000.
What streets have the most affordable properties for sale in Lothingland?
The streets with the most affordable properties for sale in Lothingland are Lakeside Rise at an average of £204,010, Wickfield Close at an average of £241,500 and Church Road at an average of £249,166.
Which train stations are available in or near Lothingland?
Some of the train stations available in or near Lothingland are Somerleyton, Oulton Broad North and Haddiscoe.
Property Price Paid in Lothingland by Year
The average sold property price by year was:
| Year | Average Sold Price | Price Change |
Sold Properties
|
|---|---|---|---|
| 2025 | £317,020 | -13% |
24 Properties |
| 2024 | £357,309 | 3% |
26 Properties |
| 2023 | £345,000 | -1% |
29 Properties |
| 2022 | £348,723 | 6% |
38 Properties |
| 2021 | £327,564 | -1% |
39 Properties |
| 2020 | £330,178 | 17% |
33 Properties |
| 2019 | £273,303 | -6% |
33 Properties |
| 2018 | £289,219 | -5% |
31 Properties |
| 2017 | £304,825 | 11% |
36 Properties |
| 2016 | £271,141 | 27% |
39 Properties |
| 2015 | £197,020 | -24% |
34 Properties |
| 2014 | £244,051 | 26% |
25 Properties |
| 2013 | £180,560 | -39% |
23 Properties |
| 2012 | £250,293 | 17% |
22 Properties |
| 2011 | £208,154 | 7% |
19 Properties |
| 2010 | £192,758 | 6% |
28 Properties |
| 2009 | £180,673 | -15% |
27 Properties |
| 2008 | £207,562 | 5% |
16 Properties |
| 2007 | £196,897 | -14% |
32 Properties |
| 2006 | £224,224 | -3% |
31 Properties |
| 2005 | £229,985 | 19% |
25 Properties |
| 2004 | £185,661 | 17% |
42 Properties |
| 2003 | £153,240 | 20% |
32 Properties |
| 2002 | £122,504 | 10% |
36 Properties |
| 2001 | £110,145 | 19% |
36 Properties |
| 2000 | £89,210 | 5% |
41 Properties |
| 1999 | £84,792 | 17% |
51 Properties |
| 1998 | £70,794 | -13% |
37 Properties |
| 1997 | £79,680 | 19% |
41 Properties |
| 1996 | £64,331 | 2% |
32 Properties |
| 1995 | £62,723 | - |
36 Properties |
Property Price per Property Type in Lothingland
Here you can find historic sold price data in order to help with your property search.
The average Property Paid Price for specific property types in the last three years are:
| Property Type | Average Sold Price | Sold Properties |
|---|---|---|
| Semi Detached House | £295,892.00 | 32 Semi Detached Houses |
| Detached House | £448,533.00 | 30 Detached Houses |
| Terraced House | £258,071.00 | 14 Terraced Houses |
| Flat | £122,000.00 | 3 Flats |

