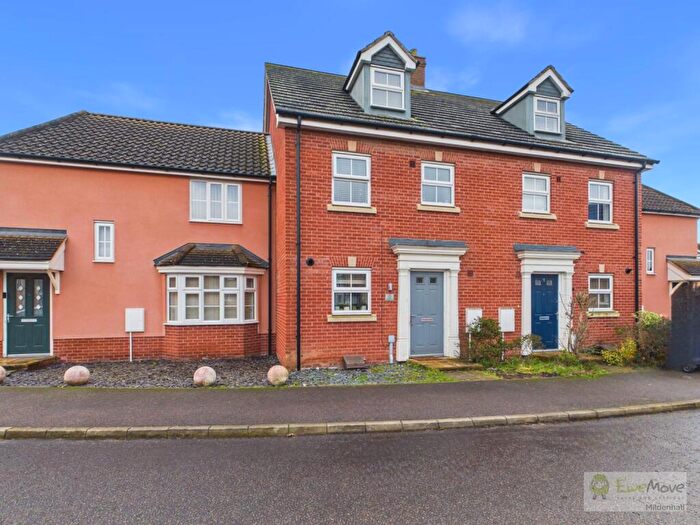
Houses for sale & to rent in South, Newmarket
House Prices in South
Properties in South have an average house price of £459,000.00 and had 75 Property Transactions within the last 3 years¹.
South is an area in Newmarket, Suffolk with 663 households², where the most expensive property was sold for £1,330,000.00.
Properties for sale in South
Roads and Postcodes in South
Navigate through our locations to find the location of your next house in South, Newmarket for sale or to rent.
| Streets | Postcodes |
|---|---|
| Anvil Way | CB8 8GY |
| Benefield Road | CB8 8SW |
| Bridge Street | CB8 8SP |
| Brookside | CB8 8SG CB8 8TG |
| Bury Road | CB8 7PR CB8 7PT CB8 7PY CB8 7PZ |
| Cheveley Road | CB8 8WF |
| Chippenham Road | CB8 8SN |
| Church Lane | CB8 8TE |
| Church Road | CB8 8SF |
| Clifton Mews | CB8 7FF |
| Dalham Road | CB8 8SB |
| Denham Road | CB8 8UB |
| Dunstall Green | CB8 8TZ |
| Edgeborough Close | CB8 8QY |
| Gazeley Road | CB8 7QA CB8 8SR |
| Herringswell Road | CB8 7QR CB8 7QS |
| Jeddah Way | CB8 8JY |
| Kennett Park Close | CB8 8QU |
| Kennett Road | CB8 8QR |
| Kentford Paddocks | CB8 7RB |
| Lark Hill | CB8 8RT |
| Lidgate Road | CB8 8TH CB8 8TJ |
| Maltings Close | CB8 8ST |
| Mayes Meadow | CB8 8SZ |
| Milburn Drove | CB8 8QW |
| Moulton Avenue | CB8 8QX |
| Moulton Road | CB8 7PX CB8 8QN CB8 8QT |
| Newmarket Road | CB8 8QP CB8 8SS |
| Orchard Place | CB8 7FE |
| Paddock Wood | CB8 8HL |
| Park Close | CB8 8SL |
| Riverside Walk | CB8 8WE |
| St Peters Avenue | CB8 8SE |
| St Peters Close | CB8 8SD |
| Stores Hill | CB8 8TQ |
| The Green | CB8 8SQ |
| The Street | CB8 8RZ CB8 8TF |
| Tweed Close | CB8 8SU |
Transport near South
- FAQ
- Price Paid By Year
- Property Type Price
Frequently asked questions about South
What is the average price for a property for sale in South?
The average price for a property for sale in South is £459,000. This amount is 34% higher than the average price in Newmarket. There are 784 property listings for sale in South.
What streets have the most expensive properties for sale in South?
The streets with the most expensive properties for sale in South are Brookside at an average of £990,000, Kennett Park Close at an average of £900,000 and Park Close at an average of £750,000.
What streets have the most affordable properties for sale in South?
The streets with the most affordable properties for sale in South are Bury Road at an average of £232,500, Herringswell Road at an average of £255,000 and Anvil Way at an average of £261,714.
Which train stations are available in or near South?
Some of the train stations available in or near South are Kennett, Newmarket and Dullingham.
Property Price Paid in South by Year
The average sold property price by year was:
| Year | Average Sold Price | Price Change |
Sold Properties
|
|---|---|---|---|
| 2025 | £523,211 | 17% |
26 Properties |
| 2024 | £434,428 | 8% |
35 Properties |
| 2023 | £401,178 | -32% |
14 Properties |
| 2022 | £528,892 | 24% |
28 Properties |
| 2021 | £403,062 | -6% |
40 Properties |
| 2020 | £427,247 | 14% |
19 Properties |
| 2019 | £368,562 | 2% |
24 Properties |
| 2018 | £359,388 | -11% |
27 Properties |
| 2017 | £399,997 | 3% |
36 Properties |
| 2016 | £386,872 | 6% |
43 Properties |
| 2015 | £363,825 | -9% |
36 Properties |
| 2014 | £395,967 | 24% |
43 Properties |
| 2013 | £300,373 | 12% |
41 Properties |
| 2012 | £264,263 | 5% |
40 Properties |
| 2011 | £251,007 | -8% |
48 Properties |
| 2010 | £269,855 | 8% |
38 Properties |
| 2009 | £247,390 | -35% |
23 Properties |
| 2008 | £333,029 | -3% |
17 Properties |
| 2007 | £341,704 | 9% |
22 Properties |
| 2006 | £309,340 | 9% |
47 Properties |
| 2005 | £280,270 | -20% |
30 Properties |
| 2004 | £336,187 | 37% |
35 Properties |
| 2003 | £212,731 | 2% |
37 Properties |
| 2002 | £208,301 | 13% |
28 Properties |
| 2001 | £180,260 | 6% |
40 Properties |
| 2000 | £168,737 | 16% |
31 Properties |
| 1999 | £142,409 | 23% |
31 Properties |
| 1998 | £109,428 | 3% |
40 Properties |
| 1997 | £105,926 | 8% |
34 Properties |
| 1996 | £97,316 | 13% |
30 Properties |
| 1995 | £85,018 | - |
27 Properties |
Property Price per Property Type in South
Here you can find historic sold price data in order to help with your property search.
The average Property Paid Price for specific property types in the last three years are:
| Property Type | Average Sold Price | Sold Properties |
|---|---|---|
| Semi Detached House | £345,136.00 | 22 Semi Detached Houses |
| Detached House | £566,000.00 | 43 Detached Houses |
| Terraced House | £292,750.00 | 8 Terraced Houses |
| Flat | £76,000.00 | 2 Flats |

