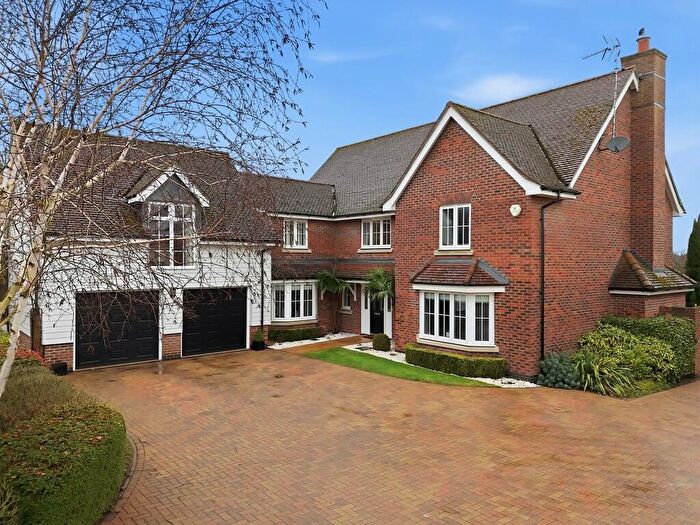
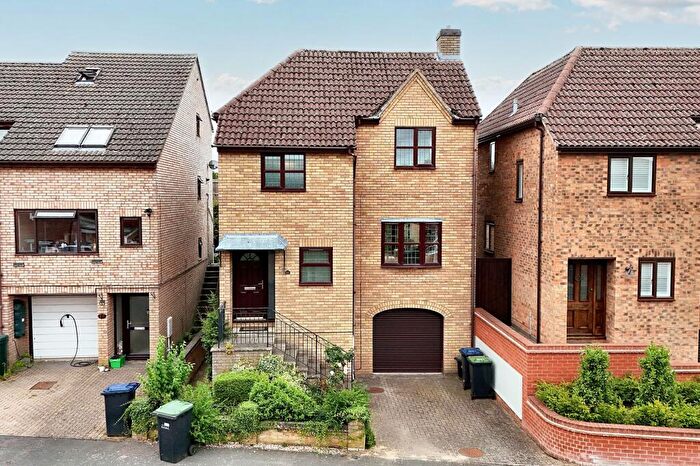
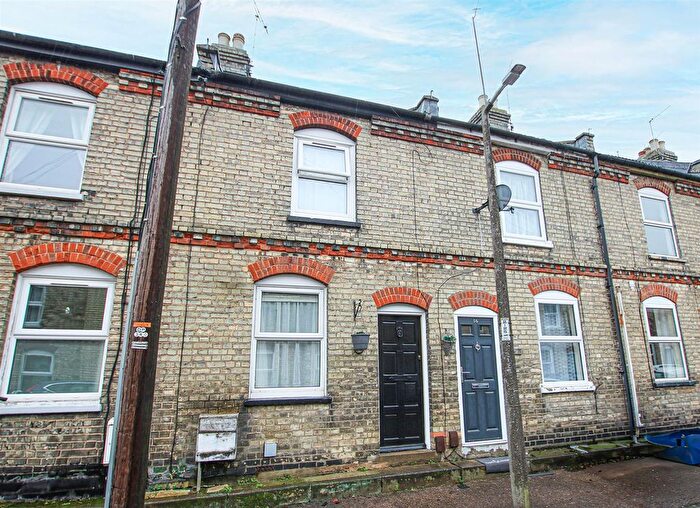
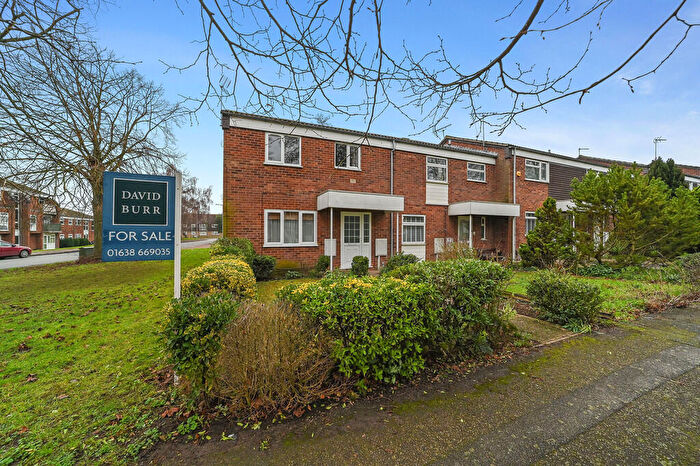
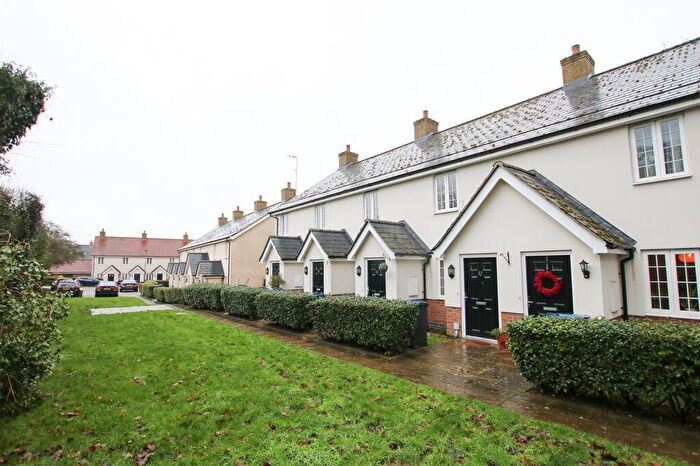
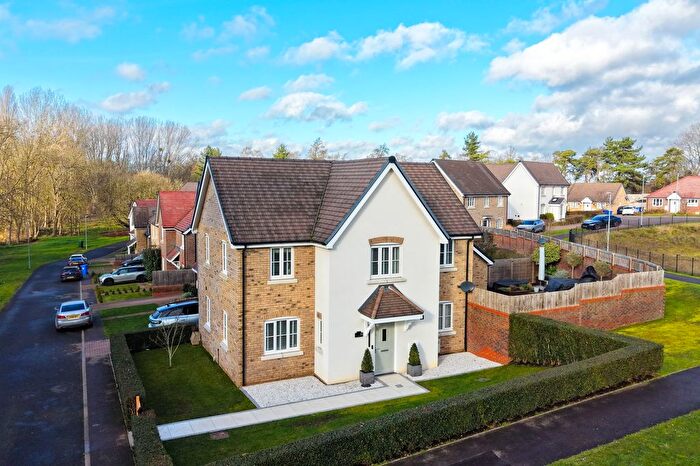
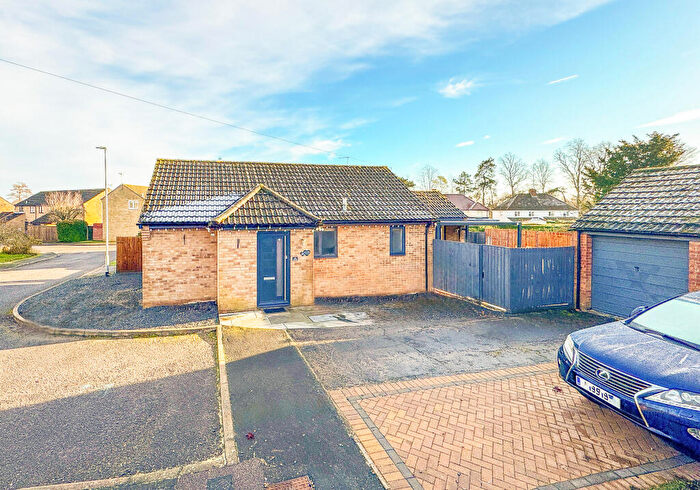
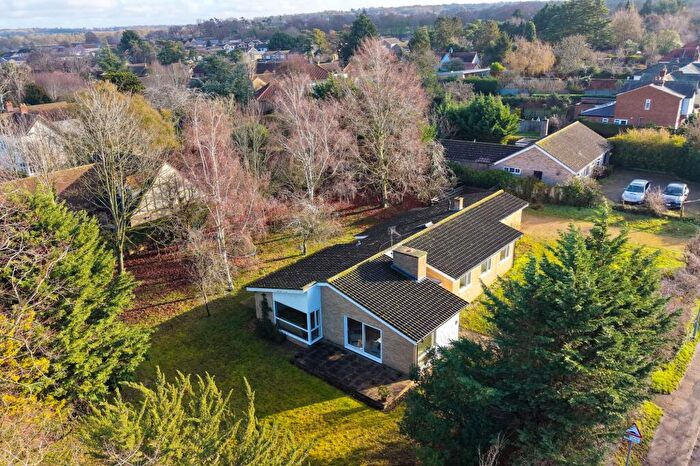
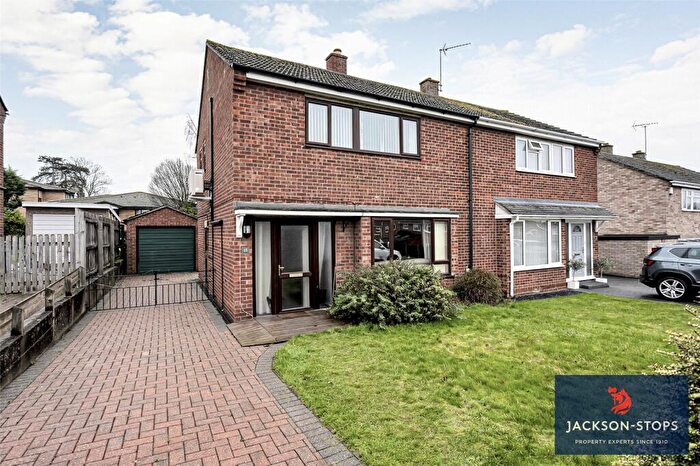
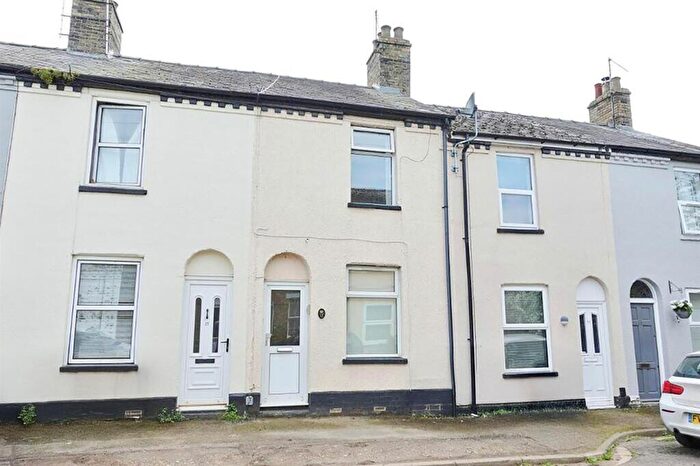
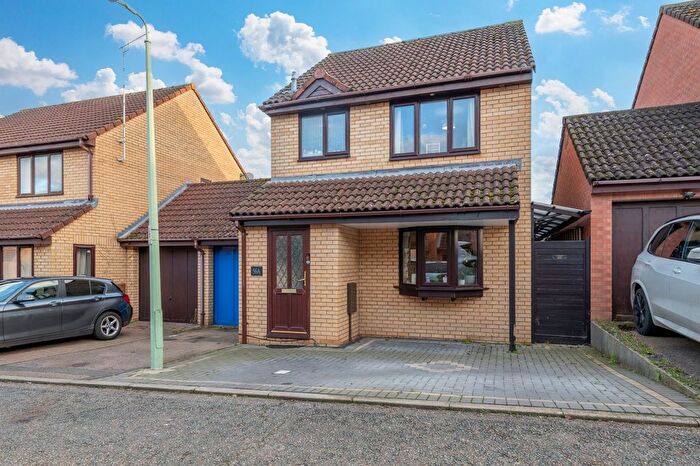
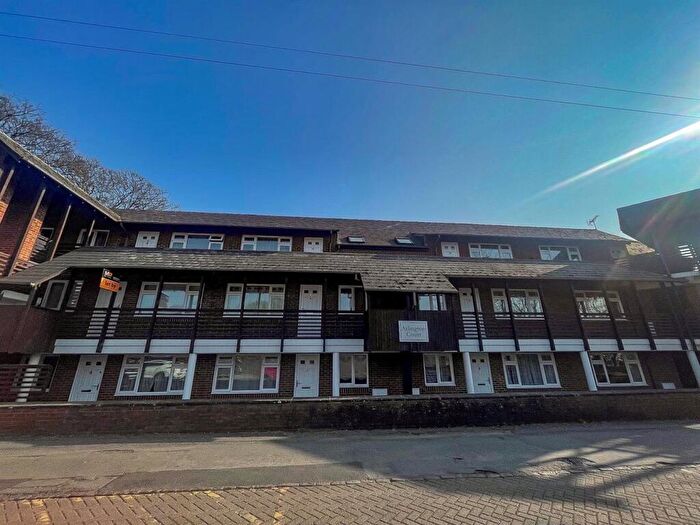
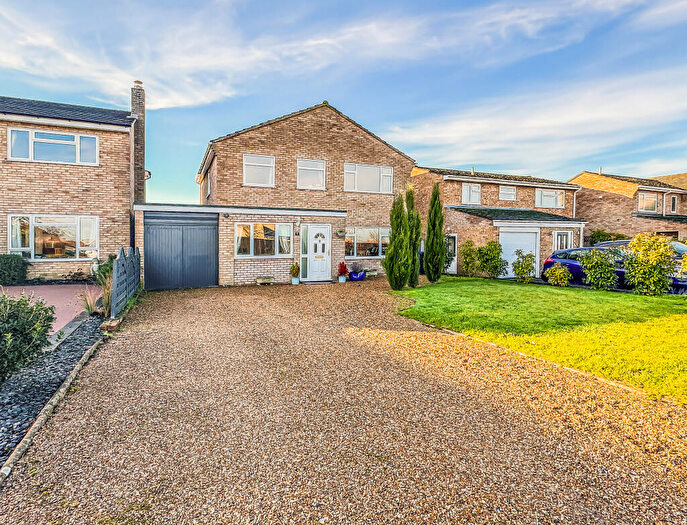
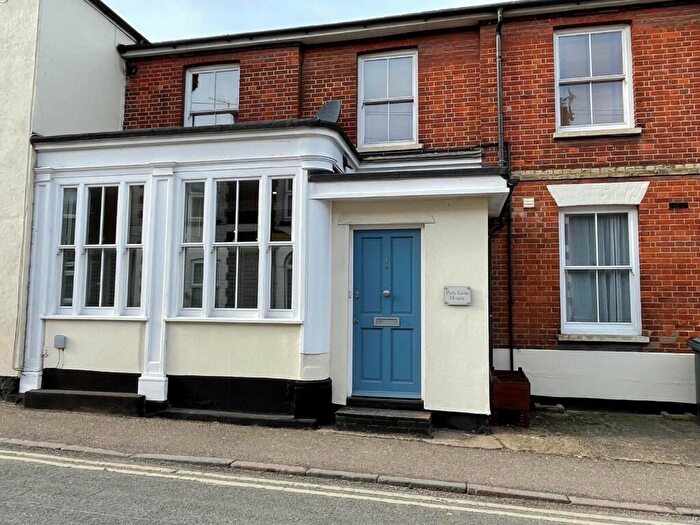
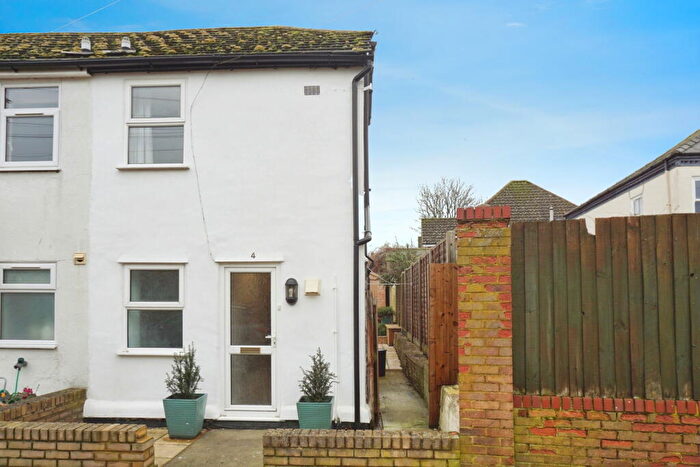
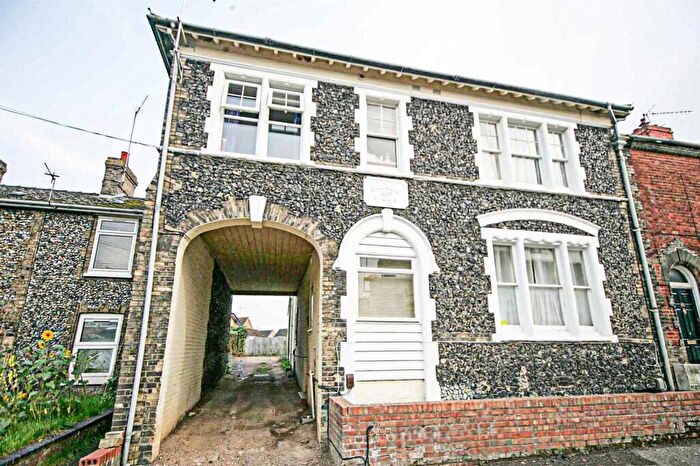
Houses for sale & to rent in Cheveley, Newmarket
House Prices in Cheveley
Properties in Cheveley have an average house price of £479,899.00 and had 151 Property Transactions within the last 3 years¹.
Cheveley is an area in Newmarket, Cambridgeshire with 1,645 households², where the most expensive property was sold for £1,500,000.00.
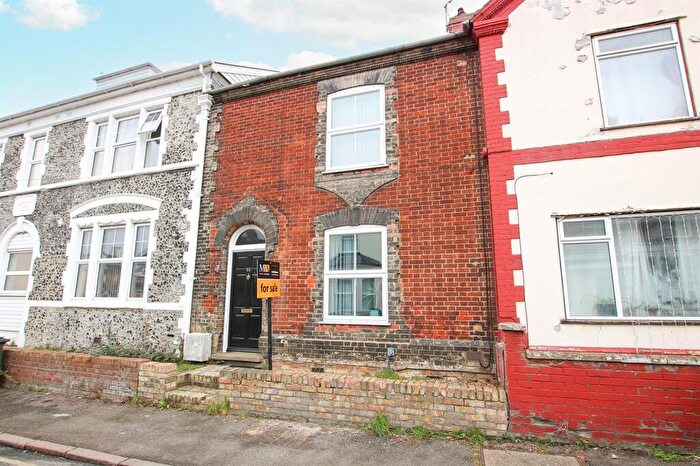
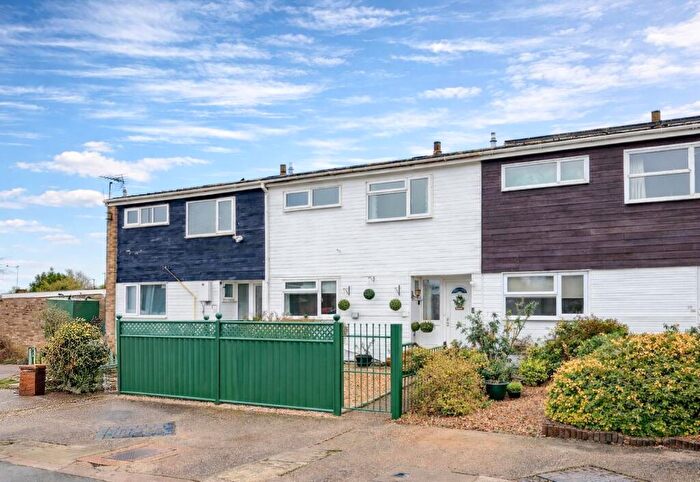
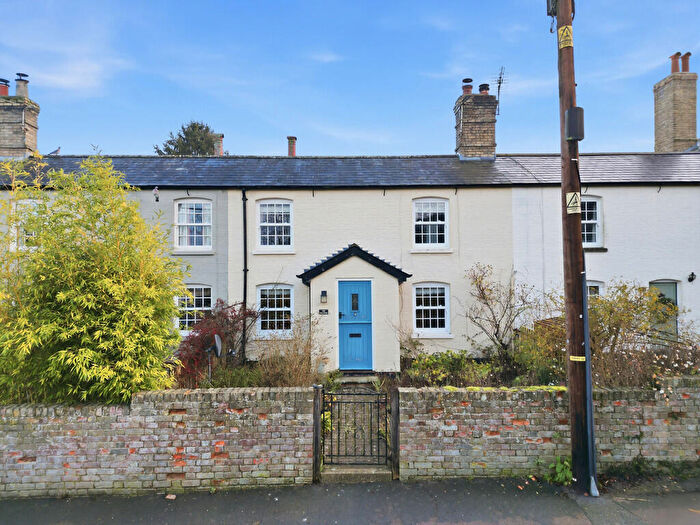
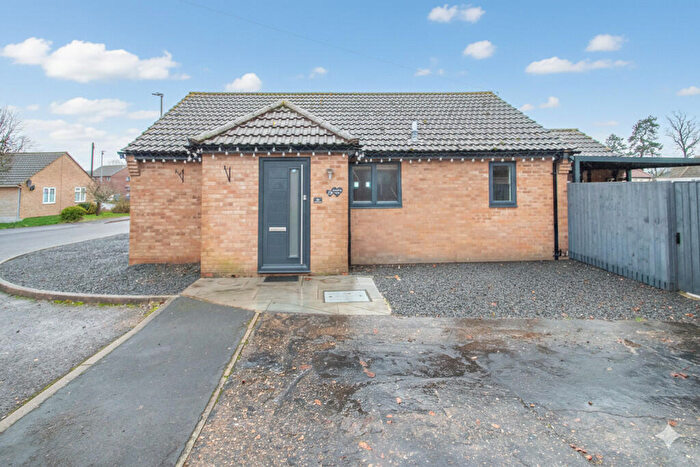
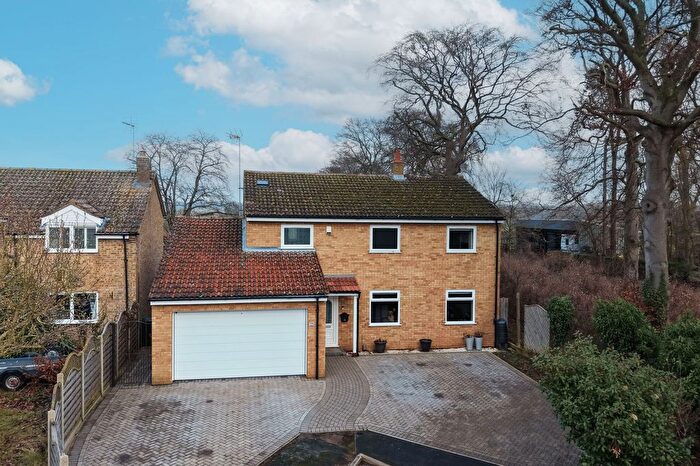
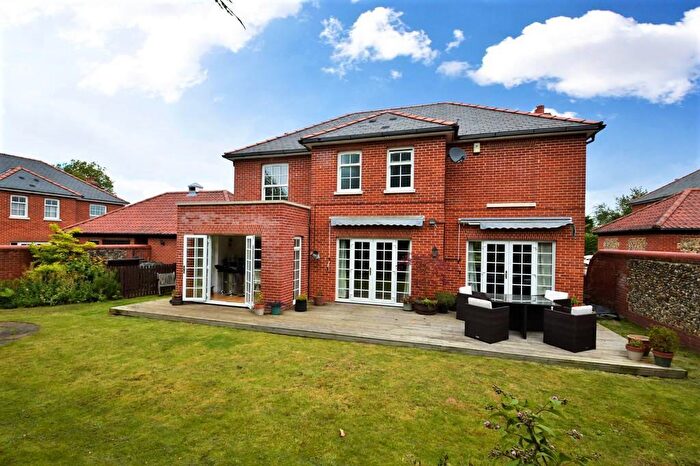
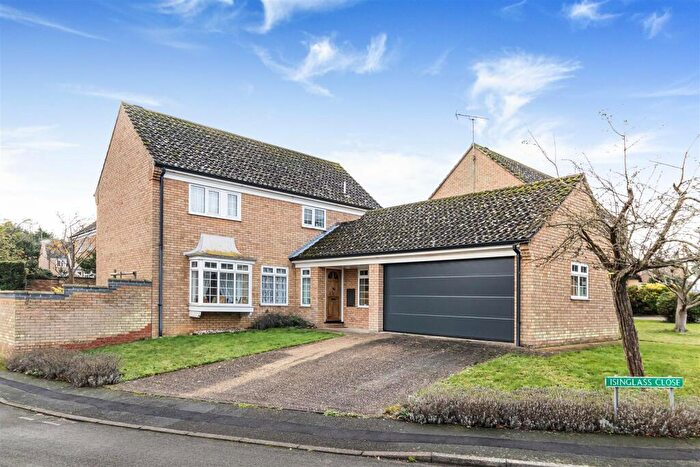
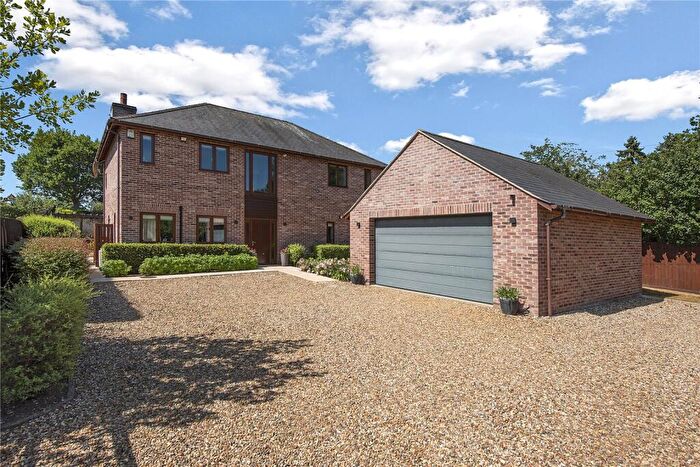
Properties for sale in Cheveley
Roads and Postcodes in Cheveley
Navigate through our locations to find the location of your next house in Cheveley, Newmarket for sale or to rent.
| Streets | Postcodes |
|---|---|
| Ashley Road | CB8 8DA CB8 8DB CB8 9DP |
| Bradley Road | CB8 9JB |
| Broad Green | CB8 9RD CB8 9RE |
| Centre Drive | CB8 8AN CB8 8AP CB8 8AW |
| Chapel Row | CB8 9ED |
| Cheveley Park | CB8 9DE |
| Church Lane | CB8 9DJ |
| Church Street | CB8 9DU |
| Church Terrace | CB8 9DH |
| Clare Place | CB8 8BH |
| Coach Lane | CB8 9ST |
| Cowlinge Road | CB8 9HL CB8 9WA |
| Crockfords Road | CB8 9BG |
| Dalham Road | CB8 8RQ CB8 9EG |
| Darwin Place | CB8 8DF |
| Ditton Close | CB8 8XE |
| Downing Close | CB8 8AU |
| Duchess Drive | CB8 8AG CB8 8AJ CB8 8AL CB8 8AQ CB8 9HB |
| Gazeley Road | CB8 9EF |
| Girton Close | CB8 8DQ |
| High Street | CB8 9DG CB8 9DQ CB8 9DX CB8 9RH |
| Holland Park | CB8 9DL |
| Home Office Bungalows | CB8 9RQ |
| Icknield Close | CB8 9SU |
| Isinglass Close | CB8 8HX |
| Kings Drive | CB8 8DG |
| Kings Mead | CB8 9EP |
| Little Green | CB8 9RG |
| Malting End | CB8 9PE |
| Malvern Close | CB8 8BP |
| Mccalmont Way | CB8 8HU |
| Meadow Lane | CB8 8FZ |
| Mill Road | CB8 9EE CB8 9HJ |
| Moulton Road | CB8 8QG CB8 9DN CB8 9DW |
| New Cheveley Road | CB8 8BG CB8 8BS |
| New Cottages | CB8 9PJ |
| Newmarket Road | CB8 9DR CB8 9EQ CB8 9HQ CB8 9PA |
| Oak Lane | CB8 9RA |
| Park Road | CB8 9DF |
| Pembroke Close | CB8 8BQ |
| Peterhouse Drive | CB8 8AT |
| Robin Hatch | CB8 9DT |
| Saxon Street Road | CB8 9RB |
| Selwyn Close | CB8 8DD |
| Silhalls Close | CB8 9DZ |
| Silverley Way | CB8 9DY |
| Spurling Close | CB8 9RJ |
| St Johns Avenue | CB8 8BL CB8 8DE |
| Star & Garter Lane | CB8 9EW |
| Stretton Avenue | CB8 8BN |
| Stretton Gardens | CB8 8FX |
| The Dip | CB8 8AH |
| The Green | CB8 9EB |
| The Millers | CB8 9DS |
| The Orchard | CB8 9EA |
| The Shrubberies | CB8 8JD |
| The Street | CB8 9PB CB8 9PD |
| Trinity Drive | CB8 8BJ |
| Upend | CB8 9PH |
| Woodditton Road | CB8 9BQ CB8 9PG |
| CB8 8PA |
Transport near Cheveley
- FAQ
- Price Paid By Year
- Property Type Price
Frequently asked questions about Cheveley
What is the average price for a property for sale in Cheveley?
The average price for a property for sale in Cheveley is £479,899. This amount is 4% lower than the average price in Newmarket. There are 1,225 property listings for sale in Cheveley.
What streets have the most expensive properties for sale in Cheveley?
The streets with the most expensive properties for sale in Cheveley are Duchess Drive at an average of £654,923, Ditton Close at an average of £637,500 and The Dip at an average of £620,000.
What streets have the most affordable properties for sale in Cheveley?
The streets with the most affordable properties for sale in Cheveley are The Green at an average of £276,625, Icknield Close at an average of £290,625 and New Cheveley Road at an average of £324,312.
Which train stations are available in or near Cheveley?
Some of the train stations available in or near Cheveley are Newmarket, Dullingham and Kennett.
Property Price Paid in Cheveley by Year
The average sold property price by year was:
| Year | Average Sold Price | Price Change |
Sold Properties
|
|---|---|---|---|
| 2025 | £448,812 | -14% |
40 Properties |
| 2024 | £511,897 | 7% |
50 Properties |
| 2023 | £474,056 | 3% |
61 Properties |
| 2022 | £461,369 | 10% |
68 Properties |
| 2021 | £413,321 | -1% |
91 Properties |
| 2020 | £416,152 | 6% |
55 Properties |
| 2019 | £392,245 | 4% |
63 Properties |
| 2018 | £378,244 | -10% |
56 Properties |
| 2017 | £416,795 | 12% |
61 Properties |
| 2016 | £368,322 | 1% |
72 Properties |
| 2015 | £365,593 | 3% |
71 Properties |
| 2014 | £353,306 | 16% |
61 Properties |
| 2013 | £296,559 | -2% |
62 Properties |
| 2012 | £303,950 | 2% |
52 Properties |
| 2011 | £298,748 | -3% |
50 Properties |
| 2010 | £308,606 | -10% |
65 Properties |
| 2009 | £340,838 | -27% |
81 Properties |
| 2008 | £433,895 | 24% |
70 Properties |
| 2007 | £330,560 | 24% |
93 Properties |
| 2006 | £250,759 | -22% |
81 Properties |
| 2005 | £305,143 | 25% |
78 Properties |
| 2004 | £228,457 | -12% |
79 Properties |
| 2003 | £255,203 | 16% |
80 Properties |
| 2002 | £213,287 | 26% |
78 Properties |
| 2001 | £158,604 | -6% |
97 Properties |
| 2000 | £167,687 | 27% |
78 Properties |
| 1999 | £123,240 | 22% |
82 Properties |
| 1998 | £95,795 | -1% |
73 Properties |
| 1997 | £97,122 | 10% |
76 Properties |
| 1996 | £87,511 | 1% |
66 Properties |
| 1995 | £86,713 | - |
52 Properties |
Property Price per Property Type in Cheveley
Here you can find historic sold price data in order to help with your property search.
The average Property Paid Price for specific property types in the last three years are:
| Property Type | Average Sold Price | Sold Properties |
|---|---|---|
| Semi Detached House | £374,516.00 | 30 Semi Detached Houses |
| Detached House | £576,351.00 | 92 Detached Houses |
| Terraced House | £321,094.00 | 21 Terraced Houses |
| Flat | £182,750.00 | 8 Flats |

