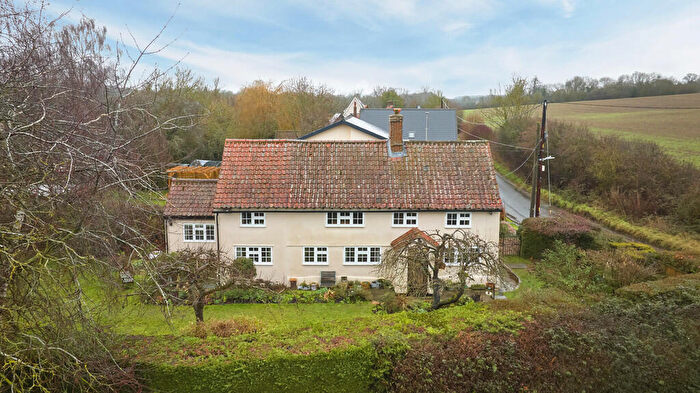
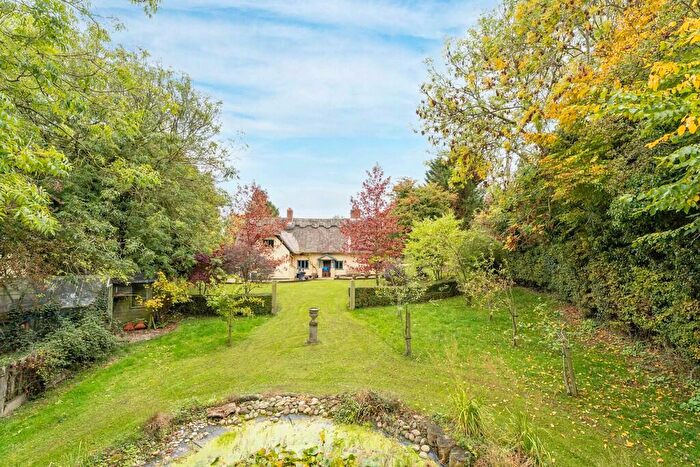
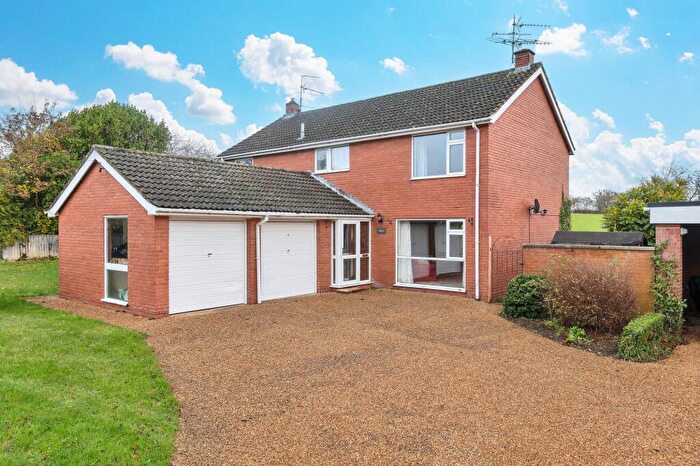
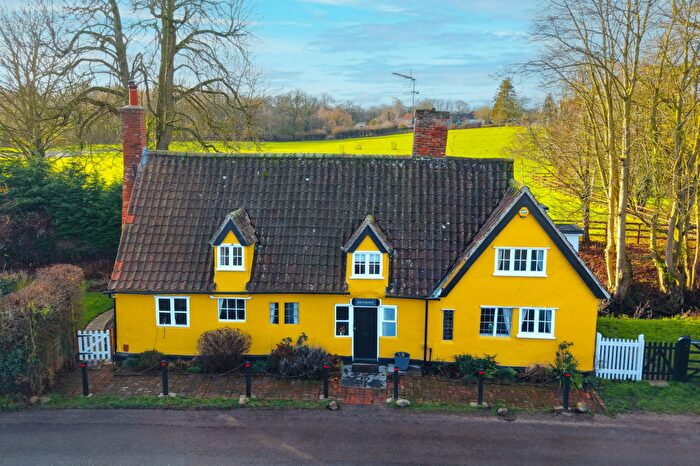
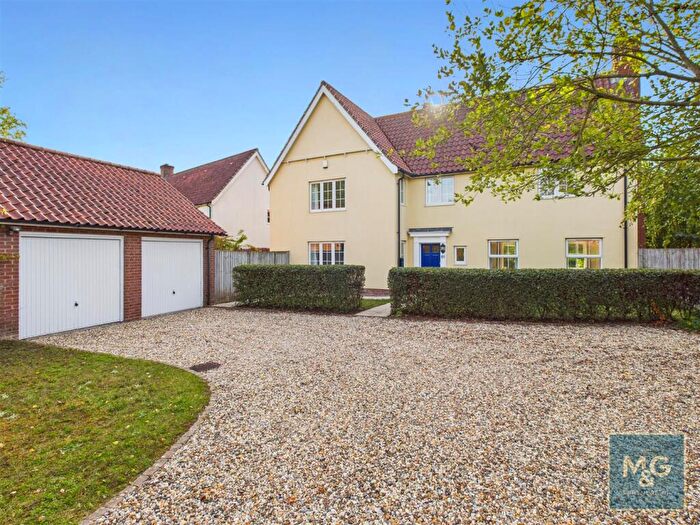
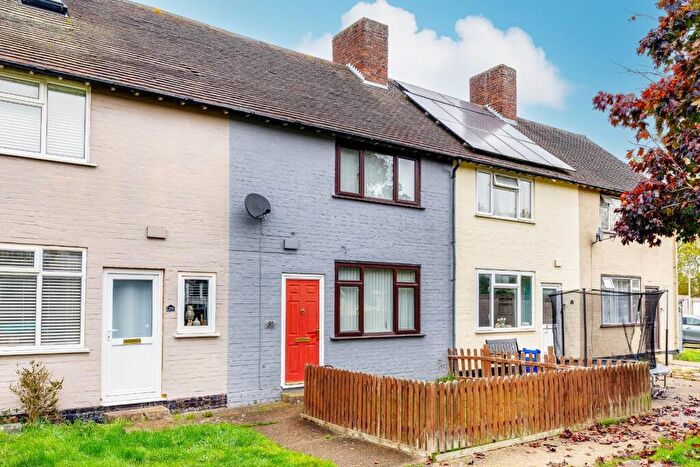
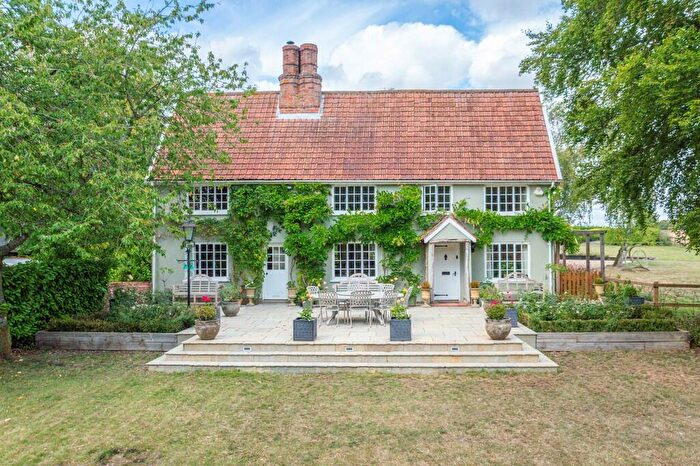
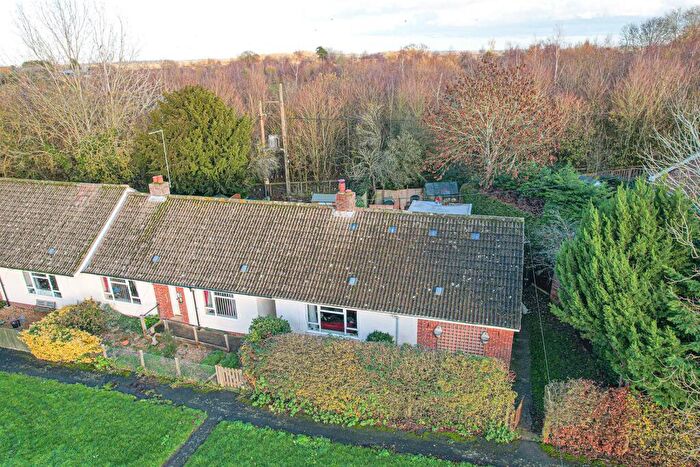
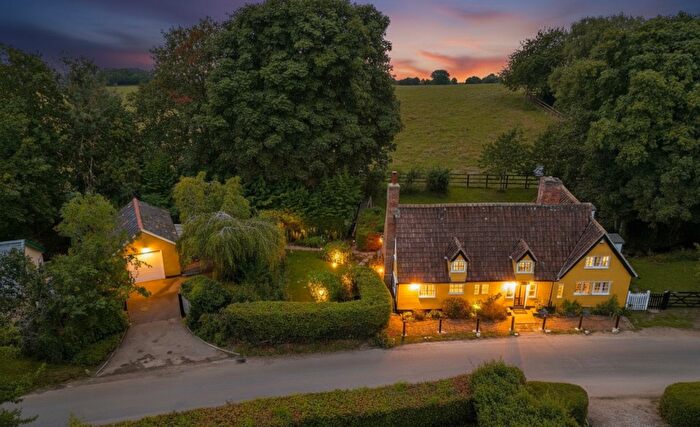
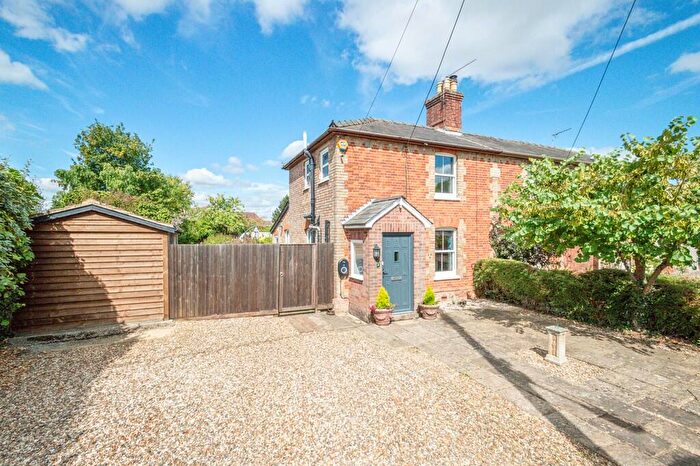
Houses for sale & to rent in Wickhambrook, Newmarket
House Prices in Wickhambrook
Properties in Wickhambrook have an average house price of £519,610.00 and had 50 Property Transactions within the last 3 years¹.
Wickhambrook is an area in Newmarket, Suffolk with 677 households², where the most expensive property was sold for £1,850,000.00.
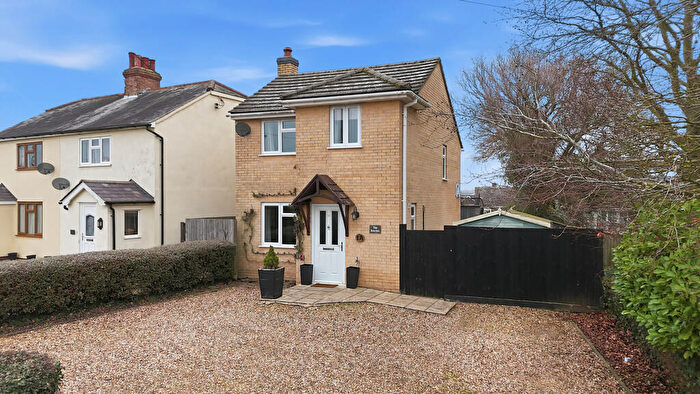
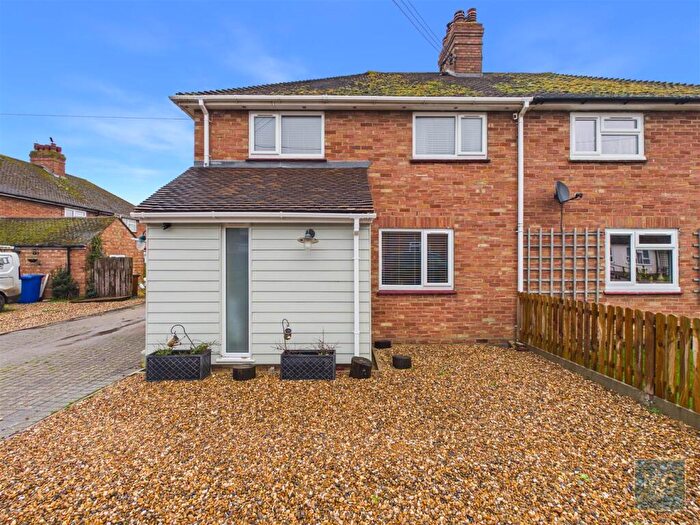
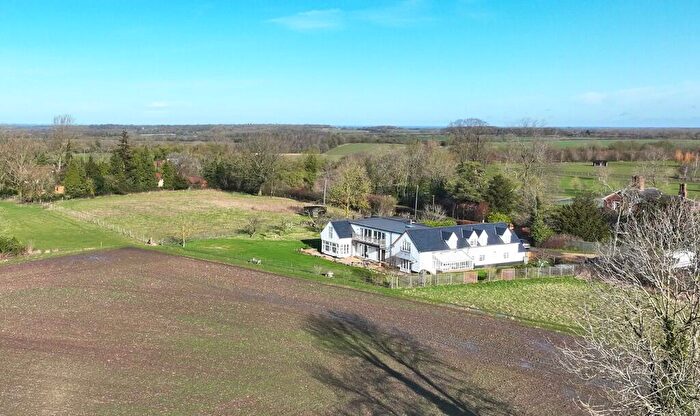
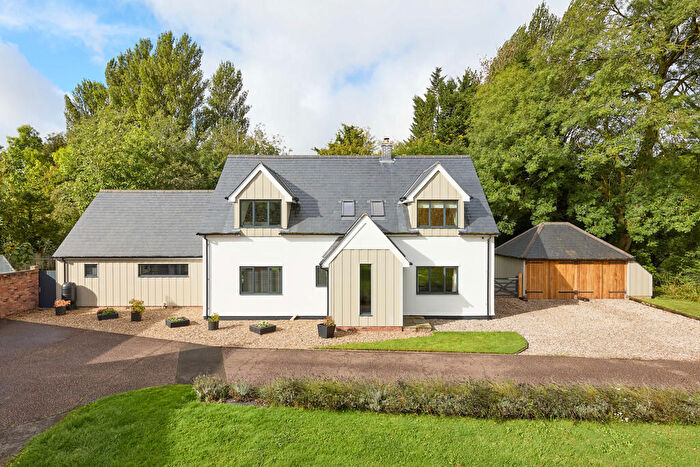
Properties for sale in Wickhambrook
Previously listed properties in Wickhambrook
Roads and Postcodes in Wickhambrook
Navigate through our locations to find the location of your next house in Wickhambrook, Newmarket for sale or to rent.
| Streets | Postcodes |
|---|---|
| Ashfield Green | CB8 8UZ |
| Attleton Green | CB8 8YA CB8 8YB |
| Baxters Green | CB8 8UY |
| Boyden Close | CB8 8XU |
| Boyden End | CB8 8XX |
| Browns Close | CB8 8YF |
| Bunters Road | CB8 8XY |
| Bury Lane | CB8 9PX |
| Bury Road | CB8 8PD |
| Cemetery Road | CB8 8XR |
| Church Hill | CB8 9PT |
| Church Road | CB8 8XH |
| Cloak Lane | CB8 8UJ |
| Clopton | CB8 8PF |
| Clopton Park | CB8 8ND CB8 8PE |
| Coltsfoot Close | CB8 8UP |
| Coltsfoot Green | CB8 8UW |
| Cowlinge Corner | CB8 9PN |
| Croft Close | CB8 8YG |
| Cropley Grove | CB8 8TL |
| Cutbush | CB8 8XN |
| Dunstall Green Road | CB8 8TY |
| Genesis Green | CB8 8UX |
| Giffords Lane | CB8 8PQ |
| Hill View | CB8 9PY |
| Ladys Green | CB8 8TU |
| Lords Lane | CB8 8TX |
| Malting End | CB8 8QA CB8 8YH |
| Meeting Green | CB8 8UR CB8 8XS |
| Moor Green Close | CB8 8WR |
| Nunnery Green | CB8 8XT |
| Pitts Terrace | CB8 9PR |
| Post Office Hill | CB8 8UH |
| Rectory Close | CB8 8UD |
| Rockall | CB8 8TP |
| Shop Hill | CB8 8XL |
| The Belt | CB8 9PZ |
| The Duddery | CB8 8UN |
| The Street | CB8 9PP CB8 9PW |
| Thorns Close | CB8 8YD |
| Thorns Corner | CB8 8XW |
| Victoria Cottages | CB8 8YE |
| Wash Lane | CB8 8XQ |
| Wickham House Bungalows | CB8 8PH |
| Wickham Street | CB8 8XJ |
| CB8 8TN CB8 8TR CB8 8TS CB8 8TT CB8 8TW CB8 8UL CB8 8UT |
Transport near Wickhambrook
- FAQ
- Price Paid By Year
- Property Type Price
Frequently asked questions about Wickhambrook
What is the average price for a property for sale in Wickhambrook?
The average price for a property for sale in Wickhambrook is £519,610. This amount is 52% higher than the average price in Newmarket. There are 207 property listings for sale in Wickhambrook.
What streets have the most expensive properties for sale in Wickhambrook?
The streets with the most expensive properties for sale in Wickhambrook are Giffords Lane at an average of £1,850,000, The Street at an average of £908,750 and Ashfield Green at an average of £901,000.
What streets have the most affordable properties for sale in Wickhambrook?
The streets with the most affordable properties for sale in Wickhambrook are Pitts Terrace at an average of £228,500, Nunnery Green at an average of £275,000 and Boyden Close at an average of £277,000.
Which train stations are available in or near Wickhambrook?
Some of the train stations available in or near Wickhambrook are Kennett, Newmarket and Dullingham.
Property Price Paid in Wickhambrook by Year
The average sold property price by year was:
| Year | Average Sold Price | Price Change |
Sold Properties
|
|---|---|---|---|
| 2025 | £569,230 | 31% |
13 Properties |
| 2024 | £393,623 | -51% |
17 Properties |
| 2023 | £594,447 | -4% |
20 Properties |
| 2022 | £618,272 | 22% |
22 Properties |
| 2021 | £482,040 | -7% |
30 Properties |
| 2020 | £518,142 | 15% |
19 Properties |
| 2019 | £439,595 | -6% |
21 Properties |
| 2018 | £463,815 | -5% |
19 Properties |
| 2017 | £487,300 | 20% |
13 Properties |
| 2016 | £392,134 | -22% |
26 Properties |
| 2015 | £477,625 | 30% |
24 Properties |
| 2014 | £334,580 | -18% |
36 Properties |
| 2013 | £395,025 | 17% |
30 Properties |
| 2012 | £329,602 | 16% |
19 Properties |
| 2011 | £276,500 | -14% |
14 Properties |
| 2010 | £314,497 | -8% |
17 Properties |
| 2009 | £339,118 | -7% |
21 Properties |
| 2008 | £363,262 | 19% |
19 Properties |
| 2007 | £294,868 | -2% |
34 Properties |
| 2006 | £299,414 | 5% |
31 Properties |
| 2005 | £285,738 | 7% |
22 Properties |
| 2004 | £266,642 | 13% |
26 Properties |
| 2003 | £230,843 | 4% |
38 Properties |
| 2002 | £221,708 | 22% |
40 Properties |
| 2001 | £172,867 | 17% |
25 Properties |
| 2000 | £143,796 | 6% |
32 Properties |
| 1999 | £135,351 | -4% |
38 Properties |
| 1998 | £140,408 | 18% |
34 Properties |
| 1997 | £115,827 | 31% |
35 Properties |
| 1996 | £80,100 | -6% |
19 Properties |
| 1995 | £84,902 | - |
21 Properties |
Property Price per Property Type in Wickhambrook
Here you can find historic sold price data in order to help with your property search.
The average Property Paid Price for specific property types in the last three years are:
| Property Type | Average Sold Price | Sold Properties |
|---|---|---|
| Semi Detached House | £316,412.00 | 16 Semi Detached Houses |
| Detached House | £639,404.00 | 32 Detached Houses |
| Terraced House | £228,500.00 | 2 Terraced Houses |

