
Houses for sale & to rent in Wickhambrook, Bury St Edmunds
House Prices in Wickhambrook
Properties in Wickhambrook have an average house price of £529k and had 11 Property Transactions within the last 3 years¹.
Wickhambrook is an area in Bury St Edmunds, Suffolk with 177 households², where the most expensive property was sold for £890k.
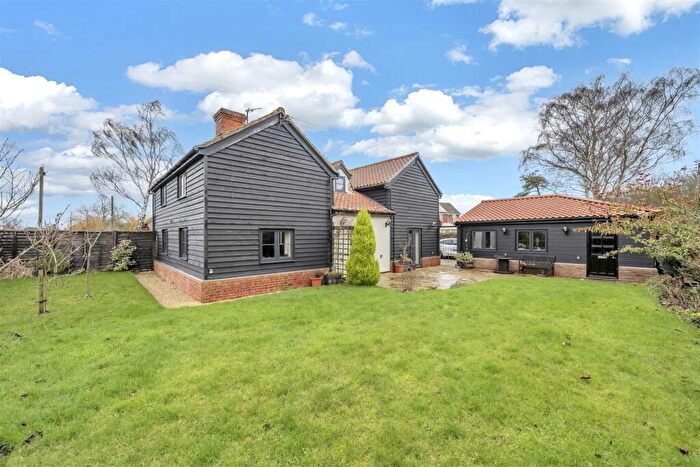
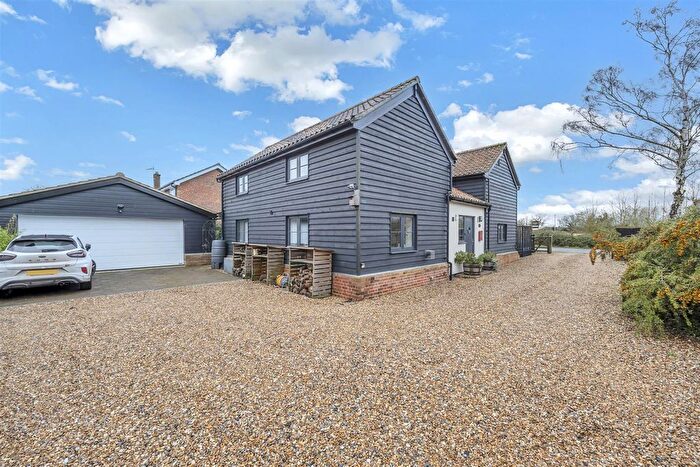
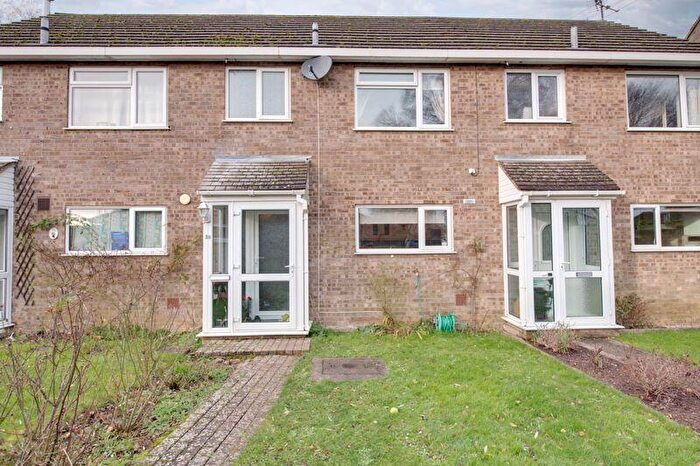
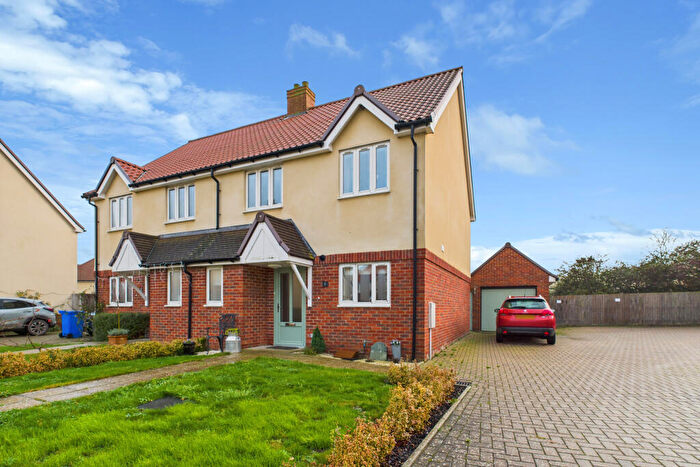
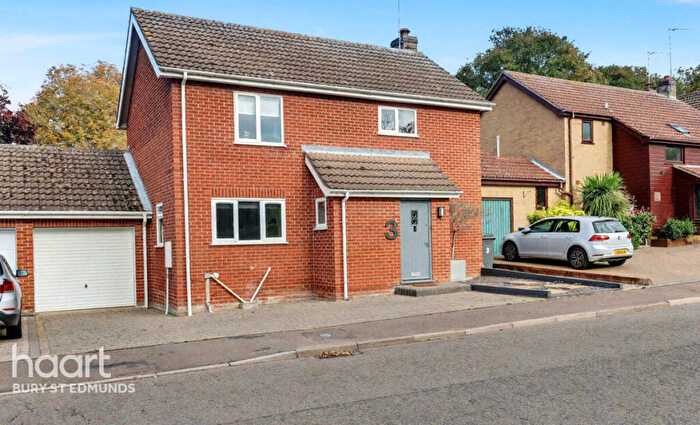
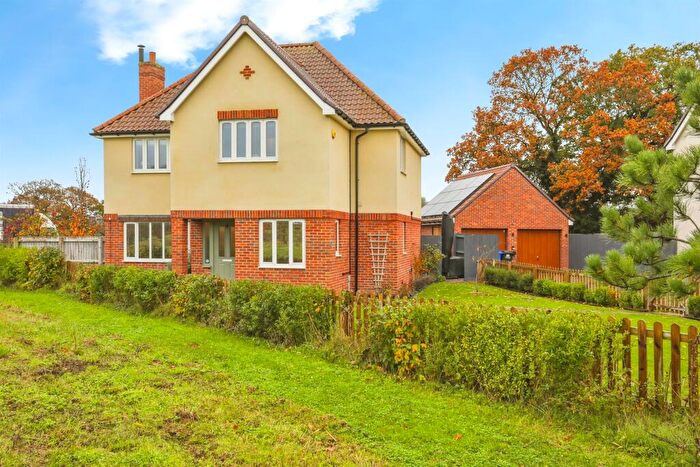
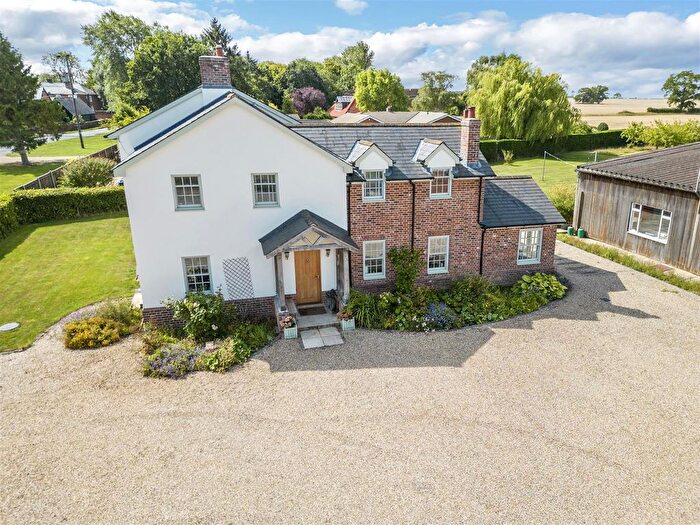
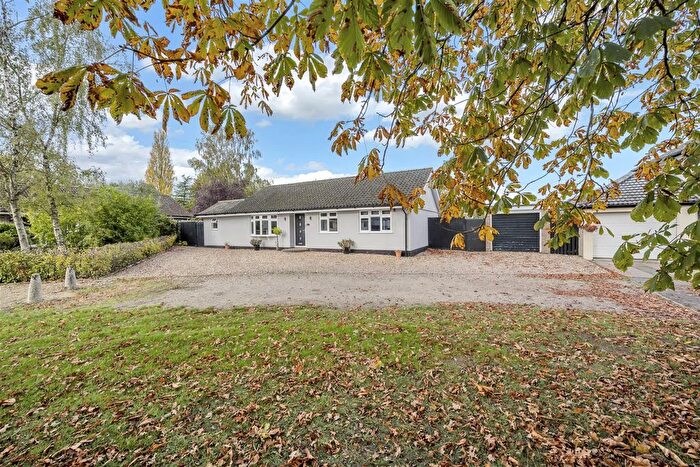
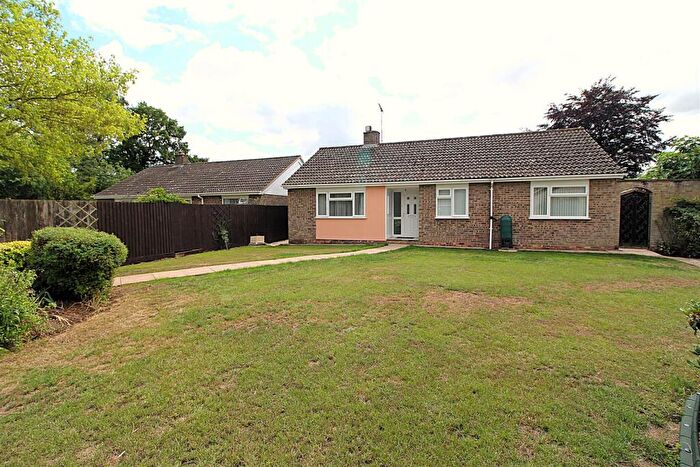
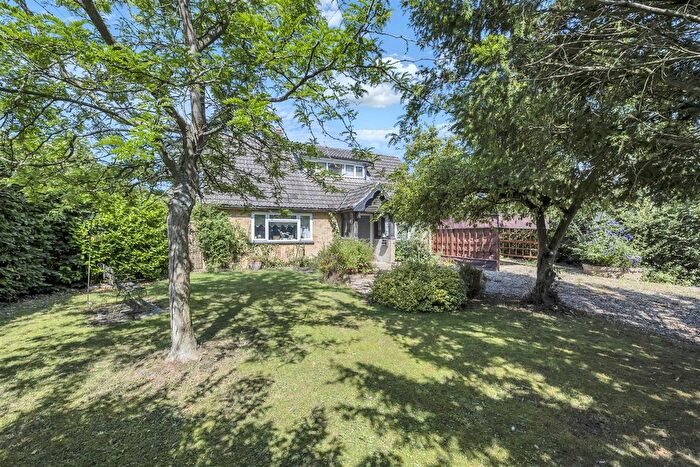
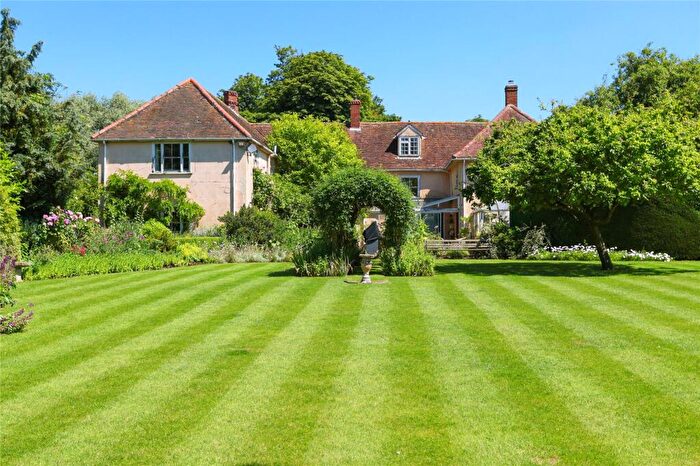
Properties for sale in Wickhambrook
![]()
If you are looking to sell your house, let it out, or receive a property valuation, an expert can help you.
Click the button below to get started.
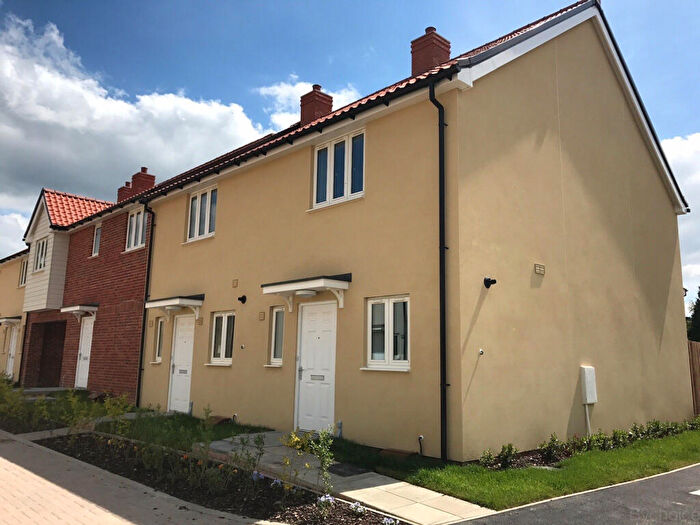
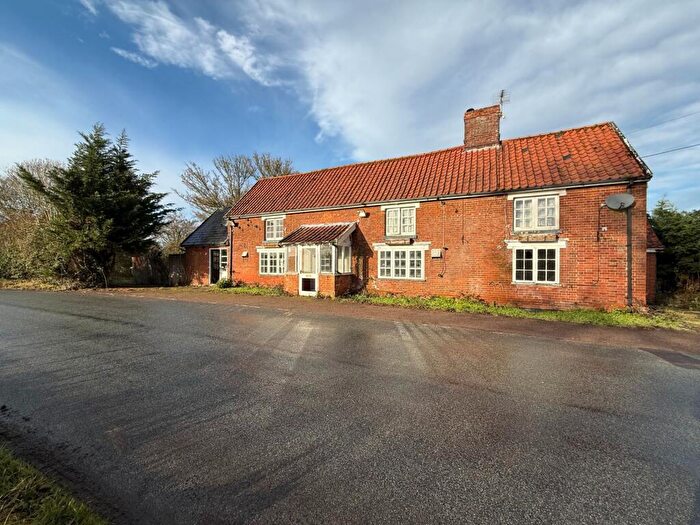
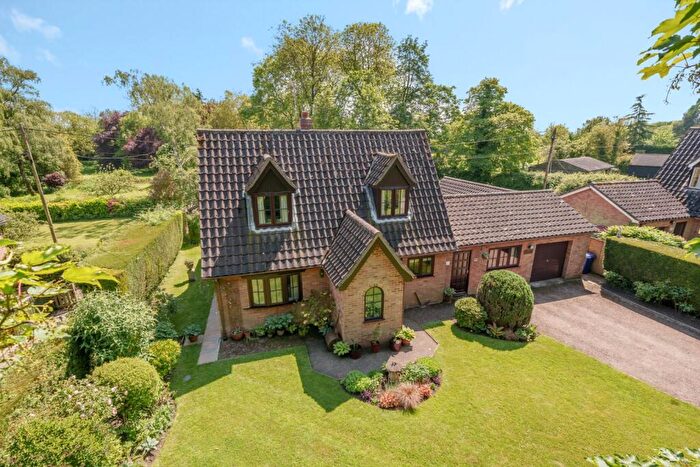
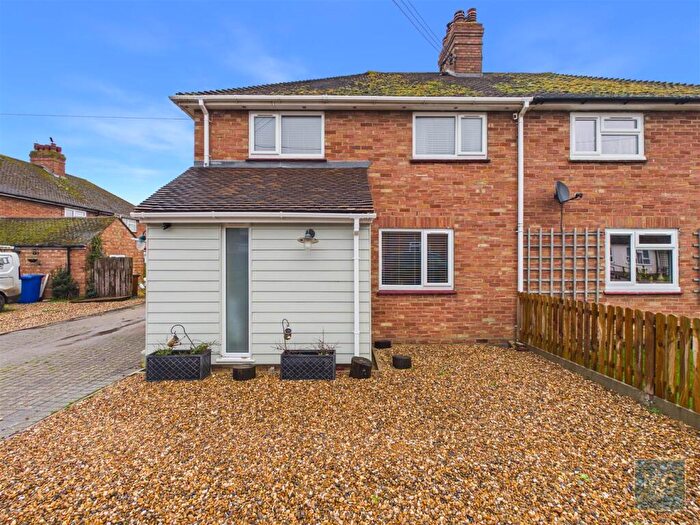
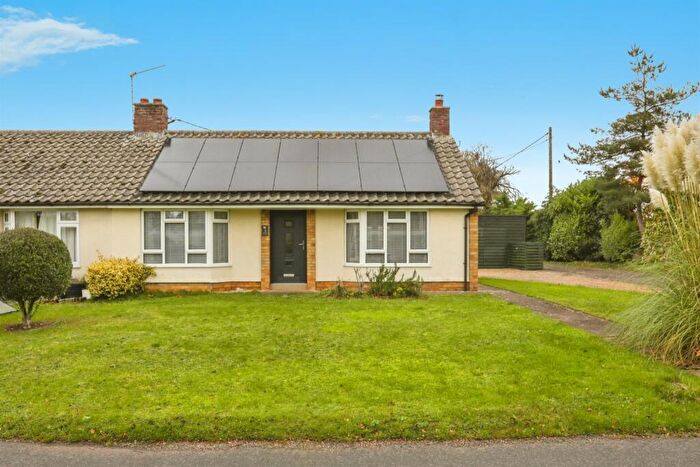
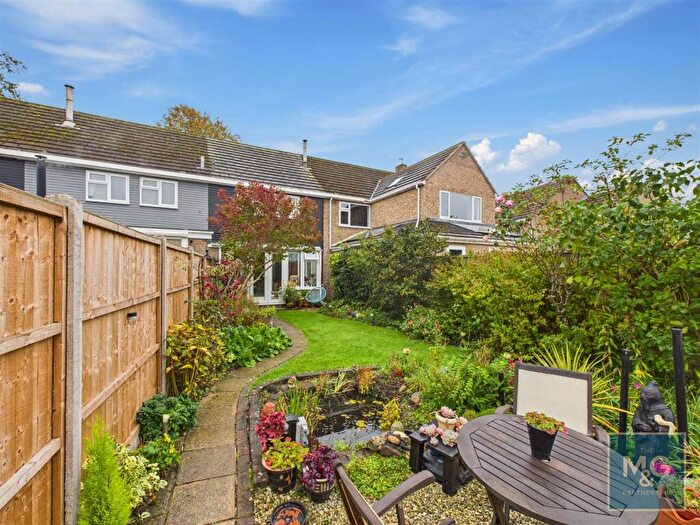
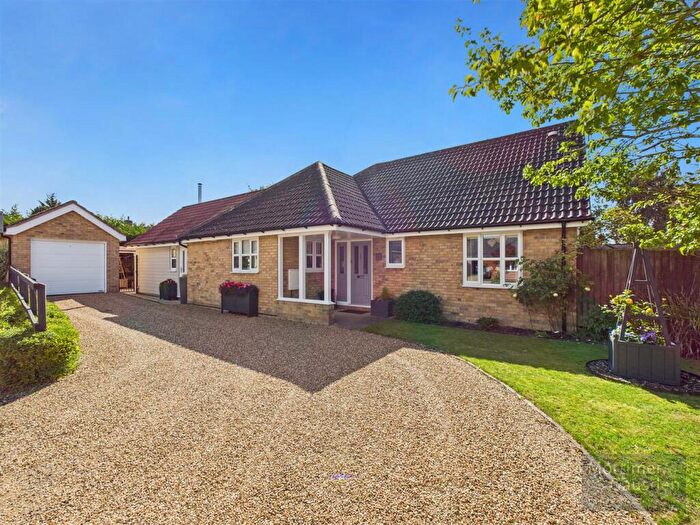
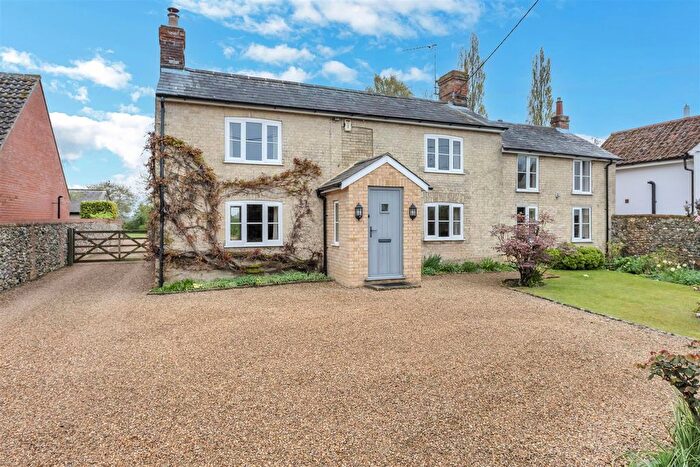
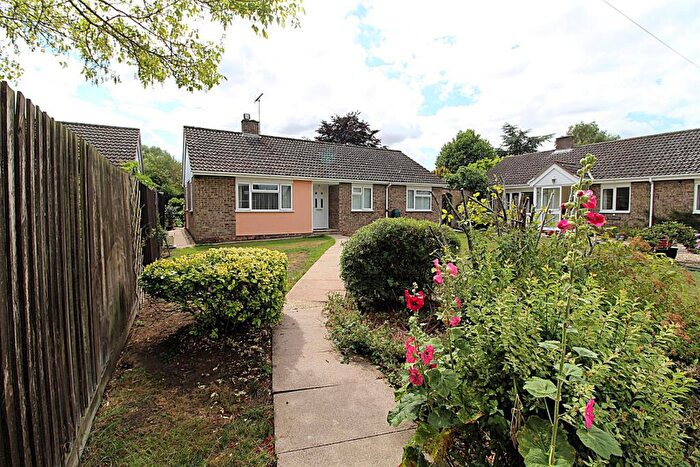
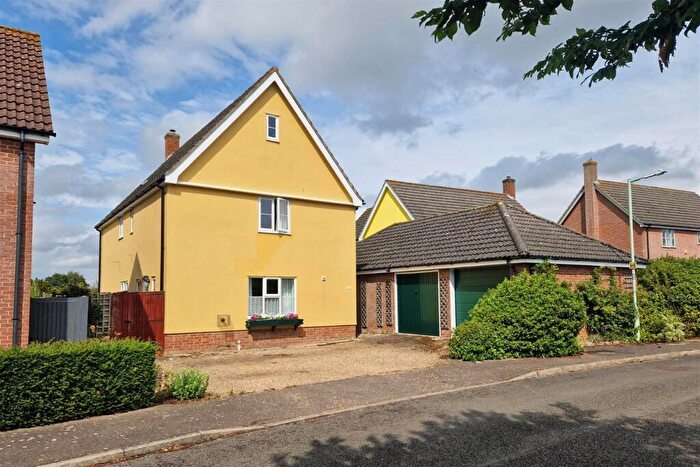
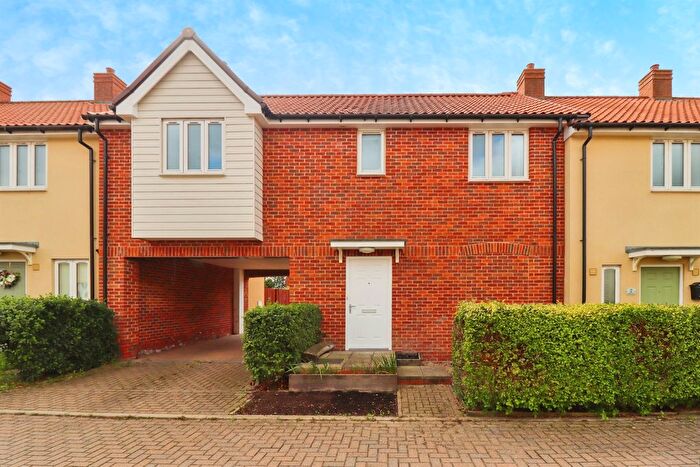
Previously listed properties in Wickhambrook

![]()
If you are looking to sell your house, let it out, or receive a property valuation, an expert can help you.
Click the button below to get started.
Roads and Postcodes in Wickhambrook
Navigate through our locations to find the location of your next house in Wickhambrook, Bury St Edmunds for sale or to rent.
| Streets | Postcodes |
|---|---|
| Barrow Road | IP29 5HF |
| Birds End | IP29 5HE |
| Bury Road | IP29 4BP IP29 5HP |
| Chevington Road | IP29 5JD |
| Church End | IP29 4BX |
| Church Lane | IP29 5HH |
| Hall Close | IP29 4DA |
| Knowles Green | IP29 5HZ |
| Ousden Road | IP29 5HT |
| School Cottages | IP29 5HR |
| The Green | IP29 5HS IP29 4BY |
| Wickhambrook Road | IP29 5HY |
| IP29 5HX IP29 4BT IP29 4BU IP29 4BZ |
Transport near Wickhambrook

- FAQ
- Price Paid By Year
- Property Type Price
Frequently asked questions about Wickhambrook
What is the average price for a property for sale in Wickhambrook?
The average price for a property for sale in Wickhambrook is £529,045. This amount is 51% higher than the average price in Bury St Edmunds. There are 77 property listings for sale in Wickhambrook.
What streets have the most expensive properties for sale in Wickhambrook?
The streets with the most expensive properties for sale in Wickhambrook are The Green at an average of £567,500, Wickhambrook Road at an average of £563,000 and Ousden Road at an average of £380,000.
What streets have the most affordable properties for sale in Wickhambrook?
The streets with the most affordable properties for sale in Wickhambrook are Hall Close at an average of £305,000 and Barrow Road at an average of £350,000.
Which train stations are available in or near Wickhambrook?
Some of the train stations available in or near Wickhambrook are Bury St.Edmunds, Kennett and Newmarket.
Property Price Paid in Wickhambrook by Year
The average sold property price by year was:
| Year | Average Sold Price | Price Change |
Sold Properties
|
|---|---|---|---|
| 2025 | £520,000 | -9% |
5 Properties |
| 2024 | £566,000 | 10% |
3 Properties |
| 2023 | £507,166 | -13% |
3 Properties |
| 2021 | £575,500 | 18% |
10 Properties |
| 2020 | £470,250 | 32% |
4 Properties |
| 2019 | £321,666 | -47% |
3 Properties |
| 2018 | £473,750 | 21% |
4 Properties |
| 2017 | £374,500 | -24% |
4 Properties |
| 2016 | £463,670 | -2% |
4 Properties |
| 2015 | £471,666 | 11% |
3 Properties |
| 2014 | £418,571 | 20% |
7 Properties |
| 2013 | £336,000 | 3% |
7 Properties |
| 2012 | £326,666 | 28% |
3 Properties |
| 2011 | £233,700 | -80% |
5 Properties |
| 2010 | £419,998 | 22% |
3 Properties |
| 2009 | £329,187 | 2% |
8 Properties |
| 2008 | £324,000 | -10% |
3 Properties |
| 2007 | £357,422 | 16% |
9 Properties |
| 2006 | £300,881 | -23% |
8 Properties |
| 2005 | £370,162 | 31% |
12 Properties |
| 2004 | £256,500 | -4% |
10 Properties |
| 2003 | £266,777 | -2% |
9 Properties |
| 2002 | £270,806 | 48% |
8 Properties |
| 2001 | £140,884 | -25% |
5 Properties |
| 2000 | £176,195 | 18% |
10 Properties |
| 1999 | £144,131 | 3% |
11 Properties |
| 1998 | £140,437 | 35% |
8 Properties |
| 1997 | £90,776 | 18% |
7 Properties |
| 1996 | £74,612 | -3% |
4 Properties |
| 1995 | £76,718 | - |
8 Properties |
Property Price per Property Type in Wickhambrook
Here you can find historic sold price data in order to help with your property search.
The average Property Paid Price for specific property types in the last three years are:
| Property Type | Average Sold Price | Sold Properties |
|---|---|---|
| Semi Detached House | £342,500.00 | 2 Semi Detached Houses |
| Detached House | £570,500.00 | 9 Detached Houses |