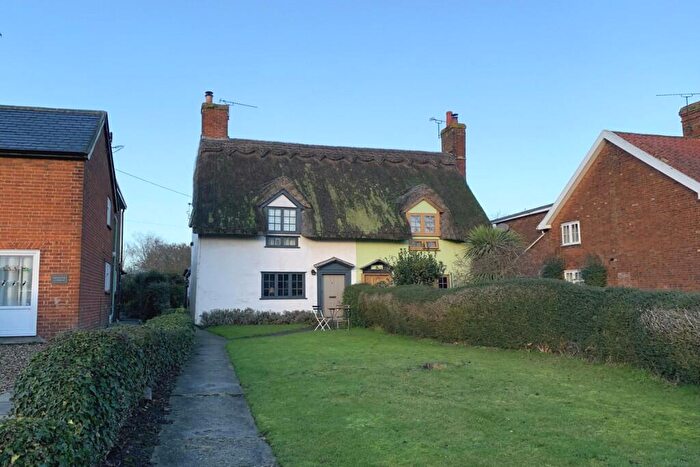
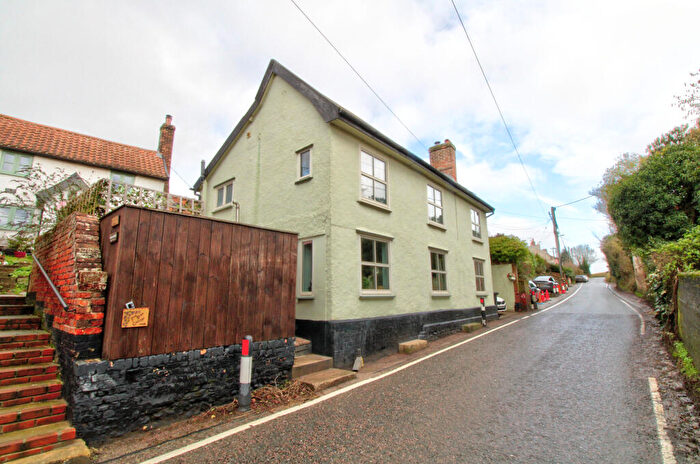
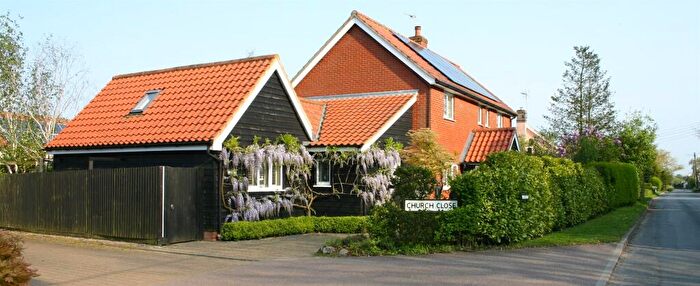
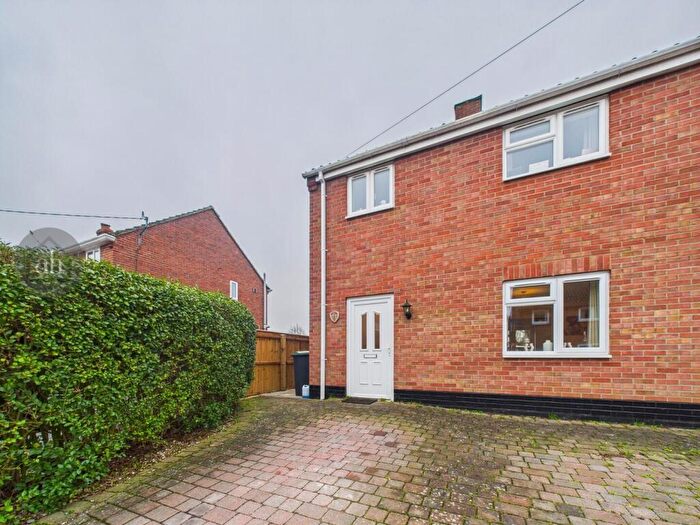
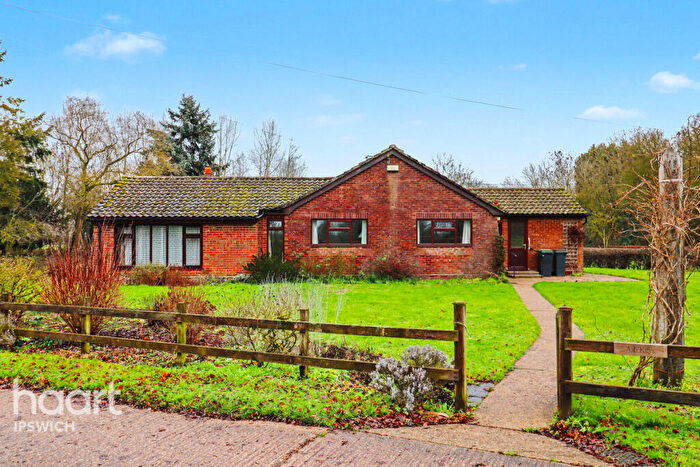
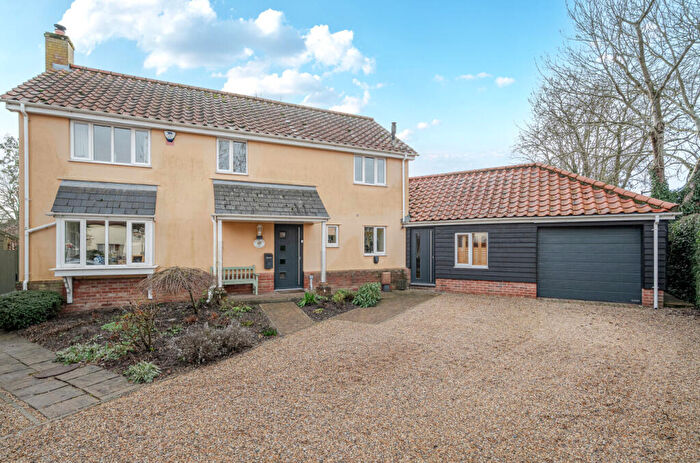
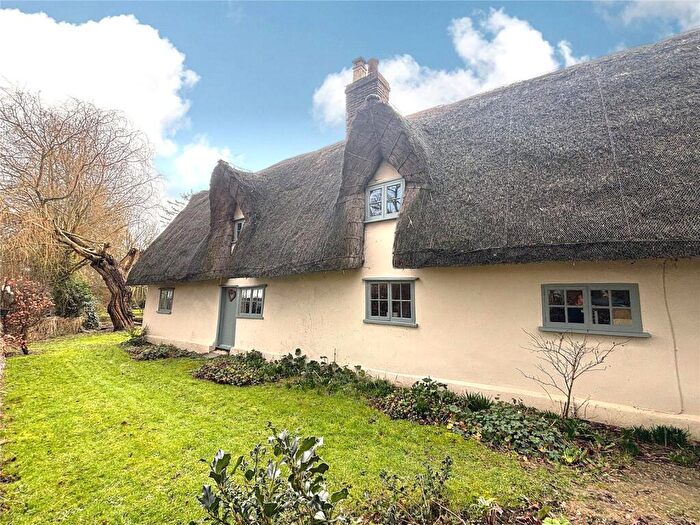
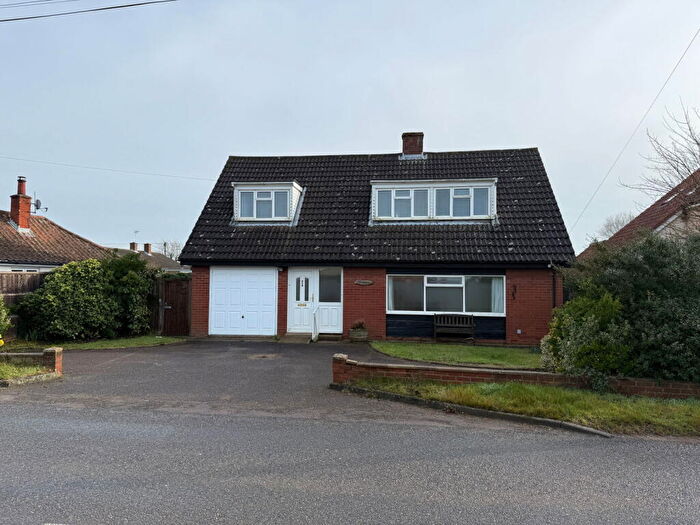
Houses for sale & to rent in Stonham, Stowmarket
House Prices in Stonham
Properties in Stonham have an average house price of £472,000.00 and had 5 Property Transactions within the last 3 years¹.
Stonham is an area in Stowmarket, Suffolk with 133 households², where the most expensive property was sold for £625,000.00.
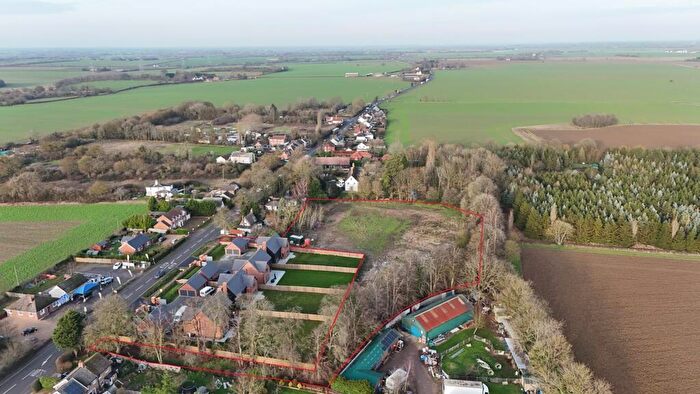
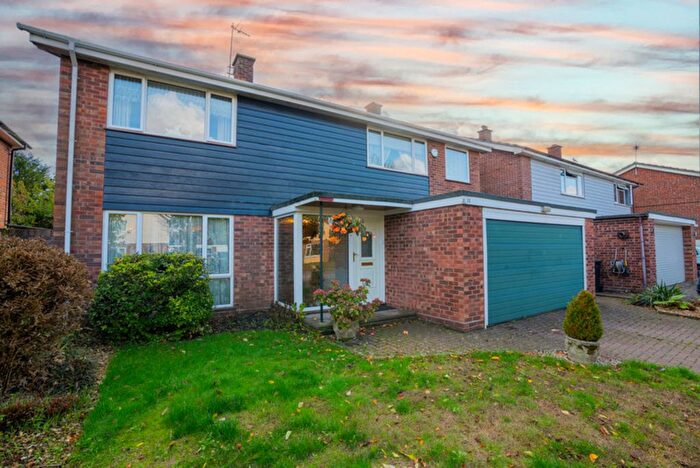
Properties for sale in Stonham
Roads and Postcodes in Stonham
Navigate through our locations to find the location of your next house in Stonham, Stowmarket for sale or to rent.
| Streets | Postcodes |
|---|---|
| Birds Lane | IP14 6HW |
| Church Road | IP14 6DW |
| Clockhouse Lane | IP14 5JP |
| Crowfield Road | IP14 6AN |
| Debenham Road | IP14 5LD IP14 5LE |
| Fen Lane | IP14 5EF |
| Forward Green | IP14 5EH IP14 5EQ IP14 5HF IP14 5HJ IP14 5HQ IP14 5HW |
| Framsden Road | IP14 6DS |
| Gosbeck Road | IP14 6EW |
| Ipswich Road | IP14 6EE IP14 6EJ IP14 6EL IP14 6EN |
| Jockeys Lane | IP14 6HJ IP14 6LW |
| Middlewood Green | IP14 5EY IP14 5HA IP14 5HG |
| New Road | IP14 6DZ IP14 6EA IP14 6EB IP14 6ED |
| Norwich Road | IP14 5DJ IP14 5DR IP14 5JX IP14 5JZ IP14 5LU |
| Peats Corner | IP14 6LL |
| School Road | IP14 6EX |
| St Johns Row | IP14 6EY IP14 6EZ |
| Stonham Aspal Road | IP14 6AY |
| The Green | IP14 6FB |
| The Street | IP14 6AP |
| Thornbush Lane | IP14 5DY |
| Webbs Road | IP14 6FD |
| Wetheringsett Road | IP14 5LJ |
| White House Lane | IP14 5HE |
| IP14 5DU IP14 5DZ IP14 5ED IP14 6AX IP14 6DB IP14 6DL IP14 6EF IP14 6EG IP14 6EU IP14 6HA IP14 6HL IP14 6FF |
Transport near Stonham
- FAQ
- Price Paid By Year
- Property Type Price
Frequently asked questions about Stonham
What is the average price for a property for sale in Stonham?
The average price for a property for sale in Stonham is £472,000. This amount is 55% higher than the average price in Stowmarket. There are 1,091 property listings for sale in Stonham.
What streets have the most expensive properties for sale in Stonham?
The streets with the most expensive properties for sale in Stonham are The Green at an average of £625,000 and Forward Green at an average of £522,500.
What streets have the most affordable properties for sale in Stonham?
The streets with the most affordable properties for sale in Stonham are Norwich Road at an average of £275,000 and Jockeys Lane at an average of £415,000.
Which train stations are available in or near Stonham?
Some of the train stations available in or near Stonham are Needham Market, Stowmarket and Westerfield.
Property Price Paid in Stonham by Year
The average sold property price by year was:
| Year | Average Sold Price | Price Change |
Sold Properties
|
|---|---|---|---|
| 2025 | £572,500 | 40% |
2 Properties |
| 2024 | £345,000 | -52% |
2 Properties |
| 2023 | £525,000 | -41% |
1 Property |
| 2022 | £738,333 | 42% |
3 Properties |
| 2021 | £427,500 | 46% |
2 Properties |
| 2020 | £231,250 | -125% |
2 Properties |
| 2019 | £520,500 | 39% |
2 Properties |
| 2018 | £320,000 | -16% |
1 Property |
| 2017 | £370,000 | 57% |
1 Property |
| 2016 | £160,000 | -277% |
1 Property |
| 2015 | £603,333 | 23% |
3 Properties |
| 2014 | £465,000 | 61% |
1 Property |
| 2011 | £180,000 | 88% |
1 Property |
| 2010 | £21,500 | -1016,3% |
1 Property |
| 2001 | £240,000 | 33% |
1 Property |
| 1999 | £160,000 | -72% |
1 Property |
| 1998 | £275,000 | 87% |
1 Property |
| 1996 | £35,000 | - |
1 Property |
Property Price per Property Type in Stonham
Here you can find historic sold price data in order to help with your property search.
The average Property Paid Price for specific property types in the last three years are:
| Property Type | Average Sold Price | Sold Properties |
|---|---|---|
| Detached House | £521,250.00 | 4 Detached Houses |
| Terraced House | £275,000.00 | 1 Terraced House |

