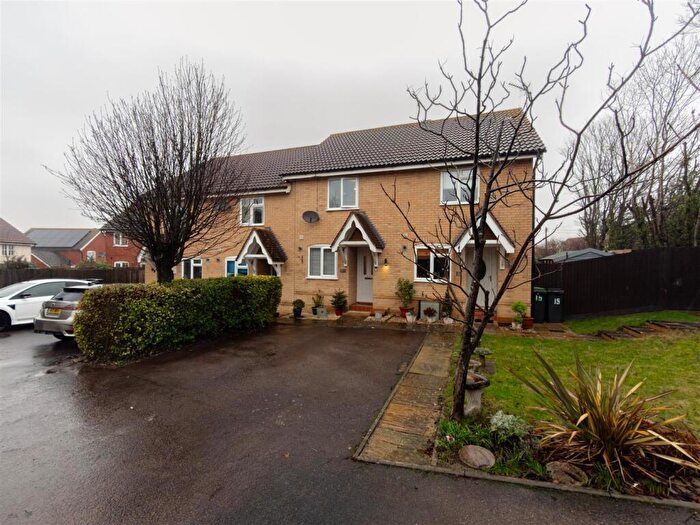
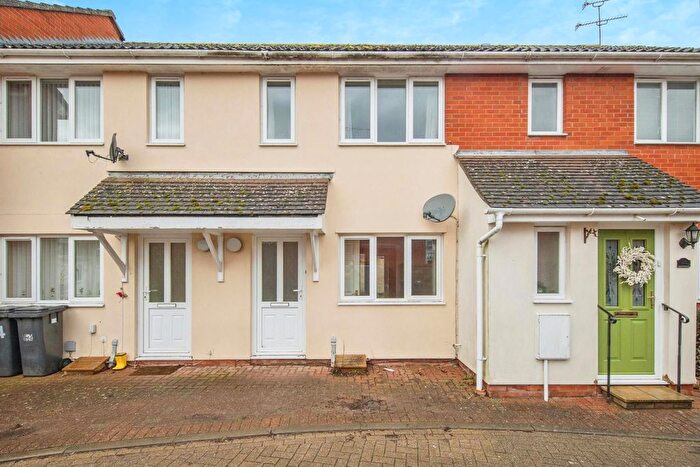
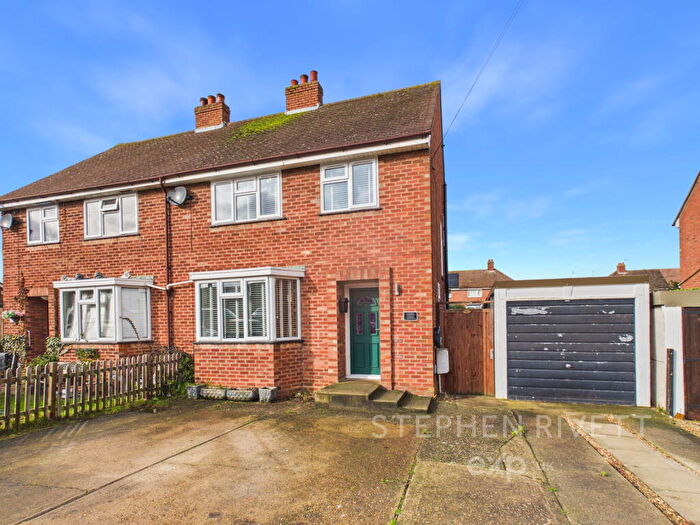
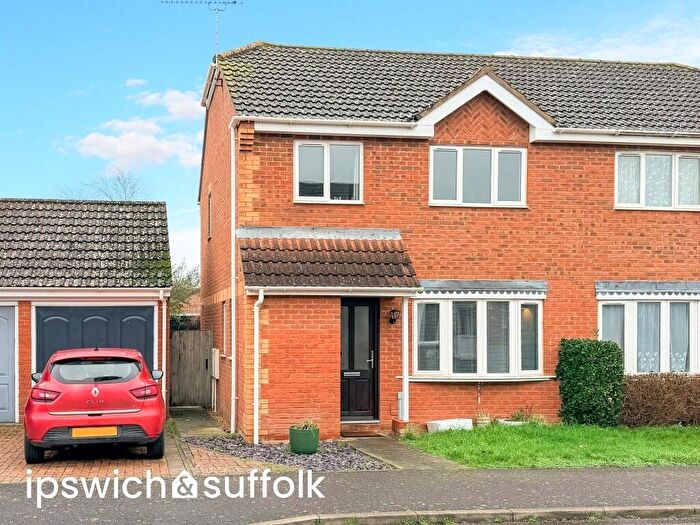
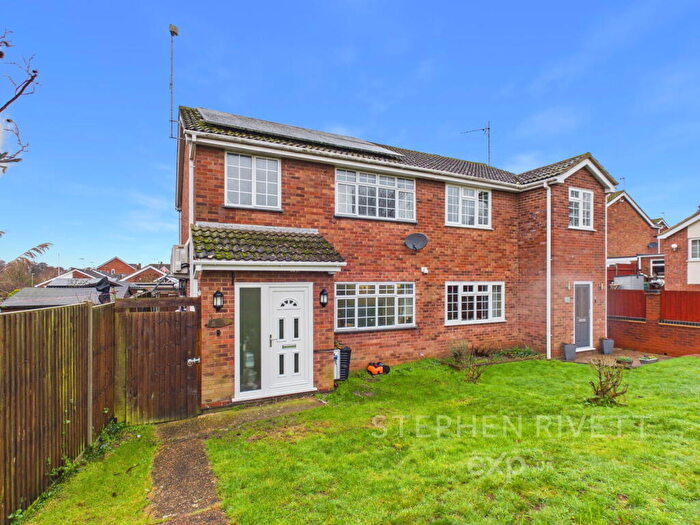
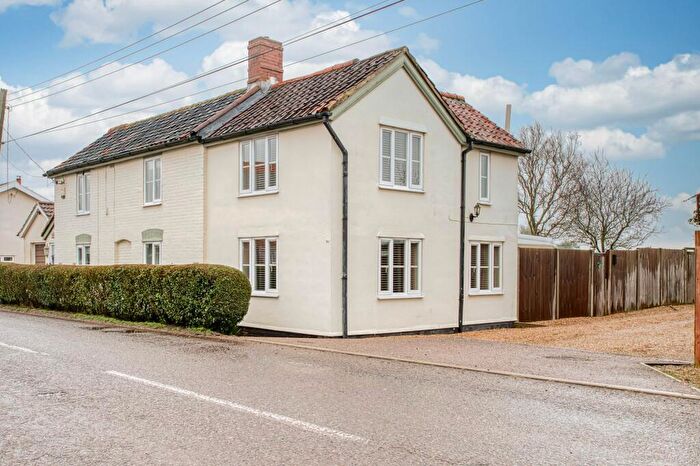
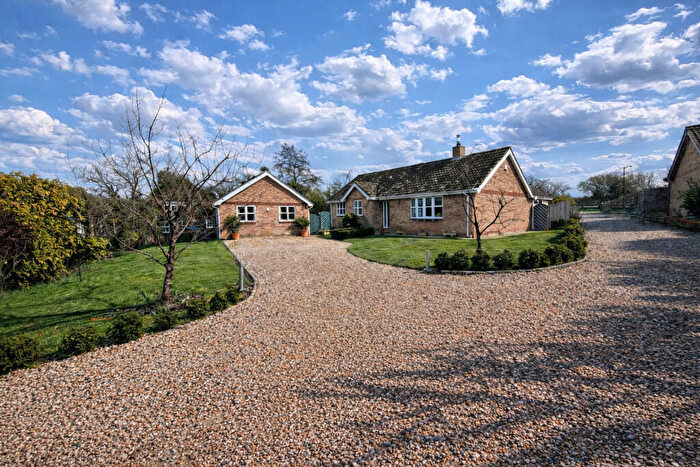
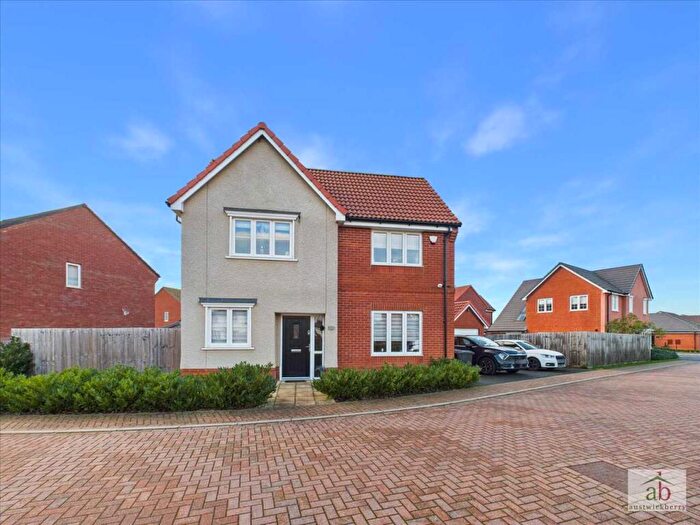
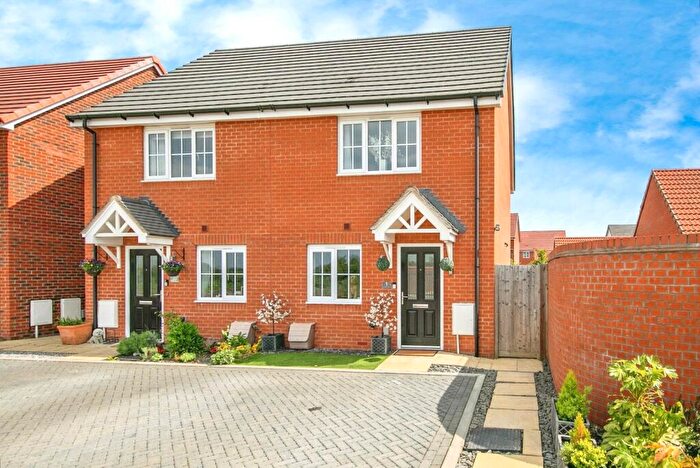
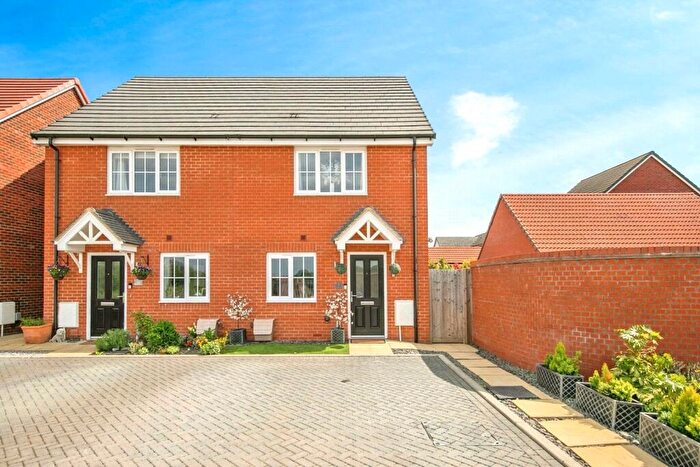
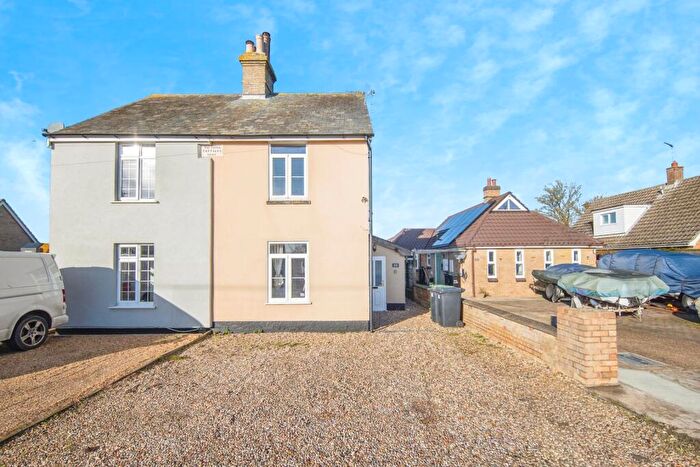
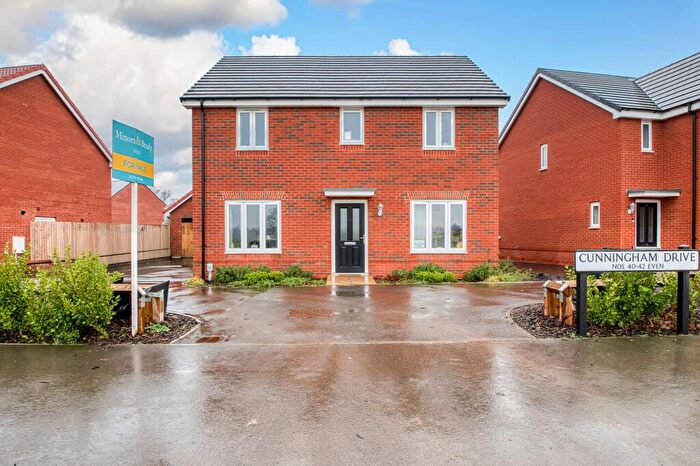
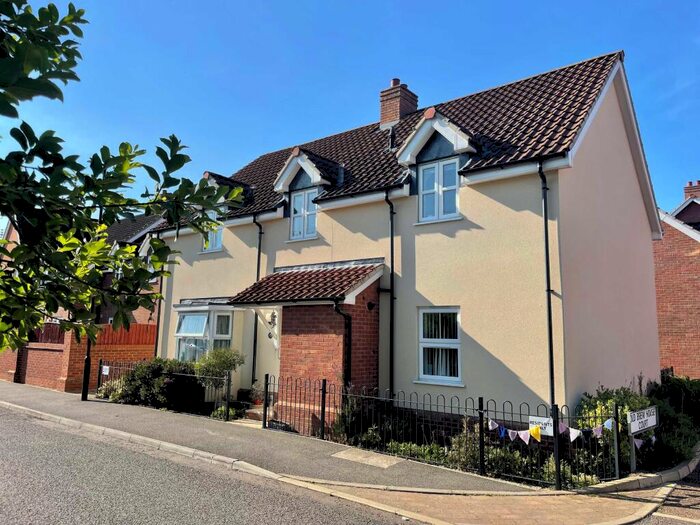
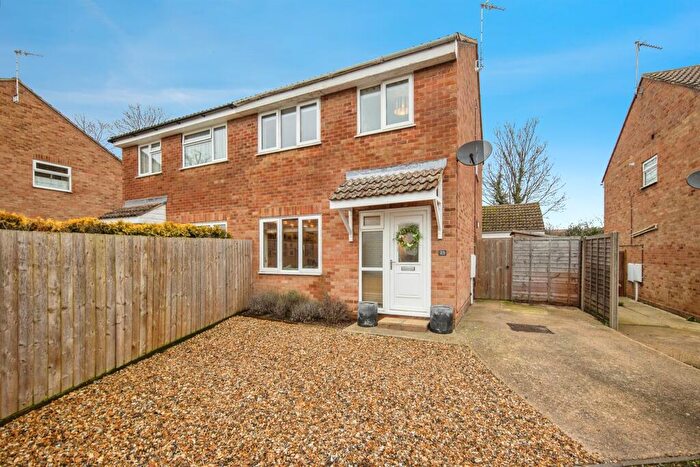
Houses for sale & to rent in Stowmarket, Suffolk
House Prices in Stowmarket
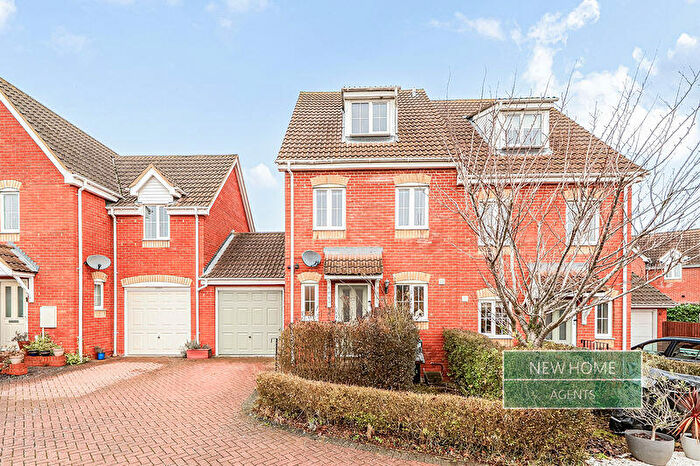
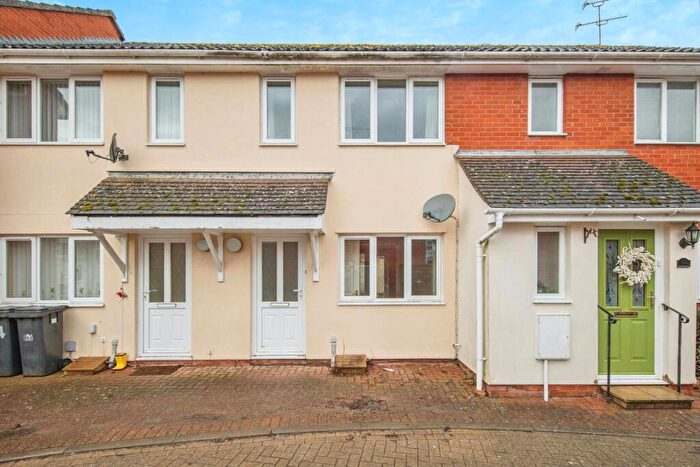
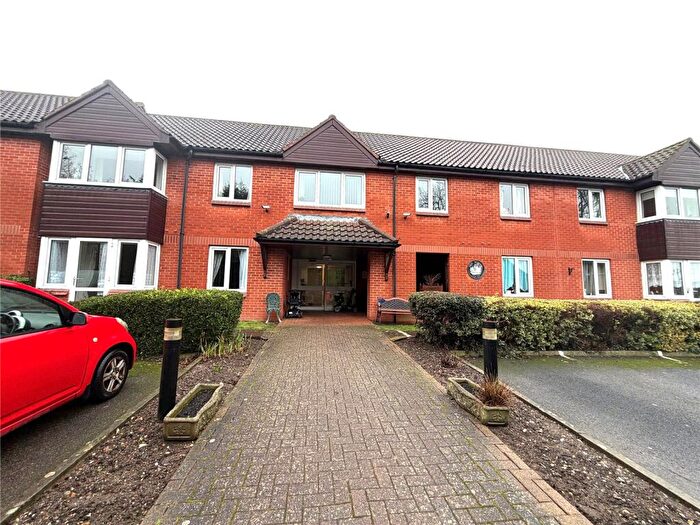
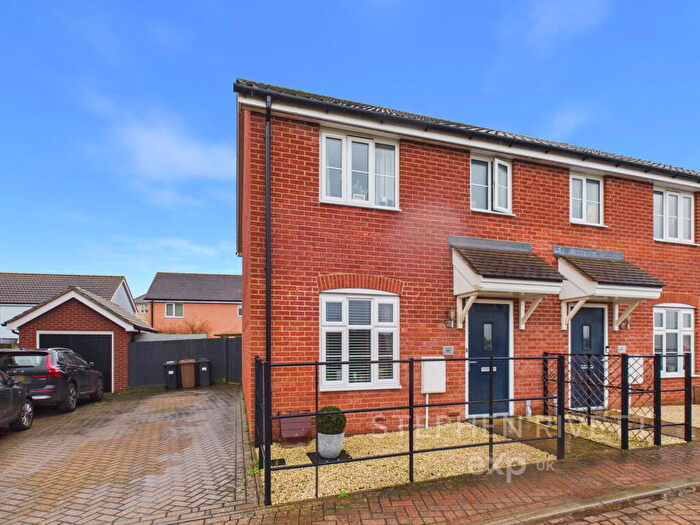
Properties in Stowmarket have an average house price of £303,875.00 and had 1,595 Property Transactions within the last 3 years.¹
Stowmarket is an area in Suffolk with 16,294 households², where the most expensive property was sold for £1,450,000.00.
Properties for sale in Stowmarket
Neighbourhoods in Stowmarket
Navigate through our locations to find the location of your next house in Stowmarket, Suffolk for sale or to rent.
- Bacton And Old Newton
- Badwell Ash
- Debenham
- Haughley And Wetherden
- Helmingham And Coddenham
- Mendlesham
- Onehouse
- Rickinghall And Walsham
- Ringshall
- Stowmarket Central
- Stowmarket North
- Stowmarket South
- Stowupland
- The Stonhams
- Wetheringsett
- Worlingworth
- St Peter's
- Combs Ford
- Stow Thorney
- Battisford & Ringshall
- Haughley, Stowupland & Wetherden
- Bacton
- Stonham
- Claydon & Barham
- Chilton
- Rattlesden
Transport in Stowmarket
Please see below transportation links in this area:
- FAQ
- Price Paid By Year
- Property Type Price
Frequently asked questions about Stowmarket
What is the average price for a property for sale in Stowmarket?
The average price for a property for sale in Stowmarket is £303,875. This amount is 5% lower than the average price in Suffolk. There are more than 10,000 property listings for sale in Stowmarket.
What locations have the most expensive properties for sale in Stowmarket?
The locations with the most expensive properties for sale in Stowmarket are The Stonhams at an average of £486,244, Ringshall at an average of £483,780 and Wetheringsett at an average of £483,052.
What locations have the most affordable properties for sale in Stowmarket?
The locations with the most affordable properties for sale in Stowmarket are St Peter's at an average of £215,000, Haughley, Stowupland & Wetherden at an average of £237,313 and Stowmarket Central at an average of £241,447.
Which train stations are available in or near Stowmarket?
Some of the train stations available in or near Stowmarket are Stowmarket, Needham Market and Elmswell.
Property Price Paid in Stowmarket by Year
The average sold property price by year was:
| Year | Average Sold Price | Price Change |
Sold Properties
|
|---|---|---|---|
| 2025 | £298,183 | -3% |
529 Properties |
| 2024 | £307,838 | 1% |
565 Properties |
| 2023 | £305,415 | 1% |
501 Properties |
| 2022 | £303,155 | 1% |
631 Properties |
| 2021 | £299,977 | 9% |
1,002 Properties |
| 2020 | £273,974 | 4% |
632 Properties |
| 2019 | £263,567 | -0,3% |
767 Properties |
| 2018 | £264,423 | 2% |
846 Properties |
| 2017 | £259,232 | 6% |
808 Properties |
| 2016 | £243,295 | 6% |
804 Properties |
| 2015 | £228,447 | 10% |
838 Properties |
| 2014 | £204,564 | 5% |
870 Properties |
| 2013 | £194,104 | 5% |
760 Properties |
| 2012 | £183,679 | -1% |
660 Properties |
| 2011 | £184,667 | -4% |
646 Properties |
| 2010 | £191,742 | 8% |
632 Properties |
| 2009 | £175,724 | -6% |
669 Properties |
| 2008 | £186,784 | -5% |
582 Properties |
| 2007 | £195,611 | 8% |
1,054 Properties |
| 2006 | £180,935 | 3% |
1,048 Properties |
| 2005 | £176,028 | 2% |
920 Properties |
| 2004 | £171,765 | 11% |
1,012 Properties |
| 2003 | £152,625 | 16% |
859 Properties |
| 2002 | £128,358 | 16% |
939 Properties |
| 2001 | £107,432 | 12% |
920 Properties |
| 2000 | £94,743 | 13% |
758 Properties |
| 1999 | £82,481 | 13% |
974 Properties |
| 1998 | £72,020 | 3% |
804 Properties |
| 1997 | £69,711 | 16% |
854 Properties |
| 1996 | £58,572 | -4% |
719 Properties |
| 1995 | £61,154 | - |
577 Properties |
Property Price per Property Type in Stowmarket
Here you can find historic sold price data in order to help with your property search.
The average Property Paid Price for specific property types in the last three years are:
| Property Type | Average Sold Price | Sold Properties |
|---|---|---|
| Semi Detached House | £271,219.00 | 471 Semi Detached Houses |
| Terraced House | £218,515.00 | 407 Terraced Houses |
| Detached House | £425,007.00 | 589 Detached Houses |
| Flat | £138,055.00 | 128 Flats |

