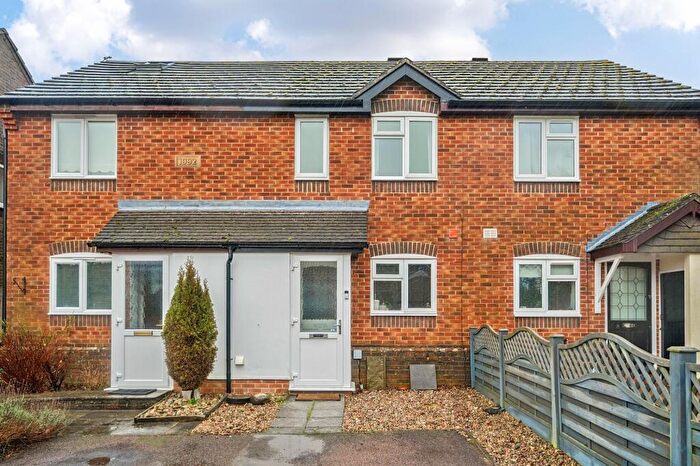
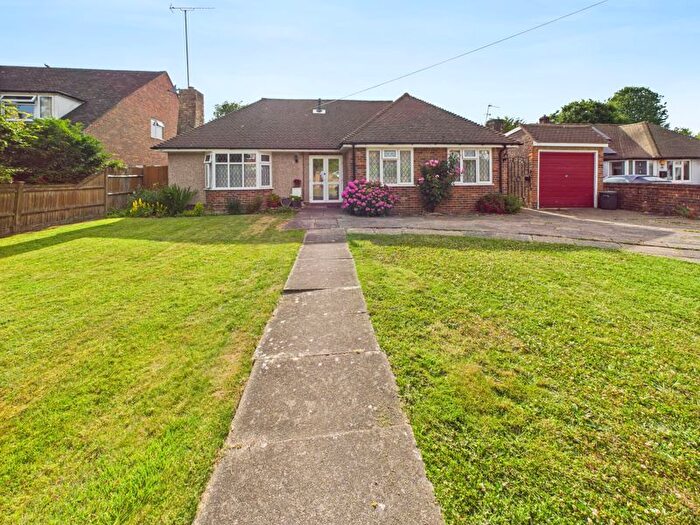
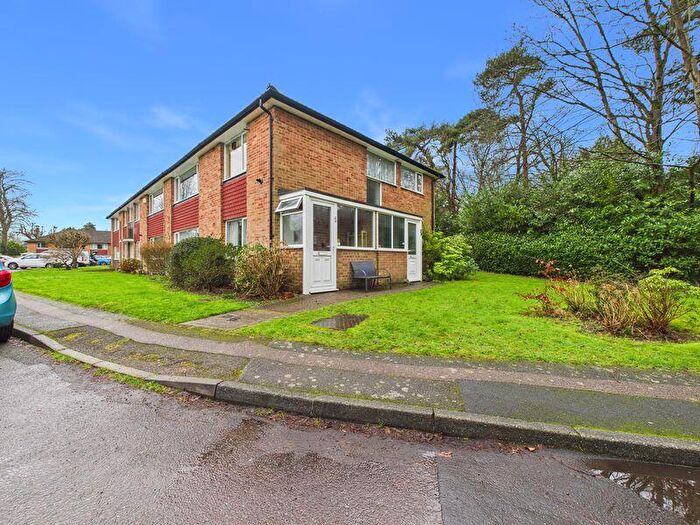
Houses for sale & to rent in Portley, Caterham
House Prices in Portley
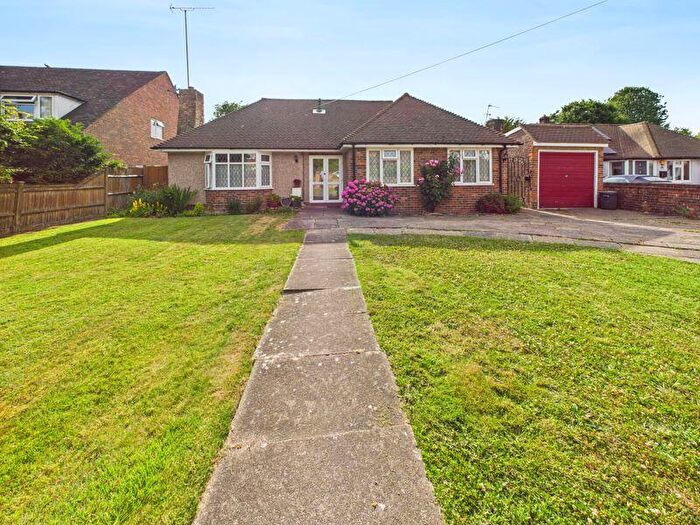
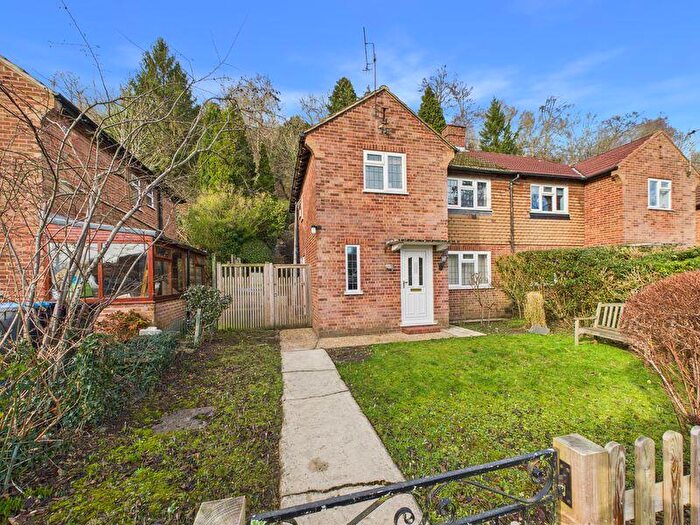
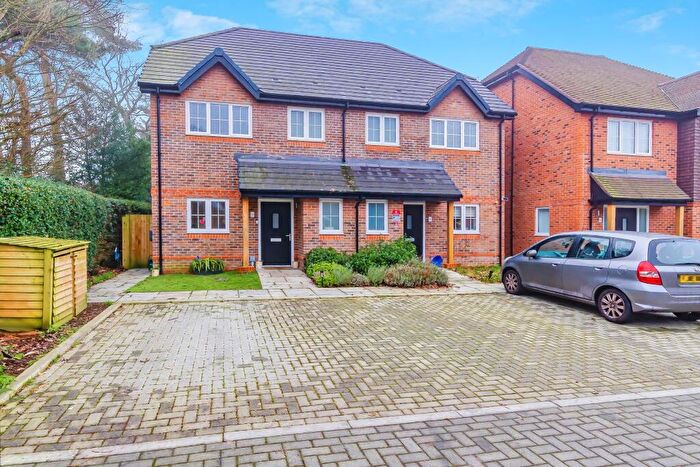
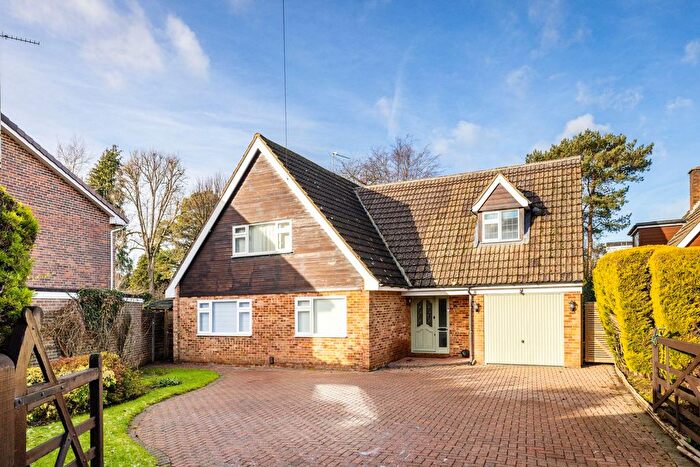
Properties in Portley have an average house price of £506,741.00 and had 151 Property Transactions within the last 3 years¹.
Portley is an area in Caterham, Surrey with 1,524 households², where the most expensive property was sold for £1,150,000.00.
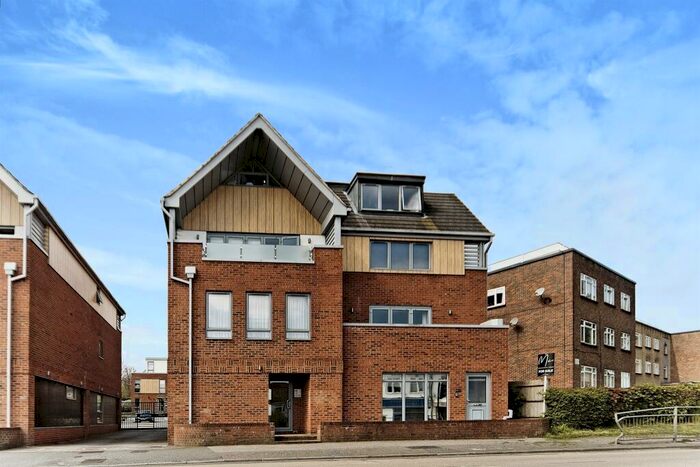
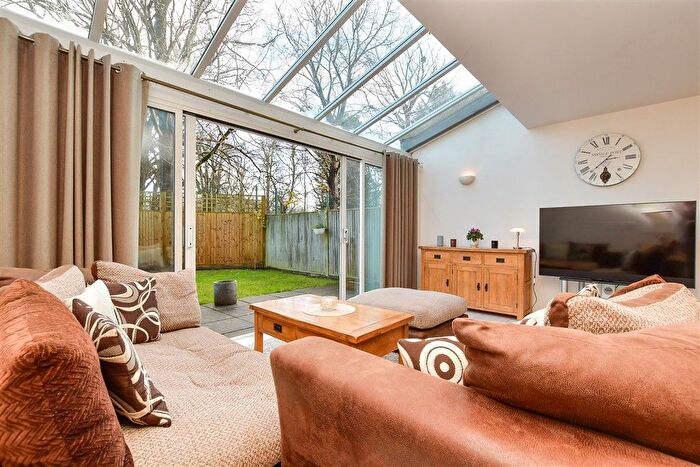
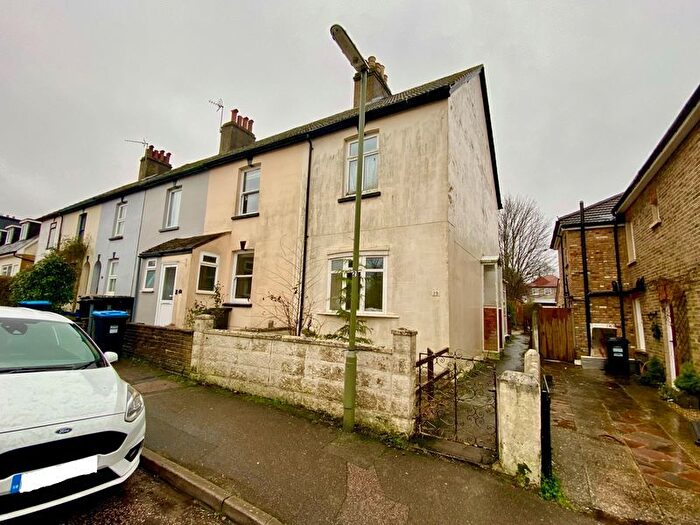
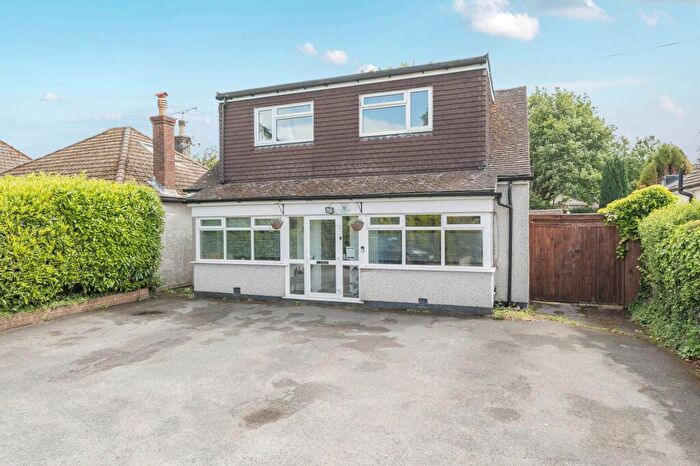
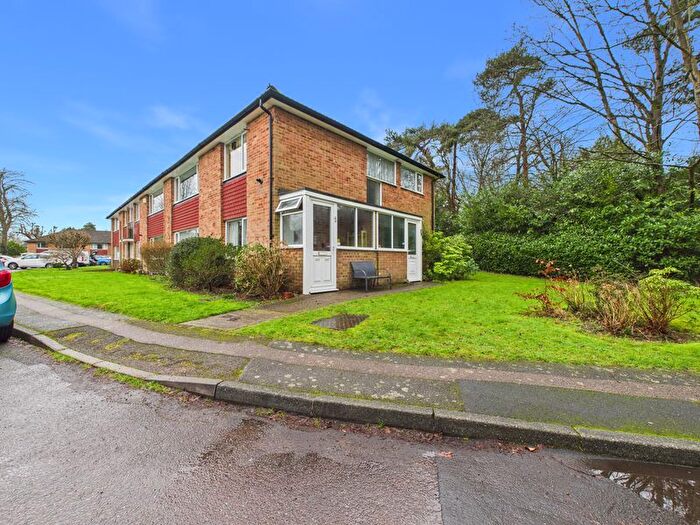
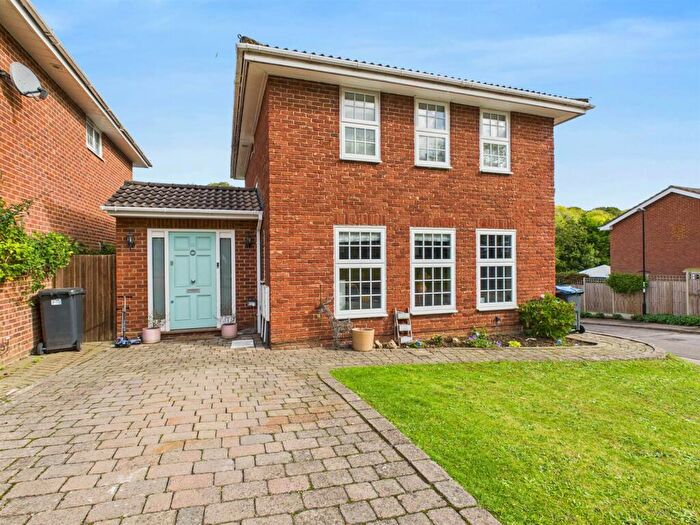
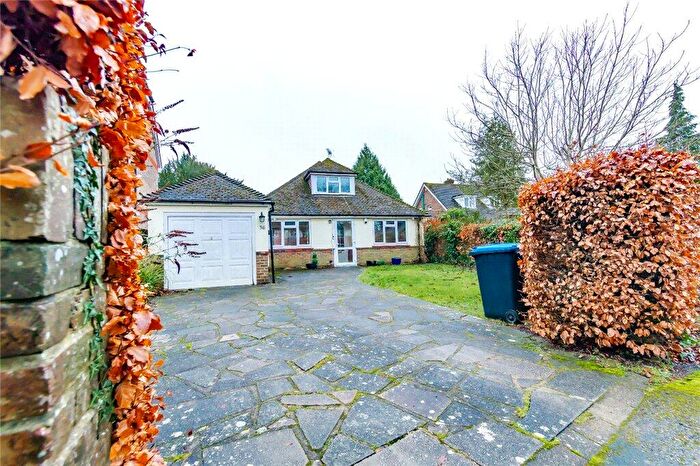
Properties for sale in Portley
Roads and Postcodes in Portley
Navigate through our locations to find the location of your next house in Portley, Caterham for sale or to rent.
| Streets | Postcodes |
|---|---|
| Addison Close | CR3 5LX |
| Addison Road | CR3 5LR CR3 5LU CR3 5LW CR3 5LY |
| Alders Grove | CR3 5FU |
| Annes Walk | CR3 5EL |
| Banstead Road | CR3 5QE CR3 5QF CR3 5SW |
| Berkshire Close | CR3 5SX |
| Bourne Lane | CR3 5SP |
| Broadleaf Place | CR3 5GP |
| Burntwood Lane | CR3 5UN CR3 5YX |
| Buxton Avenue | CR3 5HU |
| Buxton Lane | CR3 5HB CR3 5HD CR3 5HE CR3 5HF CR3 5HG CR3 5HH CR3 5HJ CR3 5HL CR3 5HN |
| Buxton Place | CR3 5SZ |
| Campbell Road | CR3 5JL CR3 5JN CR3 5JP CR3 5JQ |
| Cedar Park | CR3 5DZ |
| Eldon Road | CR3 5JR CR3 5JS CR3 5JT CR3 5JU |
| Elm Grove | CR3 5SR |
| Foxon Close | CR3 5SY |
| Foxon Lane | CR3 5SA CR3 5SB CR3 5SD CR3 5SE CR3 5SG CR3 5SH CR3 5SJ CR3 5SF |
| Foxon Lane Gardens | CR3 5SN |
| Fulford Road | CR3 5SQ |
| Garland Way | CR3 5SS |
| Gatiers Lane | CR3 5GG |
| Gordon Road | CR3 5LS |
| Halyngbury Road | CR3 5GJ |
| Hawthorne Gardens | CR3 5HW |
| Hillhurst Gardens | CR3 5HX |
| Holly Tree Road | CR3 5ST |
| Le Personne Road | CR3 5SU |
| Longmead Close | CR3 5HA |
| Macaulay Road | CR3 5HQ CR3 5HR CR3 5HS |
| Matlock Road | CR3 5HP |
| Merlewood Close | CR3 5LZ |
| Milton Road | CR3 5JD CR3 5JG CR3 5JJ |
| Ninehams Close | CR3 5LQ |
| Ninehams Gardens | CR3 5LP |
| Ninehams Road | CR3 5LD CR3 5LG CR3 5LH CR3 5LJ CR3 5LL CR3 5LN |
| Penrhyn Close | CR3 5JX |
| Porkele Place | CR3 5FZ |
| Reid Avenue | CR3 5SL |
| Rosebriars | CR3 5ER |
| Ryelands Close | CR3 5HY |
| Salmons Lane West | CR3 5LT |
| Spencer Road | CR3 5LA CR3 5LB CR3 5LE CR3 5LF |
| Strathmore Close | CR3 5EQ |
| The Squerryes | CR3 5HT CR3 5JW |
| Upwode Way | CR3 5GF |
| Whitefields | CR3 5FW |
| Whyteleafe Road | CR3 5ED CR3 5EJ |
Transport near Portley
-
Whyteleafe South Station
-
Caterham Station
-
Upper Warlingham Station
-
Whyteleafe Station
-
Woldingham Station
-
Kenley Station
-
Coulsdon South Station
-
Coulsdon Town Station
-
Riddlesdown Station
-
Reedham Station
- FAQ
- Price Paid By Year
- Property Type Price
Frequently asked questions about Portley
What is the average price for a property for sale in Portley?
The average price for a property for sale in Portley is £506,741. This amount is 4% lower than the average price in Caterham. There are 1,188 property listings for sale in Portley.
What streets have the most expensive properties for sale in Portley?
The streets with the most expensive properties for sale in Portley are Foxon Close at an average of £1,075,000, Rosebriars at an average of £810,000 and Whyteleafe Road at an average of £801,750.
What streets have the most affordable properties for sale in Portley?
The streets with the most affordable properties for sale in Portley are Ninehams Gardens at an average of £236,250, Addison Close at an average of £290,000 and Le Personne Road at an average of £302,166.
Which train stations are available in or near Portley?
Some of the train stations available in or near Portley are Whyteleafe South, Caterham and Upper Warlingham.
Property Price Paid in Portley by Year
The average sold property price by year was:
| Year | Average Sold Price | Price Change |
Sold Properties
|
|---|---|---|---|
| 2025 | £498,145 | -4% |
50 Properties |
| 2024 | £517,954 | 3% |
55 Properties |
| 2023 | £502,676 | 3% |
46 Properties |
| 2022 | £489,606 | -1% |
66 Properties |
| 2021 | £492,520 | 0,4% |
84 Properties |
| 2020 | £490,374 | 9% |
62 Properties |
| 2019 | £446,855 | 2% |
53 Properties |
| 2018 | £438,760 | -6% |
61 Properties |
| 2017 | £465,458 | 17% |
68 Properties |
| 2016 | £387,364 | -8% |
62 Properties |
| 2015 | £419,987 | 19% |
85 Properties |
| 2014 | £341,973 | 6% |
72 Properties |
| 2013 | £321,818 | 6% |
69 Properties |
| 2012 | £301,196 | 5% |
63 Properties |
| 2011 | £284,906 | -14% |
71 Properties |
| 2010 | £325,255 | 19% |
52 Properties |
| 2009 | £262,434 | -4% |
66 Properties |
| 2008 | £273,964 | 1% |
47 Properties |
| 2007 | £272,560 | -6% |
111 Properties |
| 2006 | £288,184 | 13% |
101 Properties |
| 2005 | £251,178 | -1% |
100 Properties |
| 2004 | £254,347 | 4% |
82 Properties |
| 2003 | £243,159 | 22% |
86 Properties |
| 2002 | £190,605 | 7% |
116 Properties |
| 2001 | £177,177 | -3% |
82 Properties |
| 2000 | £181,750 | 10% |
110 Properties |
| 1999 | £164,171 | 29% |
93 Properties |
| 1998 | £116,432 | 27% |
68 Properties |
| 1997 | £85,196 | -0,4% |
82 Properties |
| 1996 | £85,576 | 6% |
75 Properties |
| 1995 | £80,044 | - |
55 Properties |
Property Price per Property Type in Portley
Here you can find historic sold price data in order to help with your property search.
The average Property Paid Price for specific property types in the last three years are:
| Property Type | Average Sold Price | Sold Properties |
|---|---|---|
| Semi Detached House | £499,307.00 | 67 Semi Detached Houses |
| Detached House | £709,229.00 | 37 Detached Houses |
| Terraced House | £429,844.00 | 27 Terraced Houses |
| Flat | £260,850.00 | 20 Flats |

