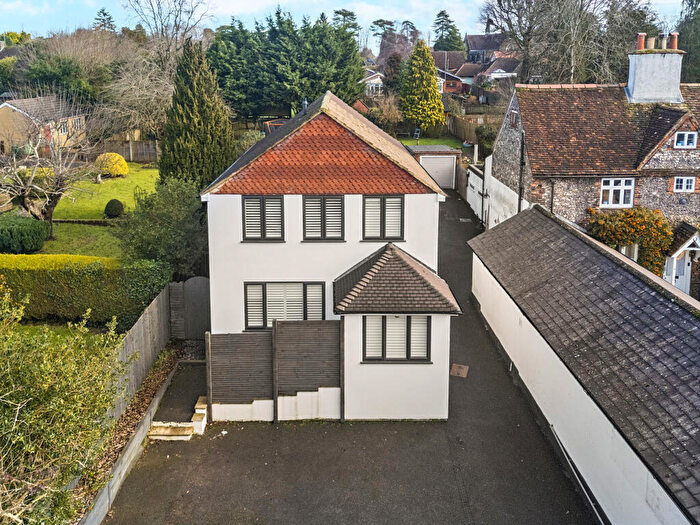
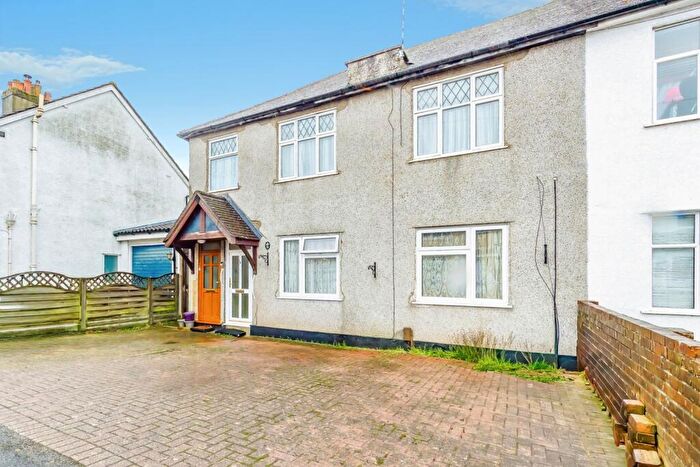
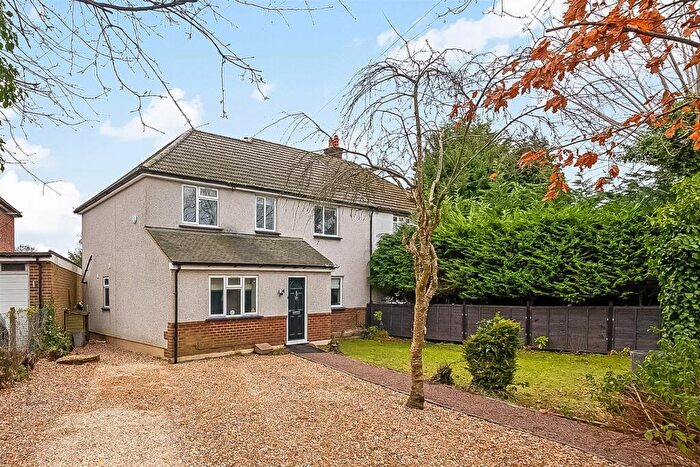
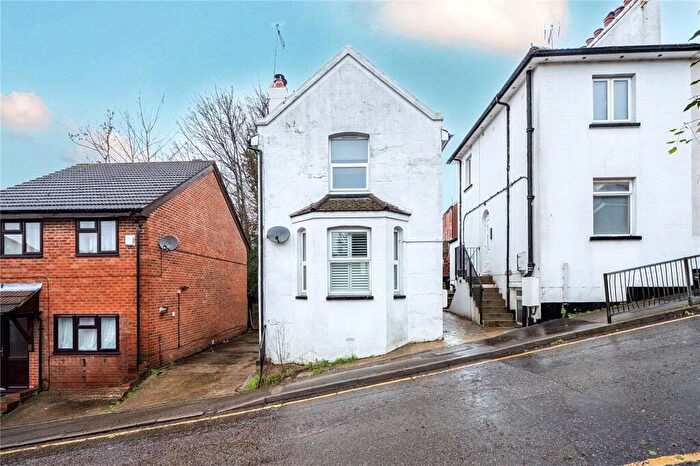
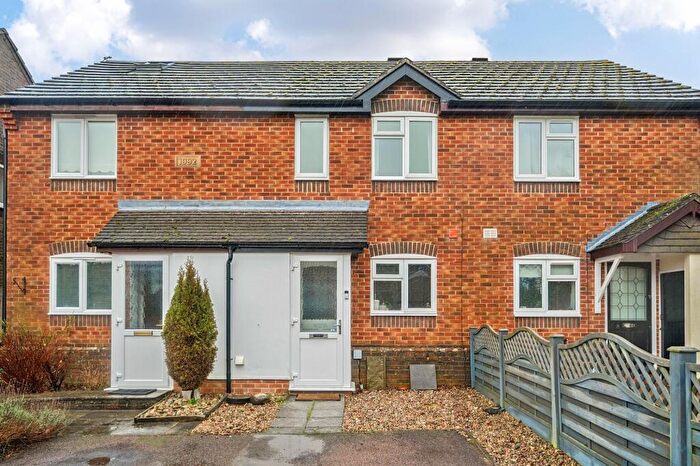
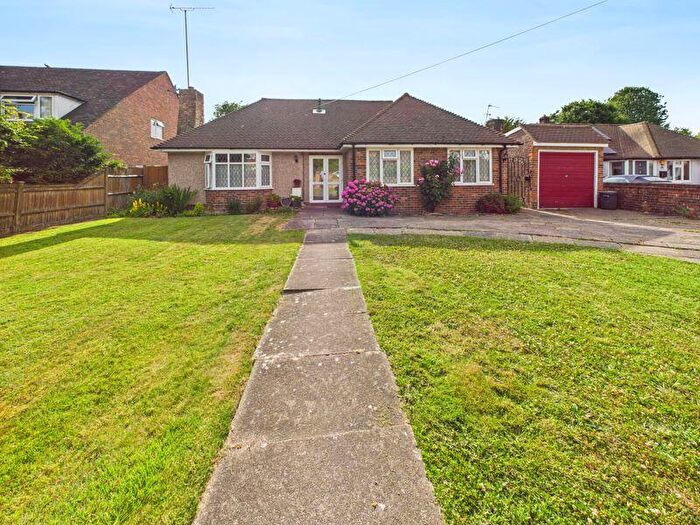
Houses for sale & to rent in Queens Park, Caterham
House Prices in Queens Park
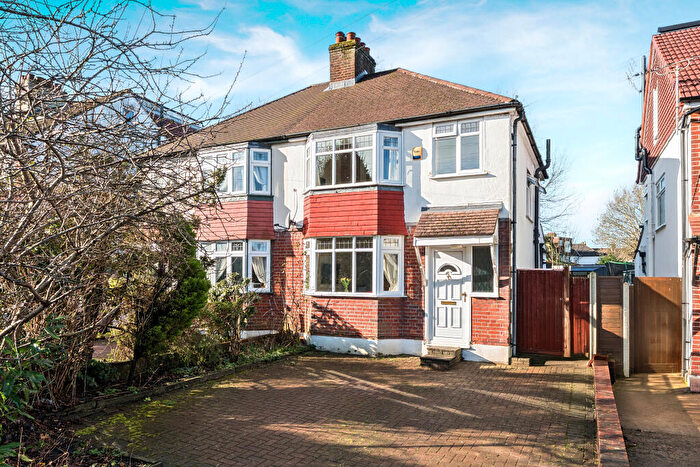
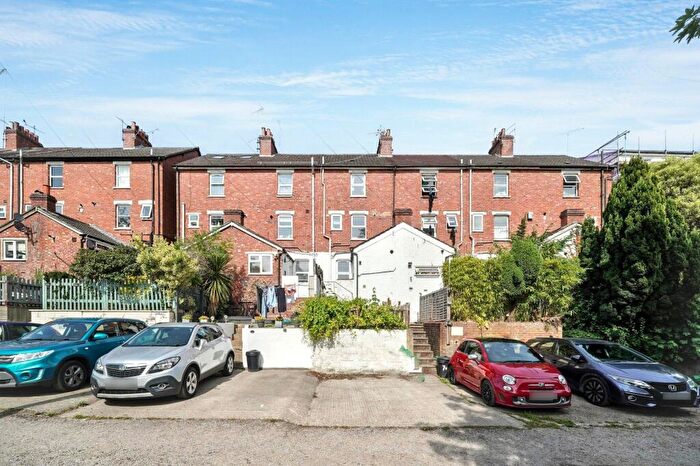
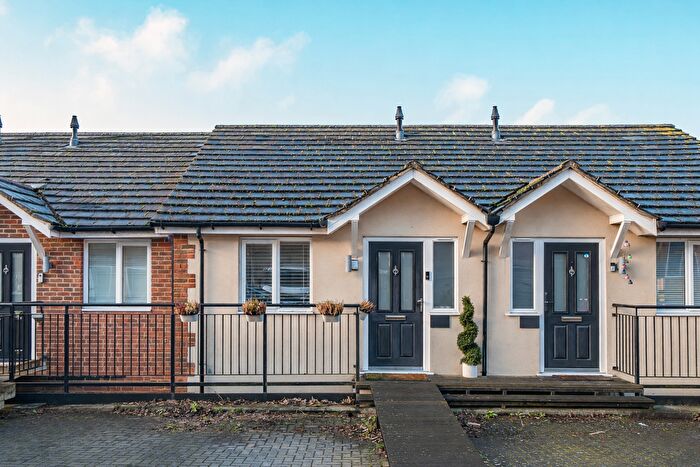
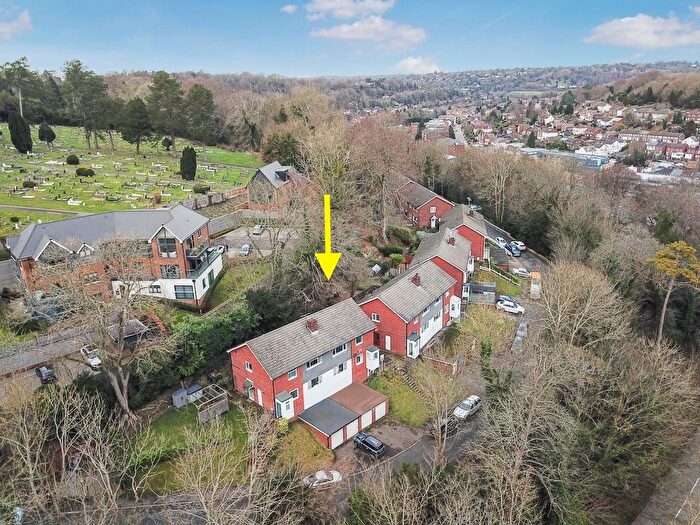
Properties in Queens Park have an average house price of £486,276.00 and had 186 Property Transactions within the last 3 years¹.
Queens Park is an area in Caterham, Surrey with 1,553 households², where the most expensive property was sold for £1,270,000.00.
Properties for sale in Queens Park
Roads and Postcodes in Queens Park
Navigate through our locations to find the location of your next house in Queens Park, Caterham for sale or to rent.
| Streets | Postcodes |
|---|---|
| Auckland Road | CR3 5TU |
| Avenue Road | CR3 5TR |
| Banstead Road | CR3 5QG CR3 5QH |
| Birch Avenue | CR3 5RU CR3 5RW CR3 5RY CR3 5RZ |
| Brambles Close | CR3 5UP |
| Broad Walk | CR3 5EP |
| Burntwood Lane | CR3 5UL |
| Caterham Court | CR3 6FF |
| Chaldon Road | CR3 5PE CR3 5PF CR3 5PG CR3 5PH CR3 5PJ CR3 5PL CR3 5PN CR3 5XB |
| Church Road | CR3 5RA |
| Court Road | CR3 5RD CR3 5RE CR3 5RF CR3 5RG CR3 5RH CR3 5RJ |
| Essendene Close | CR3 5PD |
| Essendene Road | CR3 5PA CR3 5PB |
| Furrows Place | CR3 5EH |
| Heath Road | CR3 5RP CR3 5RQ CR3 5RR CR3 5RS |
| High Street | CR3 5UA CR3 5UB CR3 5UD CR3 5UE CR3 5UF CR3 5UH CR3 5UX |
| Highview | CR3 6AY |
| Highwoods | CR3 6AX |
| Homesdale Road | CR3 5QZ |
| Homestead Road | CR3 5RL CR3 5RN |
| London Road | CR3 5PQ |
| Manor Avenue | CR3 6AN CR3 6AP |
| Money Avenue | CR3 5TH |
| Money Road | CR3 5TE CR3 5TF |
| Nelson Road | CR3 5PP |
| Oak Road | CR3 5TS CR3 5TT |
| Oaktree Walk | CR3 5JZ |
| Oakwood Rise | CR3 6YF |
| Orchard End | CR3 5UR |
| Park Avenue | CR3 6AH |
| Park Road | CR3 5TA CR3 5TB CR3 5TD |
| Pepper Close | CR3 6BJ |
| Pine Walk | CR3 5EN |
| Poplar Walk | CR3 5US |
| Queens Park Road | CR3 5RB |
| St Marys Mount | CR3 6SJ |
| Stanstead Close | CR3 6DY CR3 6DZ |
| Stanstead Road | CR3 6AA CR3 6AB CR3 6AD |
| Taunton Avenue | CR3 5EB |
| Town End | CR3 5UG CR3 5UJ |
| Town End Close | CR3 5UQ CR3 5UT |
| Waller Lane | CR3 5EA |
| White Hill Close | CR3 6EY |
| Whyteleafe Road | CR3 5EE CR3 5EF CR3 5EG |
| Wood Lane | CR3 5RT |
| Woodside Close | CR3 6AU |
Transport near Queens Park
-
Caterham Station
-
Whyteleafe South Station
-
Upper Warlingham Station
-
Woldingham Station
-
Whyteleafe Station
-
Kenley Station
-
Coulsdon South Station
-
Merstham Station
- FAQ
- Price Paid By Year
- Property Type Price
Frequently asked questions about Queens Park
What is the average price for a property for sale in Queens Park?
The average price for a property for sale in Queens Park is £486,276. This amount is 8% lower than the average price in Caterham. There are 1,684 property listings for sale in Queens Park.
What streets have the most expensive properties for sale in Queens Park?
The streets with the most expensive properties for sale in Queens Park are Highwoods at an average of £1,095,000, Manor Avenue at an average of £1,003,750 and Whyteleafe Road at an average of £881,818.
What streets have the most affordable properties for sale in Queens Park?
The streets with the most affordable properties for sale in Queens Park are Furrows Place at an average of £239,900, Banstead Road at an average of £265,000 and Chaldon Road at an average of £275,889.
Which train stations are available in or near Queens Park?
Some of the train stations available in or near Queens Park are Caterham, Whyteleafe South and Upper Warlingham.
Property Price Paid in Queens Park by Year
The average sold property price by year was:
| Year | Average Sold Price | Price Change |
Sold Properties
|
|---|---|---|---|
| 2025 | £503,412 | 1% |
58 Properties |
| 2024 | £499,021 | 9% |
69 Properties |
| 2023 | £454,526 | -12% |
59 Properties |
| 2022 | £509,280 | 7% |
64 Properties |
| 2021 | £471,720 | 9% |
78 Properties |
| 2020 | £429,514 | -5% |
58 Properties |
| 2019 | £452,471 | 3% |
68 Properties |
| 2018 | £439,502 | -8% |
57 Properties |
| 2017 | £475,425 | 23% |
74 Properties |
| 2016 | £364,245 | 1% |
77 Properties |
| 2015 | £360,870 | 9% |
66 Properties |
| 2014 | £327,362 | 3% |
79 Properties |
| 2013 | £318,495 | 4% |
61 Properties |
| 2012 | £307,340 | -4% |
76 Properties |
| 2011 | £319,812 | -4% |
60 Properties |
| 2010 | £331,650 | 26% |
44 Properties |
| 2009 | £243,849 | -30% |
47 Properties |
| 2008 | £317,764 | -3% |
54 Properties |
| 2007 | £328,836 | 17% |
101 Properties |
| 2006 | £273,301 | 13% |
85 Properties |
| 2005 | £238,363 | -13% |
69 Properties |
| 2004 | £269,654 | 18% |
90 Properties |
| 2003 | £221,124 | 3% |
100 Properties |
| 2002 | £214,225 | 9% |
97 Properties |
| 2001 | £195,785 | 23% |
83 Properties |
| 2000 | £149,914 | 16% |
90 Properties |
| 1999 | £126,006 | -7% |
103 Properties |
| 1998 | £135,151 | 16% |
116 Properties |
| 1997 | £113,992 | 16% |
68 Properties |
| 1996 | £95,699 | -28% |
60 Properties |
| 1995 | £122,211 | - |
51 Properties |
Property Price per Property Type in Queens Park
Here you can find historic sold price data in order to help with your property search.
The average Property Paid Price for specific property types in the last three years are:
| Property Type | Average Sold Price | Sold Properties |
|---|---|---|
| Semi Detached House | £528,850.00 | 50 Semi Detached Houses |
| Detached House | £785,755.00 | 42 Detached Houses |
| Terraced House | £425,305.00 | 27 Terraced Houses |
| Flat | £291,343.00 | 67 Flats |

