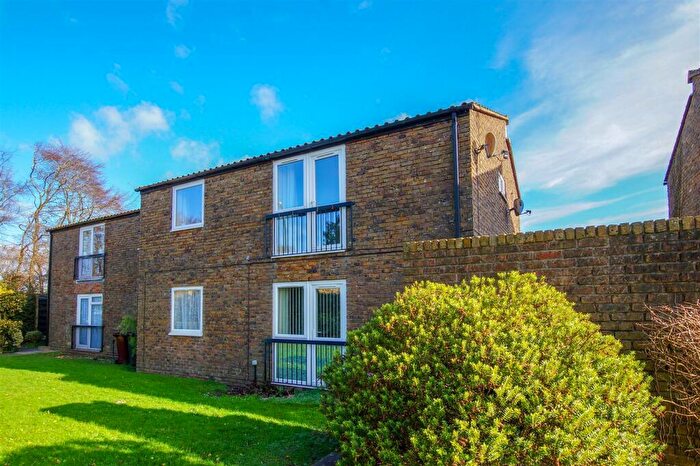
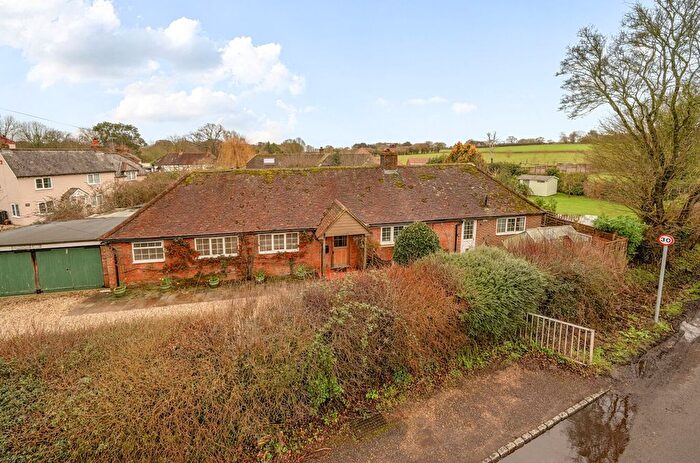
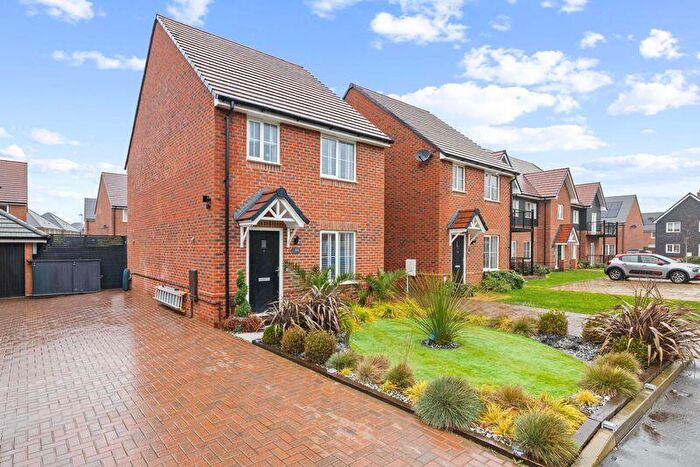
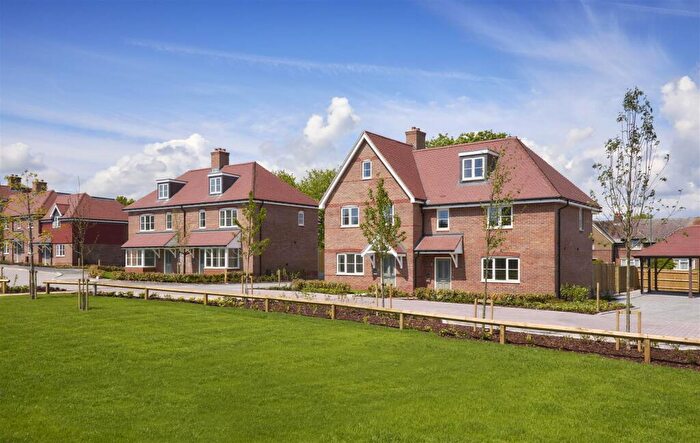
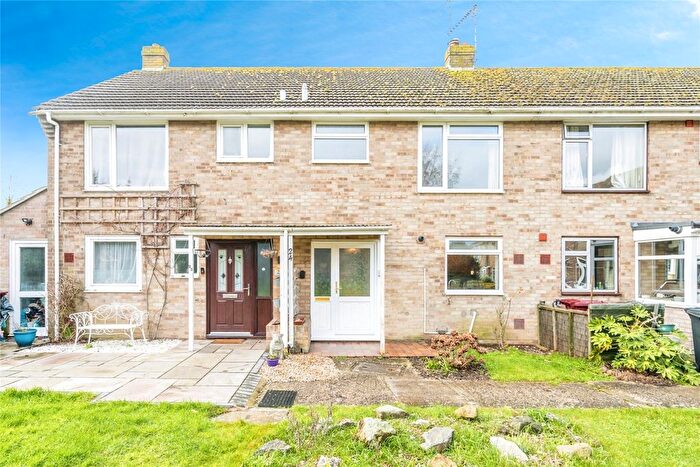
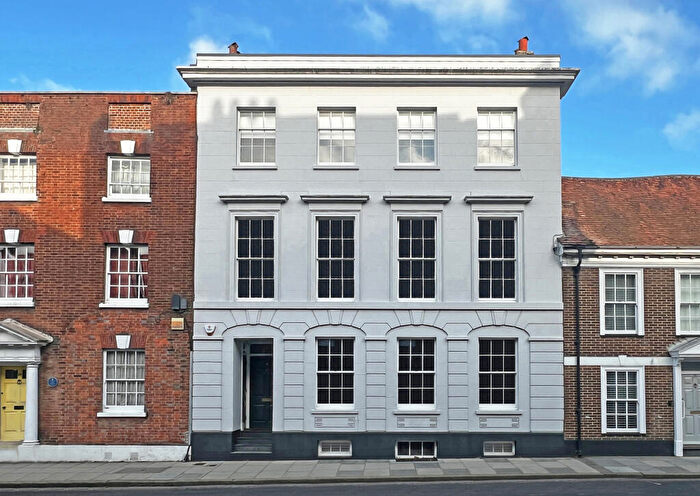
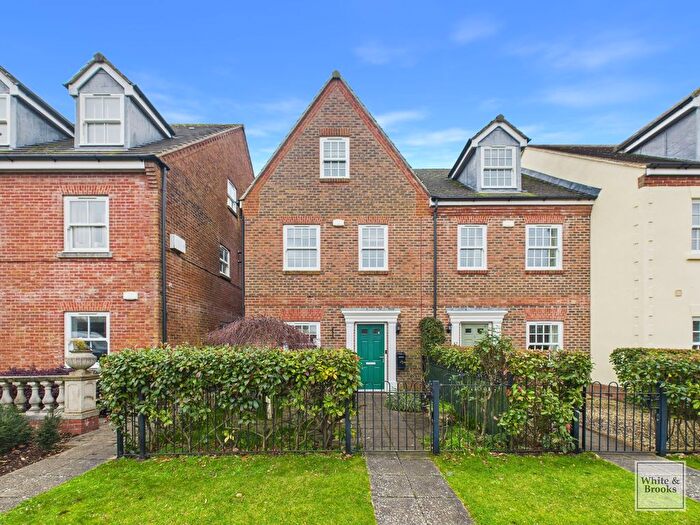
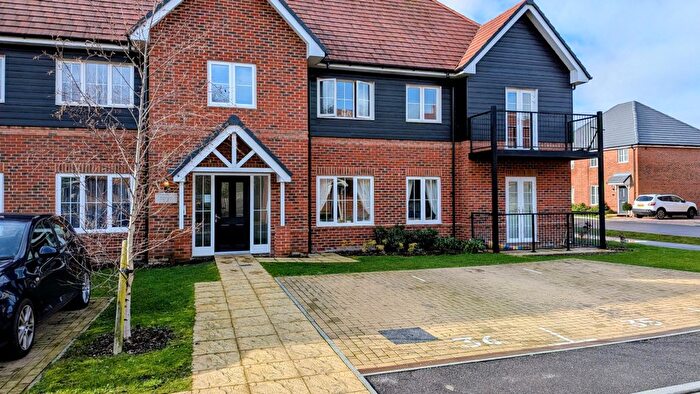
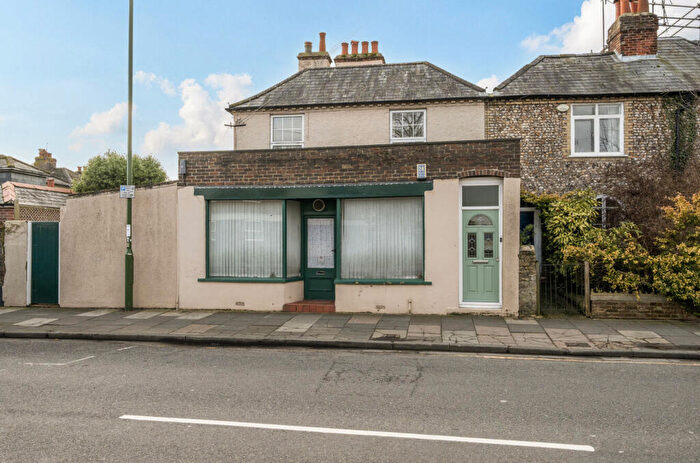
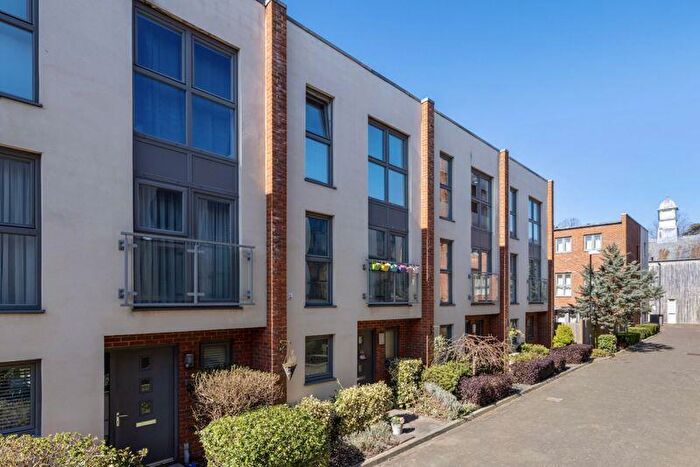
Houses for sale & to rent in Lavant, Chichester
House Prices in Lavant
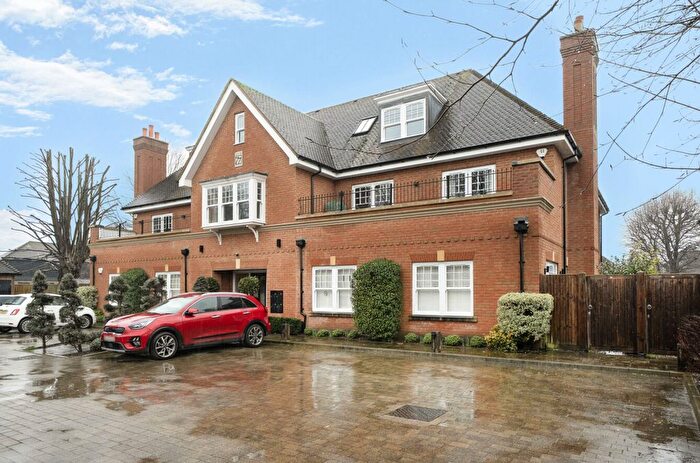
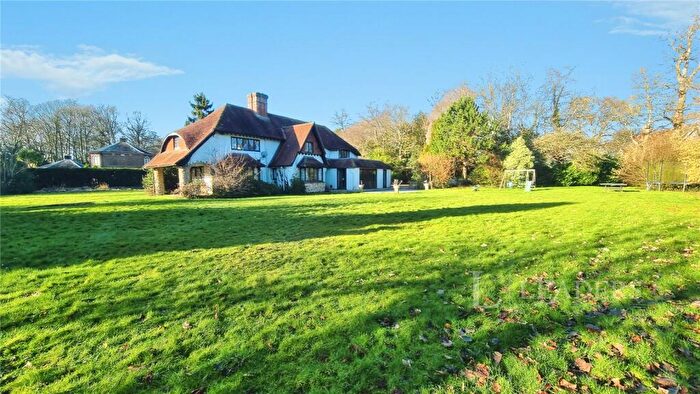
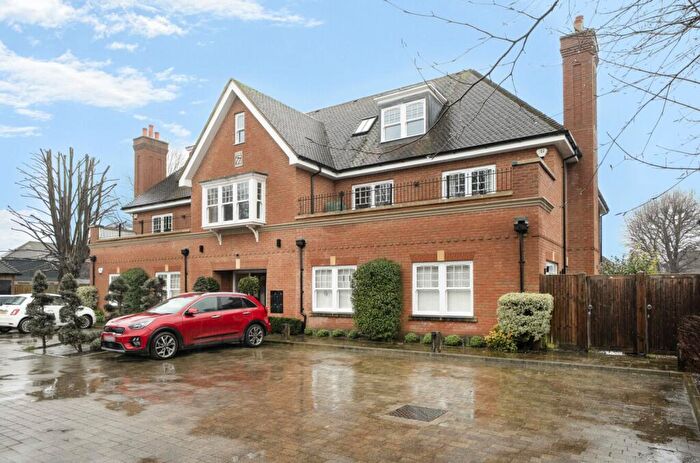
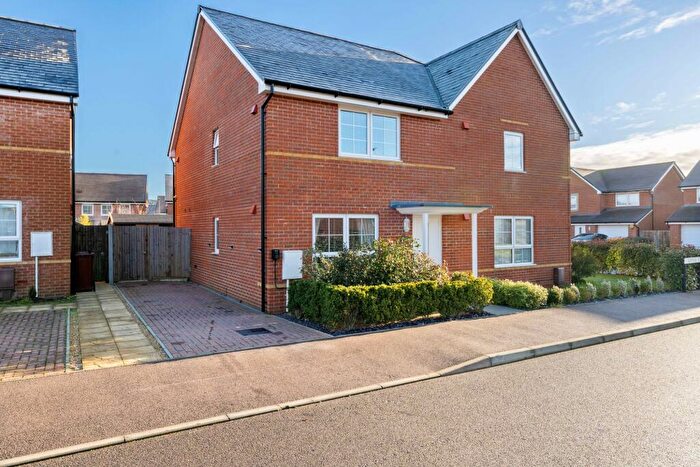
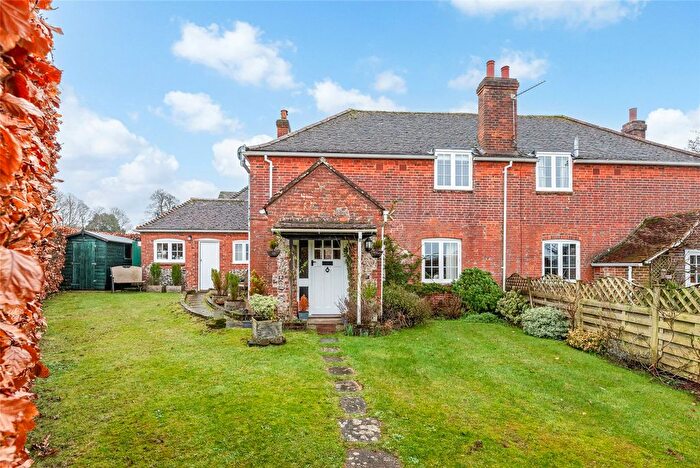
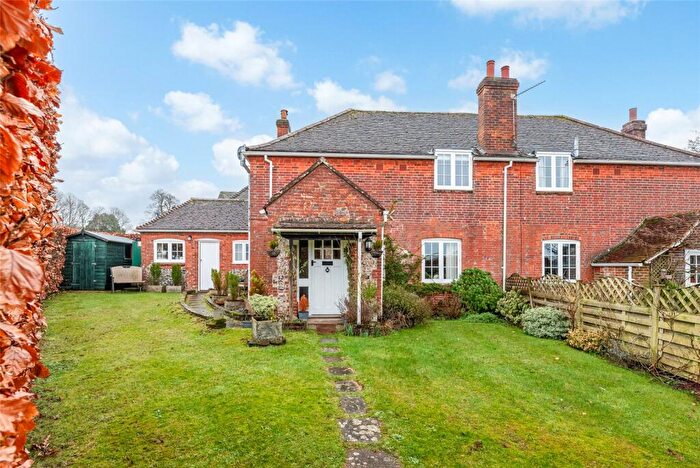
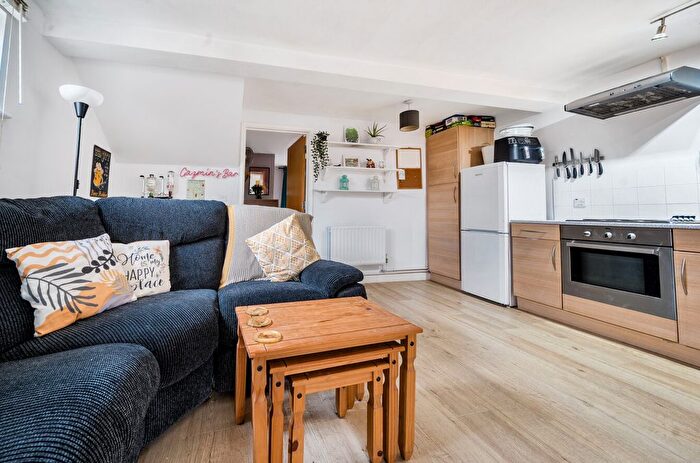
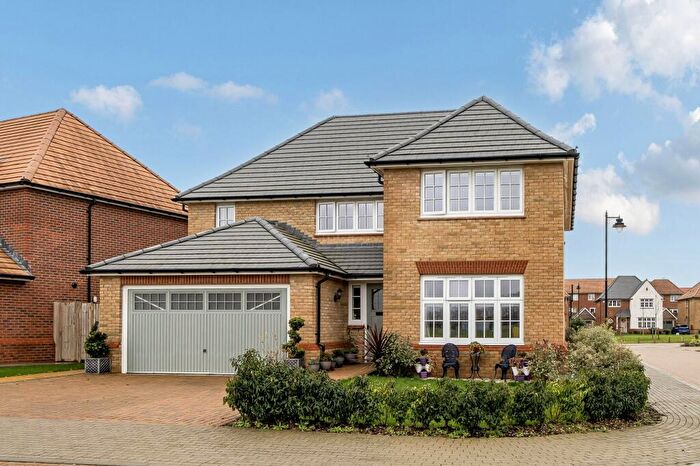
Properties in Lavant have an average house price of £622,027.00 and had 71 Property Transactions within the last 3 years¹.
Lavant is an area in Chichester, Surrey with 965 households², where the most expensive property was sold for £2,535,000.00.
Properties for sale in Lavant
Roads and Postcodes in Lavant
Navigate through our locations to find the location of your next house in Lavant, Chichester for sale or to rent.
| Streets | Postcodes |
|---|---|
| April Gardens | PO18 0FD |
| Bleaches Court | PO18 0FE |
| Bowhill Lane | PO18 9BS |
| Chilgrove Road | PO18 9HL |
| Churchmead Close | PO18 0AY |
| Claypit Lane | PO18 0NU |
| Coach Road | PO18 0NX |
| Common Road | PO18 9AE PO18 9PD |
| Dairy Lane | PO18 0PE |
| Downs Road | PO18 9BE PO18 9BJ PO18 9BT PO18 9BU |
| Downview Close | PO18 0BZ |
| Eastview Close | PO18 0DN |
| Fordwater Cottages | PO18 0AP |
| Furze Close | PO18 0SW |
| Gaston Way | PO18 0DQ |
| Hambrook Business Centre | PO18 8XP |
| Hayes Close | PO18 0DW |
| Heron Close | PO18 0DR |
| Hunters Race | PO19 3BZ PO19 5UD |
| Kiln Walk | PO18 0SG |
| Kingley Centre | PO18 9HJ |
| Lavant Down Road | PO18 0DJ |
| Lillywhite Road | PO18 0SQ |
| Lower Road | PO18 0AG PO18 0AQ |
| Lye Lane | PO18 9BB PO18 9DD |
| Madgwick Lane | PO18 0NR |
| Meadow Close | PO18 0FJ |
| Midhurst Road | PO18 0BP PO18 0DA PO18 0DE PO18 0EW |
| Moutheys Lane | PO18 8AA |
| Mudberry Lane | PO18 8TS |
| Newells Lane | PO18 8DE |
| Northside | PO18 0BX |
| Old Arundel Road | PO18 0TH |
| Old Place Lane | PO18 0NL |
| Oldwick Meadows | PO18 0BE |
| Orchard Cottages | PO18 0BQ |
| Pook Lane | PO18 0AD PO18 0AH PO18 0AR PO18 0AS PO18 0AU PO18 0AW PO18 0AX PO18 0SA |
| Portal Close | PO18 8AQ |
| Potters Green | PO18 0SN |
| Raughmere Drive | PO18 0AB PO18 0DT |
| Richmond Road | PO18 0PQ |
| Roman Fields | PO19 5AB |
| Scant Road East | PO18 8UB |
| Shop Lane | PO18 0BA |
| Springfield Close | PO18 0AZ |
| St Marys Close | PO18 0DL |
| St Nicholas Road | PO18 0BS PO18 0BT PO18 0BU |
| St Roches Close | PO18 0DP |
| Stane Street | PO18 0NT PO18 0PA PO18 0PB |
| The Close | PO18 0BD |
| The Sadlers | PO18 0PR |
| Tilemakers Close | PO18 0RN PO18 0RZ |
| Town Lane | PO18 0SP |
| Trundle Close | PO18 0BY |
| Turnpike Cottages | PO18 0AA |
| Wealden Drive | PO18 0SF |
| West Lavant Cottages | PO18 9AH |
| West Stoke Road | PO19 3PL PO18 9AA |
| Yarbrook | PO18 0DF |
| PO18 0AJ PO18 0BB PO18 0BG PO18 0BH PO18 0BJ PO18 0BL PO18 0BW PO18 0PF PO18 0PG PO18 9AD PO18 9AY PO18 9AB PO18 9AJ PO18 9AN PO18 9BA PO18 9DA PO18 9DJ PO18 9DW |
Transport near Lavant
- FAQ
- Price Paid By Year
- Property Type Price
Frequently asked questions about Lavant
What is the average price for a property for sale in Lavant?
The average price for a property for sale in Lavant is £622,027. This amount is 28% higher than the average price in Chichester. There are 5,972 property listings for sale in Lavant.
What streets have the most expensive properties for sale in Lavant?
The streets with the most expensive properties for sale in Lavant are Lye Lane at an average of £2,249,250, Common Road at an average of £1,600,000 and Lower Road at an average of £1,335,000.
What streets have the most affordable properties for sale in Lavant?
The streets with the most affordable properties for sale in Lavant are Tilemakers Close at an average of £227,500, Lillywhite Road at an average of £300,000 and Richmond Road at an average of £335,000.
Which train stations are available in or near Lavant?
Some of the train stations available in or near Lavant are Fishbourne, Chichester and Bosham.
Property Price Paid in Lavant by Year
The average sold property price by year was:
| Year | Average Sold Price | Price Change |
Sold Properties
|
|---|---|---|---|
| 2025 | £495,113 | -53% |
22 Properties |
| 2024 | £756,414 | 29% |
32 Properties |
| 2023 | £533,306 | 13% |
17 Properties |
| 2022 | £464,000 | -16% |
26 Properties |
| 2021 | £539,659 | 7% |
41 Properties |
| 2020 | £501,727 | -7% |
22 Properties |
| 2019 | £535,130 | -23% |
21 Properties |
| 2018 | £655,974 | 30% |
35 Properties |
| 2017 | £458,041 | -4% |
35 Properties |
| 2016 | £477,363 | 4% |
42 Properties |
| 2015 | £456,713 | 14% |
45 Properties |
| 2014 | £394,163 | 1% |
36 Properties |
| 2013 | £391,593 | 16% |
47 Properties |
| 2012 | £327,963 | -24% |
44 Properties |
| 2011 | £405,096 | 9% |
50 Properties |
| 2010 | £368,769 | 14% |
54 Properties |
| 2009 | £318,396 | 4% |
29 Properties |
| 2008 | £305,673 | -9% |
21 Properties |
| 2007 | £333,033 | 5% |
47 Properties |
| 2006 | £315,080 | 1% |
18 Properties |
| 2005 | £310,739 | 9% |
23 Properties |
| 2004 | £282,876 | -30% |
21 Properties |
| 2003 | £366,352 | 37% |
24 Properties |
| 2002 | £229,177 | 5% |
36 Properties |
| 2001 | £218,770 | -19% |
48 Properties |
| 2000 | £260,833 | 54% |
42 Properties |
| 1999 | £120,469 | -11% |
38 Properties |
| 1998 | £133,185 | 8% |
28 Properties |
| 1997 | £122,253 | 16% |
41 Properties |
| 1996 | £102,426 | 17% |
21 Properties |
| 1995 | £84,523 | - |
21 Properties |
Property Price per Property Type in Lavant
Here you can find historic sold price data in order to help with your property search.
The average Property Paid Price for specific property types in the last three years are:
| Property Type | Average Sold Price | Sold Properties |
|---|---|---|
| Semi Detached House | £409,412.00 | 32 Semi Detached Houses |
| Detached House | £1,110,147.00 | 22 Detached Houses |
| Terraced House | £436,750.00 | 14 Terraced Houses |
| Flat | £175,000.00 | 3 Flats |

