
Houses for sale in Chichester, Surrey
House Prices in Chichester
Properties in Chichester have an average house price of £482k and had 3,184 Property Transactions within the last 3 years.¹
Chichester is an area in Surrey with 34,359 households², where the most expensive property was sold for £6M.
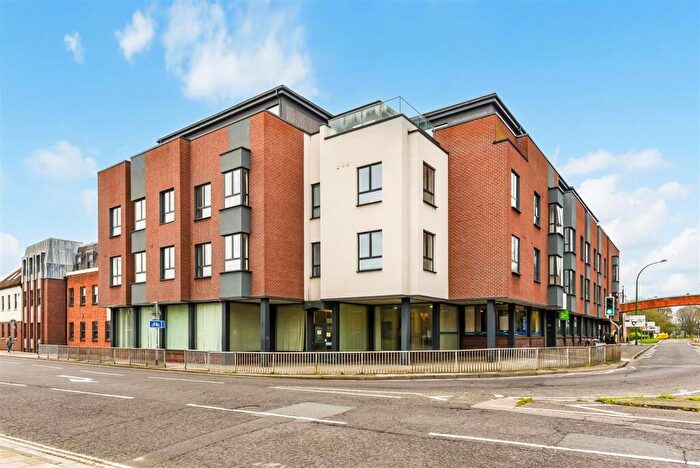
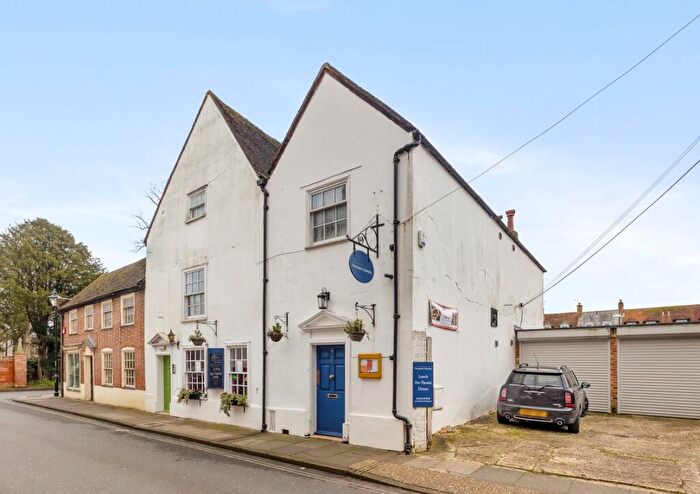
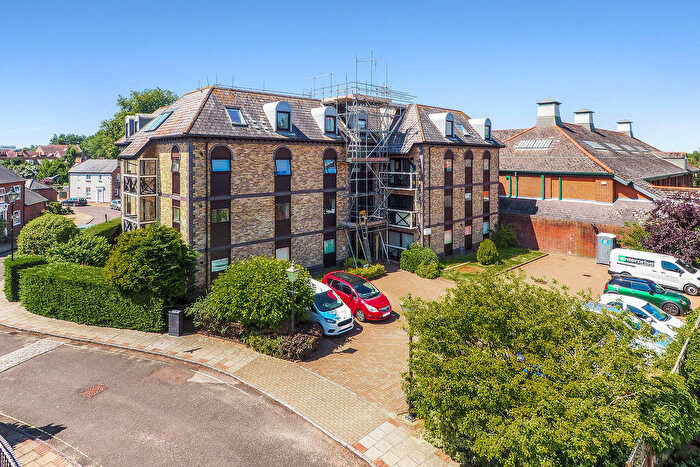
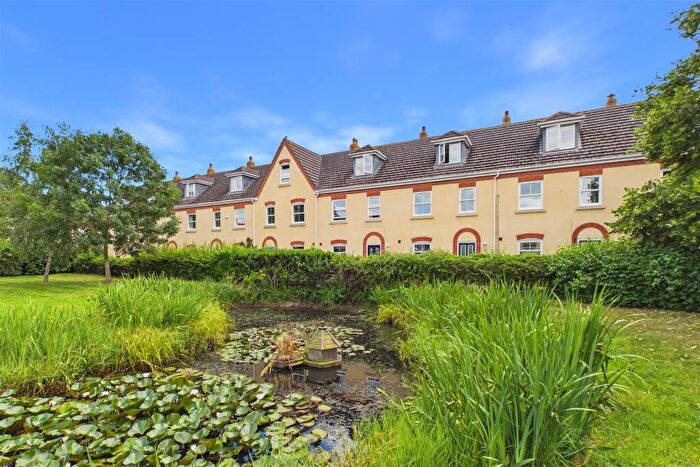
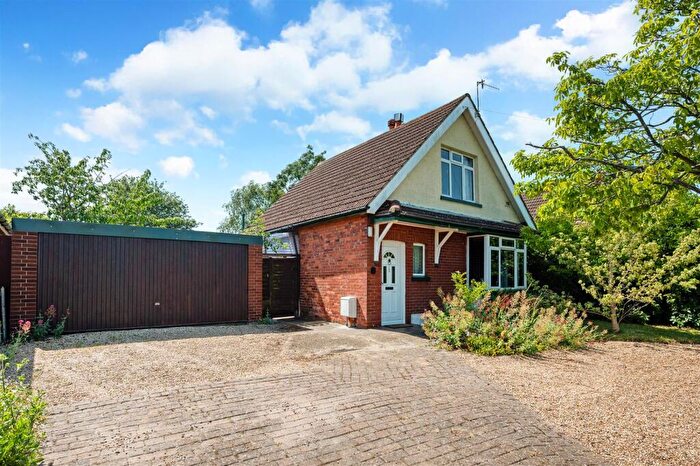
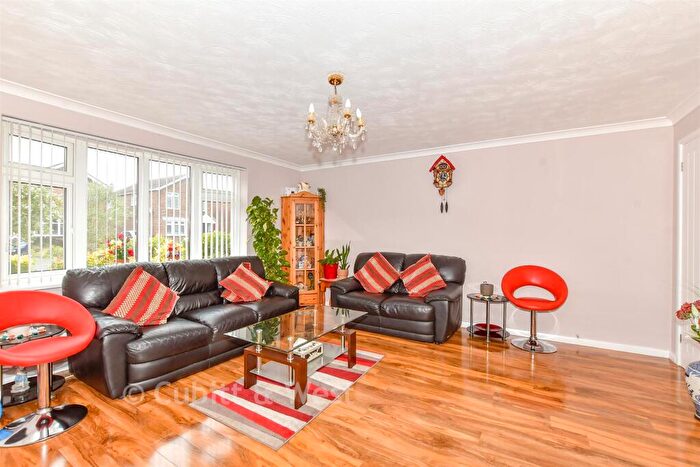
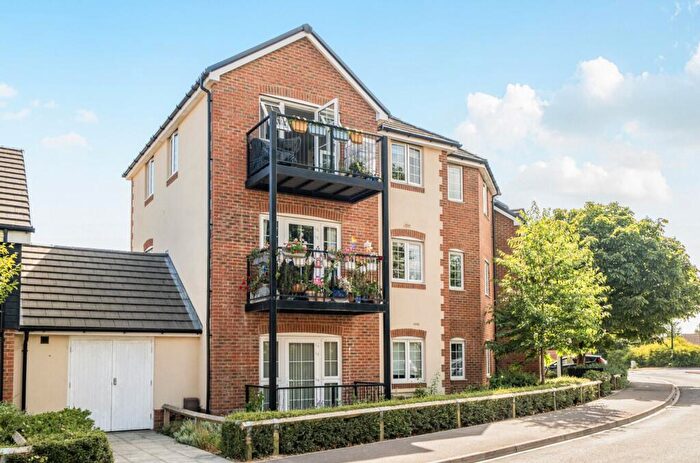
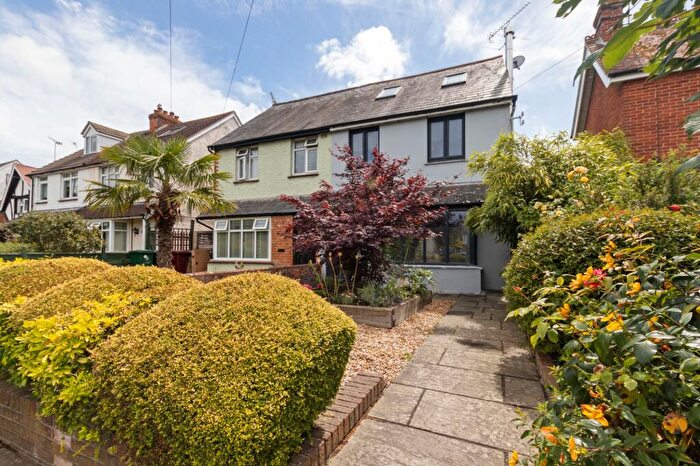
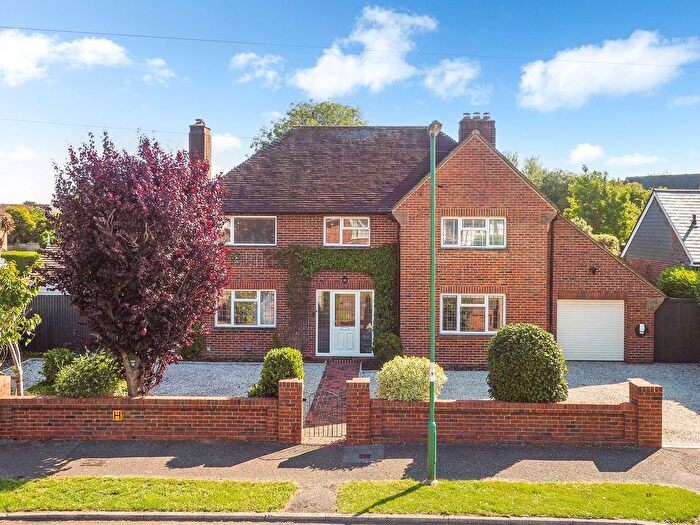
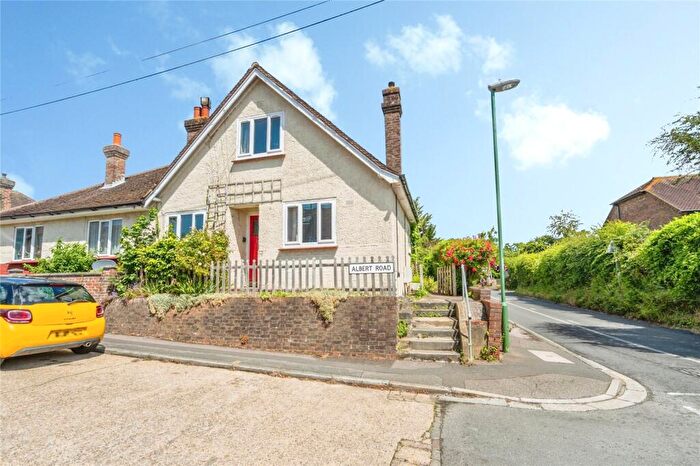
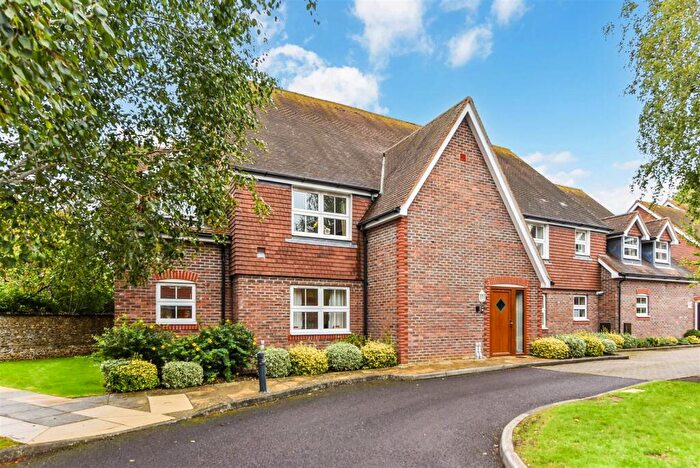
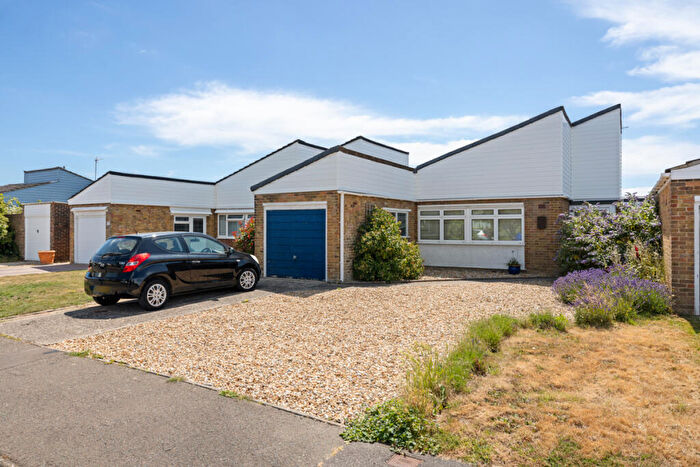
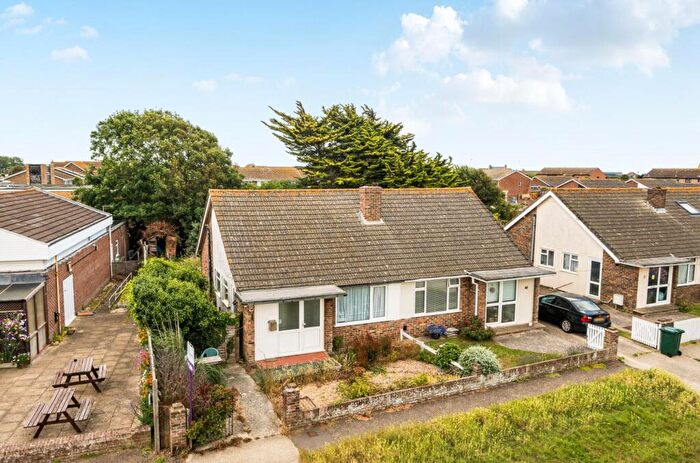
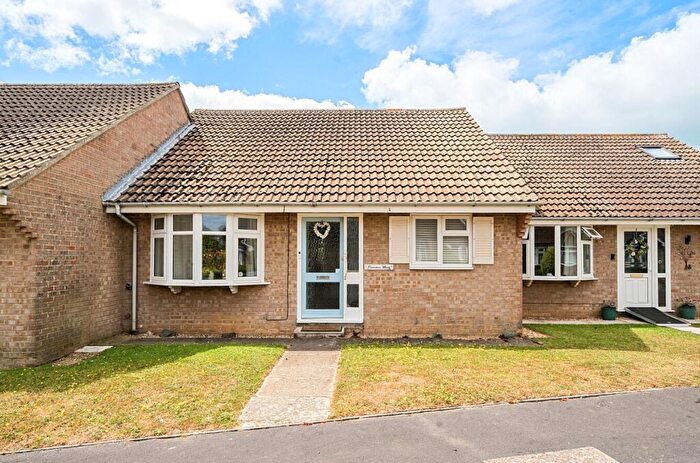
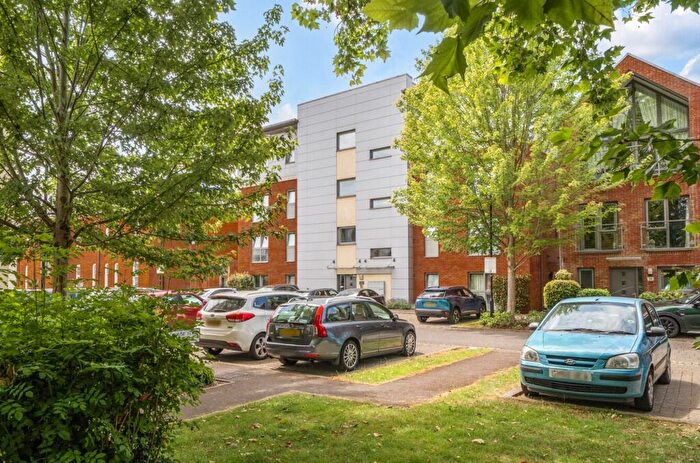
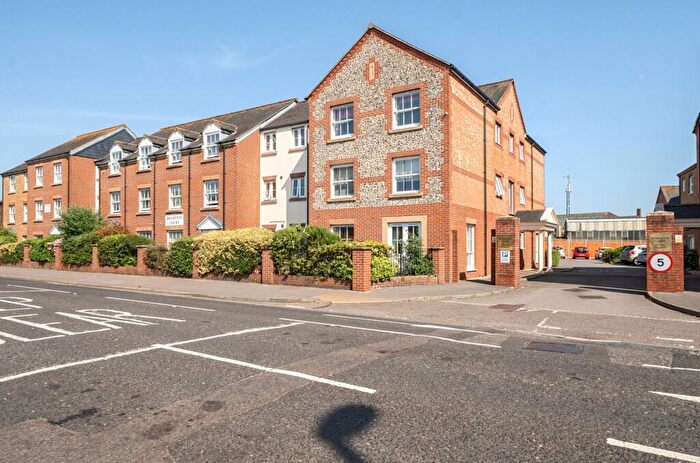
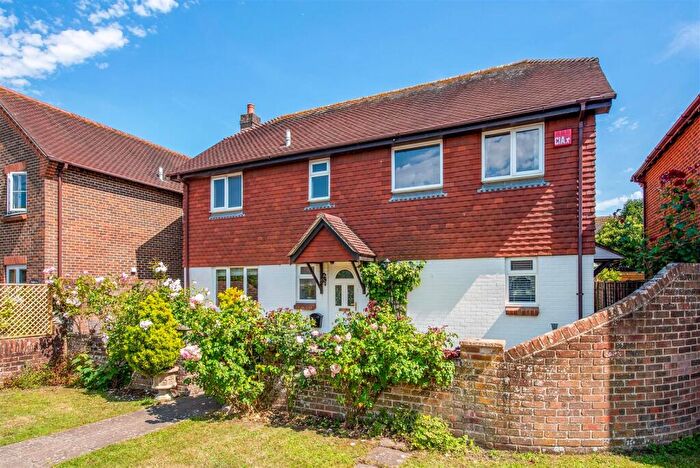
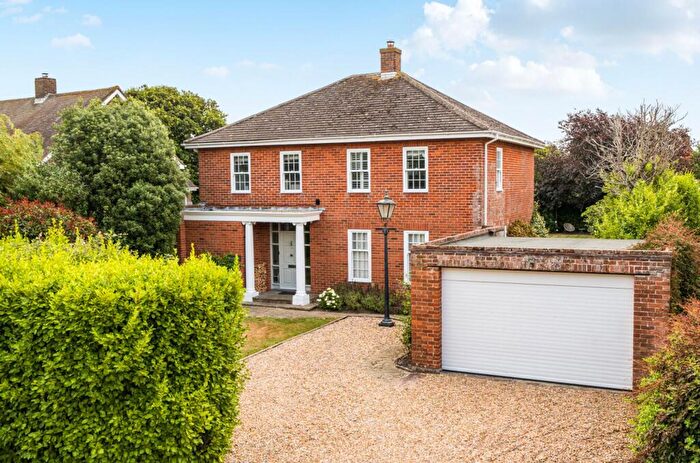
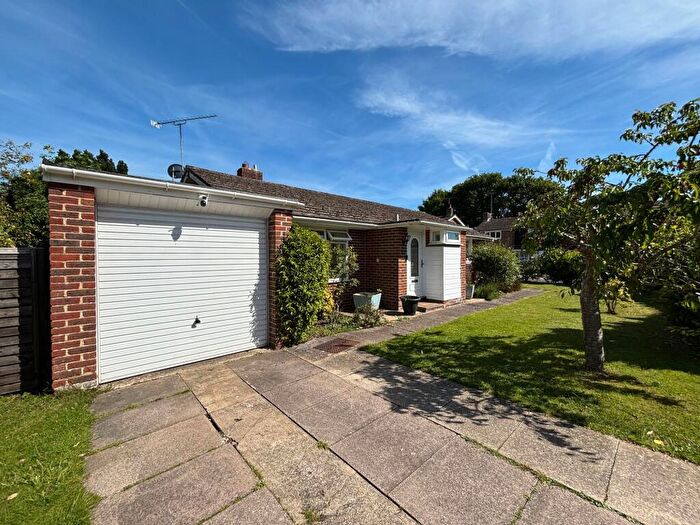
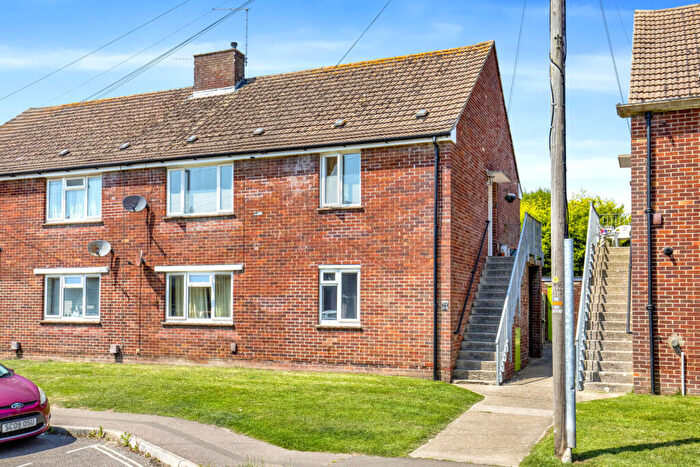
Properties for sale in Chichester
![]()
If you are looking to sell your house, let it out, or receive a property valuation, an expert can help you.
Click the button below to get started.
Neighbourhoods in Chichester
Navigate through our locations to find the location of your next house in Chichester, Surrey for sale or to rent.
- Bosham
- Boxgrove
- Chichester East
- Chichester North
- Chichester South
- Chichester West
- Donnington
- East Wittering
- Fishbourne
- Funtington
- Harting
- Lavant
- North Mundham
- Selsey North
- Selsey South
- Sidlesham
- Southbourne
- Stedham
- Tangmere
- West Wittering
- Westbourne
- Harbour Villages
- Chichester Central
- Goodwood
- North Mundham & Tangmere
- Sidlesham with Selsey North
- The Witterings
Property price trends in Chichester
According to the latest Land Registry data, the average home in Chichester sold for £426,894 in 2026. That figure comes from a substantial record of 45,685 sales logged over the past 31 years.
Prices have fallen back over the last three years. Compared with 2023, when the typical sale came in around £485,884, that's a fall of roughly 12.1%.
Looking back five years, average prices are down about 8.4% since 2021, a drop of around £39,331 in cash terms.
Zoom out to the past decade for the fuller picture. Back in 2016, homes here averaged £384,798, so the typical sold price has climbed about 10.9% since then, roughly 1% a year. Stretch the view to fifteen years and that annual pace edges up closer to 1.9%.
Frequently asked questions about Chichester
What is the average price for a property for sale in Chichester?
The average price for a property for sale in Chichester is £481,614. This amount is 21% lower than the average price in Surrey. There are more than 10,000 property listings for sale in Chichester.
What locations have the most expensive properties for sale in Chichester?
The locations with the most expensive properties for sale in Chichester are Westbourne at an average of £1,266,250, Harting at an average of £1,252,500 and West Wittering at an average of £853,272.
What locations have the most affordable properties for sale in Chichester?
The locations with the most affordable properties for sale in Chichester are North Mundham & Tangmere at an average of £255,496, Chichester East at an average of £313,205 and Selsey North at an average of £331,593.
Which train stations are available in or near Chichester?
Some of the train stations available in or near Chichester are Chichester, Fishbourne and Bosham.
Property Price Paid in Chichester by Year
The average sold property price by year was:
| Year | Average Sold Price | Price Change |
Sold Properties
|
|---|---|---|---|
| 2026 | £426,894 | -13% |
85 Properties |
| 2025 | £480,845 | -0,4% |
965 Properties |
| 2024 | £482,559 | -1% |
1,118 Properties |
| 2023 | £485,884 | -6% |
1,016 Properties |
| 2022 | £515,634 | 10% |
1,262 Properties |
| 2021 | £466,225 | 3% |
1,724 Properties |
| 2020 | £453,930 | 11% |
1,289 Properties |
| 2019 | £405,037 | -3% |
1,258 Properties |
| 2018 | £417,249 | 3% |
1,445 Properties |
| 2017 | £403,230 | 5% |
1,463 Properties |
Property Price per Property Type in Chichester
Here you can find historic sold price data in order to help with your property search.
The average Property Paid Price for specific property types in the last three years are:
| Property Type | Average Sold Price | Sold Properties |
|---|---|---|
| Semi Detached House | £409,752.00 | 760 Semi Detached Houses |
| Terraced House | £378,867.00 | 732 Terraced Houses |
| Detached House | £746,570.00 | 1,063 Detached Houses |
| Flat | £240,245.00 | 629 Flats |
Transport in Chichester
Please see below transportation links in this area:
