Houses for sale & to rent in Lovelace, Cobham
House Prices in Lovelace
Properties in Lovelace have no sales history available within the last 3 years.
Lovelace is an area in Cobham, Surrey with 43 households².
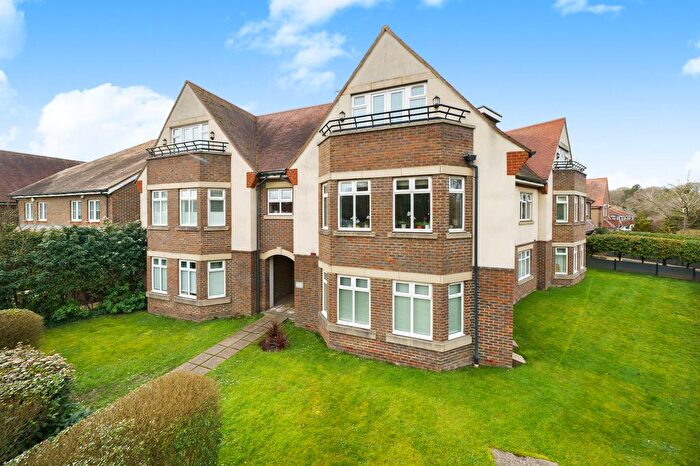
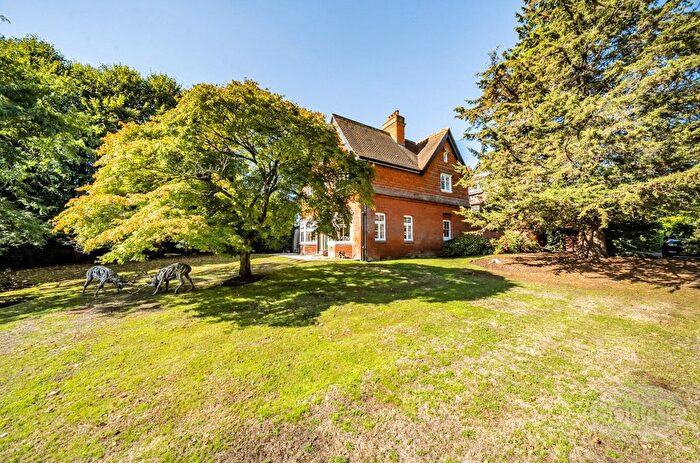
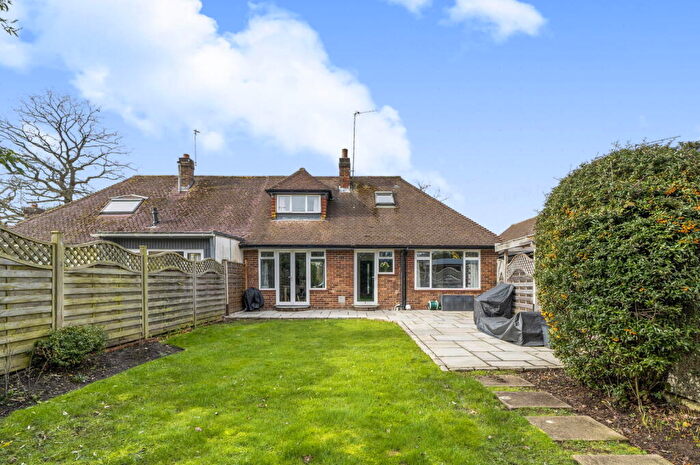
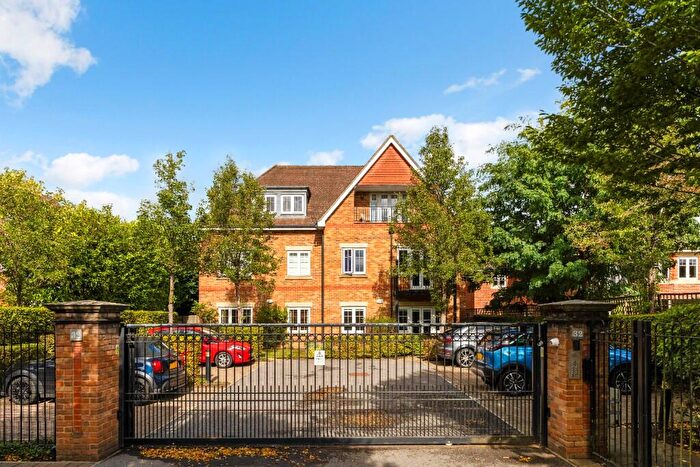
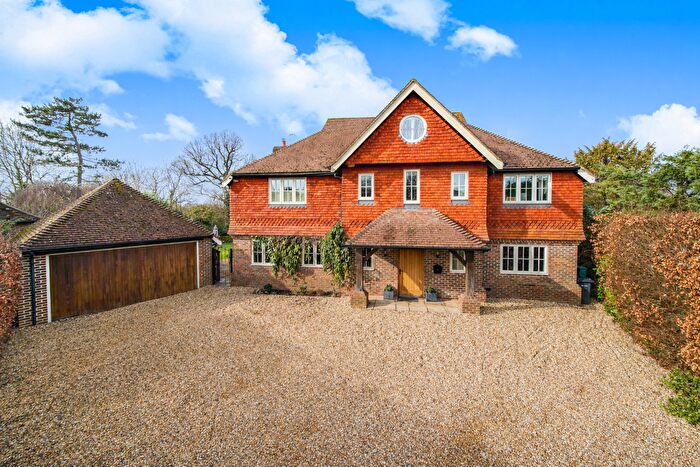
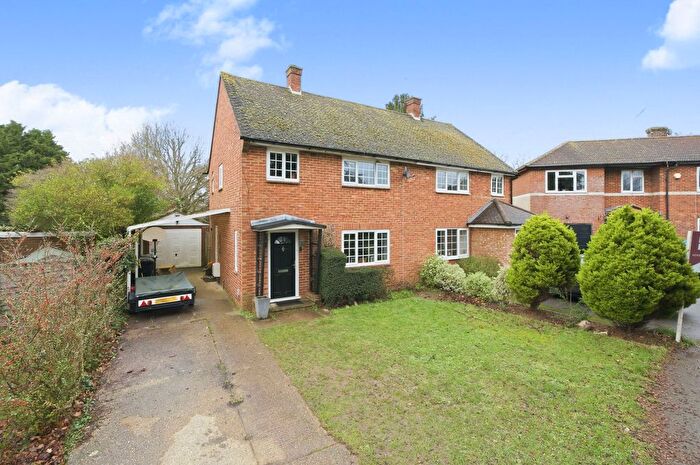
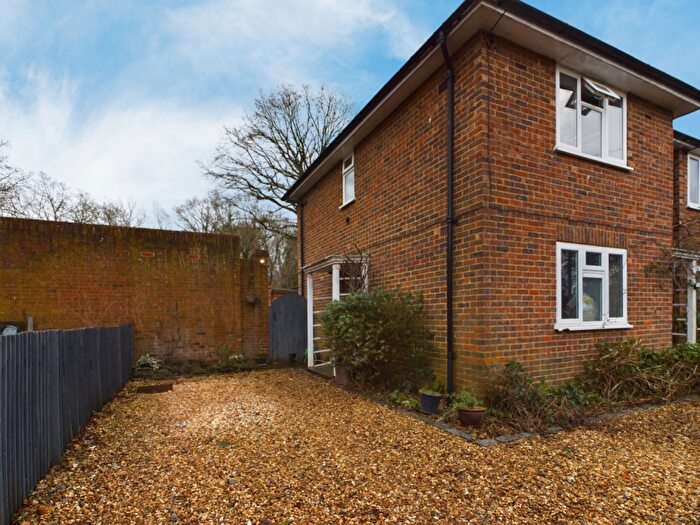
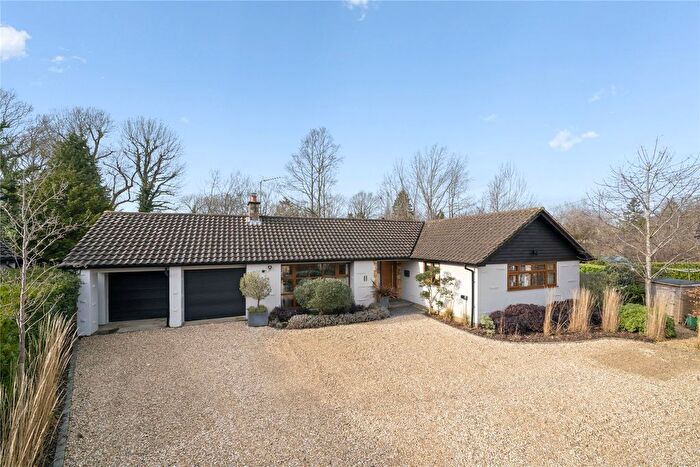
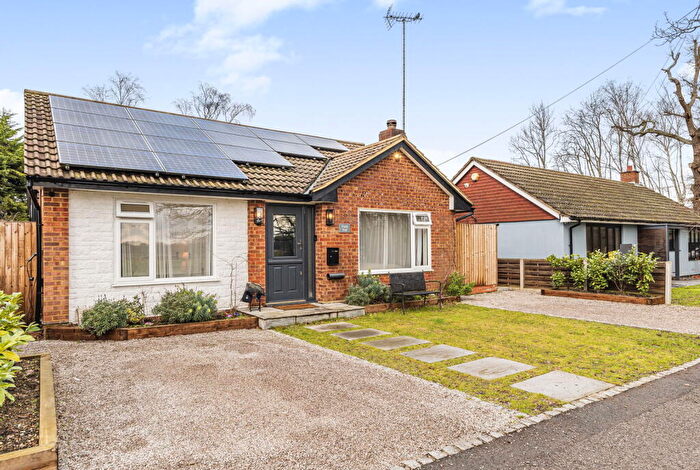
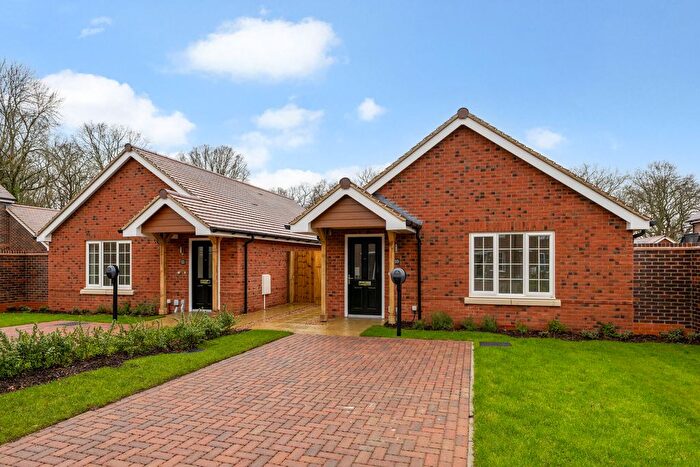
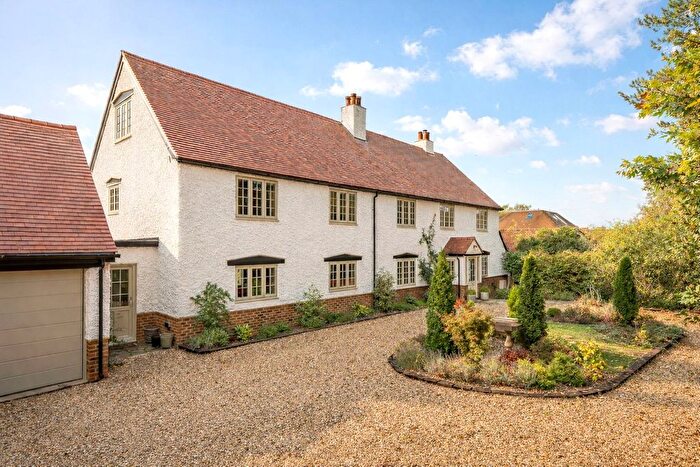
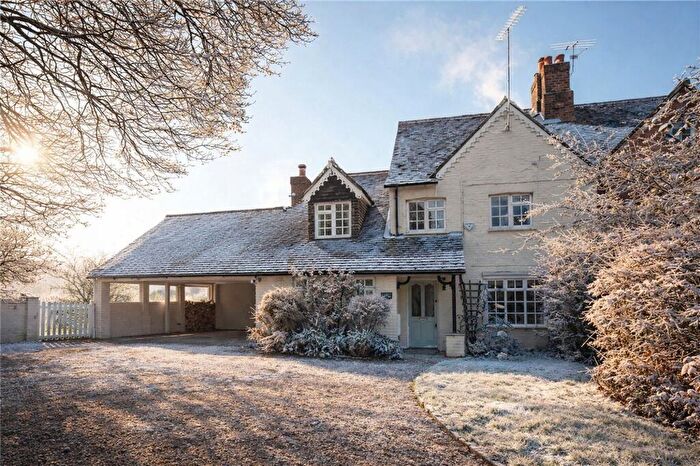
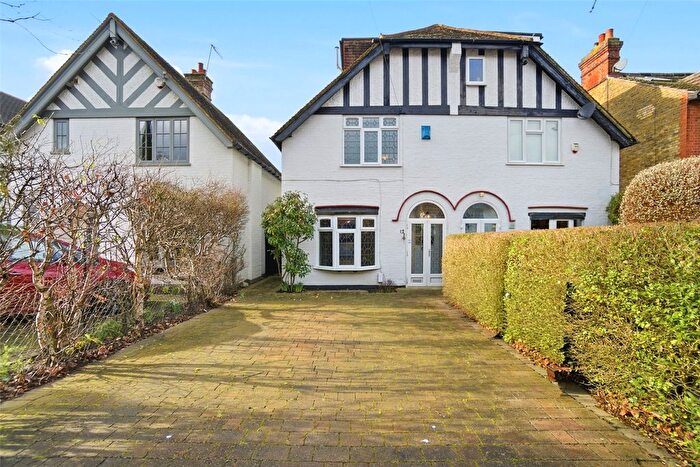
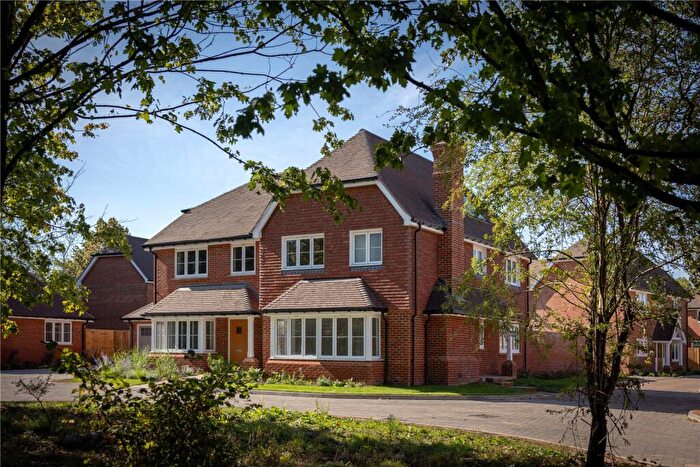
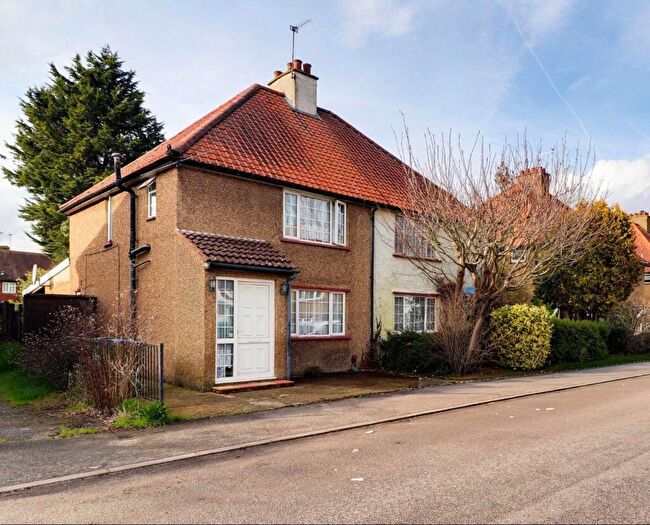
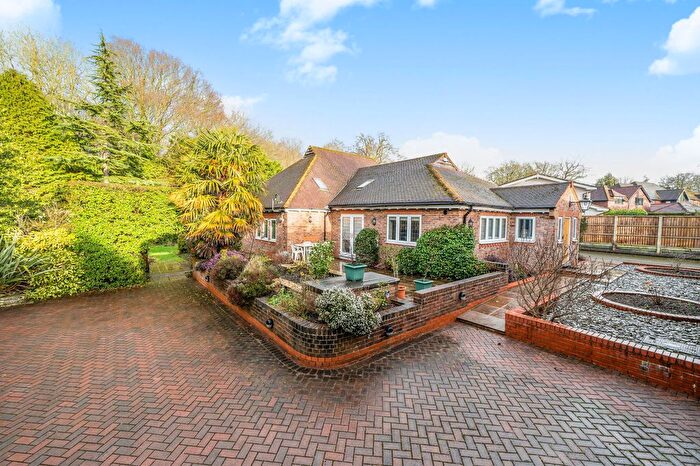
Properties for sale in Lovelace
Roads and Postcodes in Lovelace
Navigate through our locations to find the location of your next house in Lovelace, Cobham for sale or to rent.
| Streets | Postcodes |
|---|---|
| Hatch Lane | KT11 1NR |
| Horsley Road | KT11 3JY |
| Mays Green | KT11 1NJ |
| Ockham Lane | KT11 1LZ KT11 1LX KT11 1LY |
| Old Lane | KT11 1NE KT11 1NQ KT11 1NA KT11 1ND KT11 1NF KT11 1NH KT11 1NL |
| Redhill Road | KT11 1EG |
| Ripley Lane | KT24 6JT |
| The Gardens | KT11 1NB |
Transport near Lovelace
- FAQ
- Price Paid By Year
Frequently asked questions about Lovelace
Which train stations are available in or near Lovelace?
Some of the train stations available in or near Lovelace are Effingham Junction, Horsley and Cobham and Stoke D'abernon.
Property Price Paid in Lovelace by Year
The average sold property price by year was:
| Year | Average Sold Price | Price Change |
Sold Properties
|
|---|---|---|---|
| 2022 | £1,265,500 | 39% |
5 Properties |
| 2021 | £766,250 | -81% |
4 Properties |
| 2020 | £1,387,500 | -13% |
2 Properties |
| 2019 | £1,565,000 | 46% |
2 Properties |
| 2016 | £850,000 | -93% |
1 Property |
| 2014 | £1,636,420 | -31% |
2 Properties |
| 2011 | £2,150,000 | 41% |
1 Property |
| 2010 | £1,260,000 | 5% |
1 Property |
| 2008 | £1,193,333 | 38% |
3 Properties |
| 2007 | £735,000 | 1% |
1 Property |
| 2006 | £729,416 | 66% |
3 Properties |
| 2004 | £248,000 | -217% |
1 Property |
| 2000 | £785,000 | 54% |
1 Property |
| 1999 | £358,750 | 33% |
4 Properties |
| 1997 | £240,000 | - |
1 Property |

