
Houses for sale & to rent in Clandon And Horsley, Leatherhead
House Prices in Clandon And Horsley
Properties in Clandon And Horsley have an average house price of £1.13M and had 219 Property Transactions within the last 3 years¹.
Clandon And Horsley is an area in Leatherhead, Surrey with 2,712 households², where the most expensive property was sold for £3M.
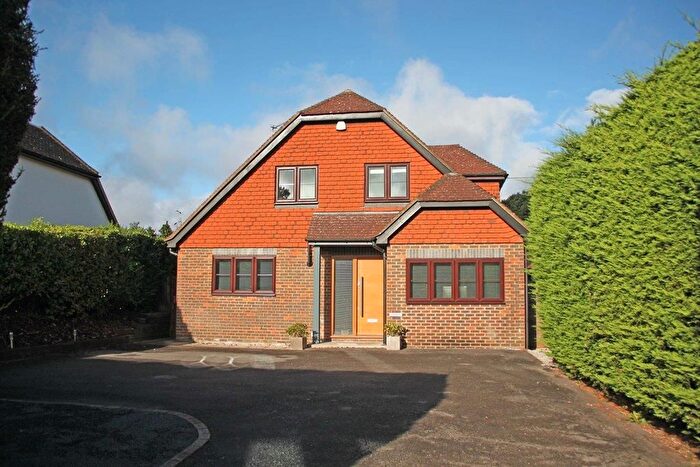
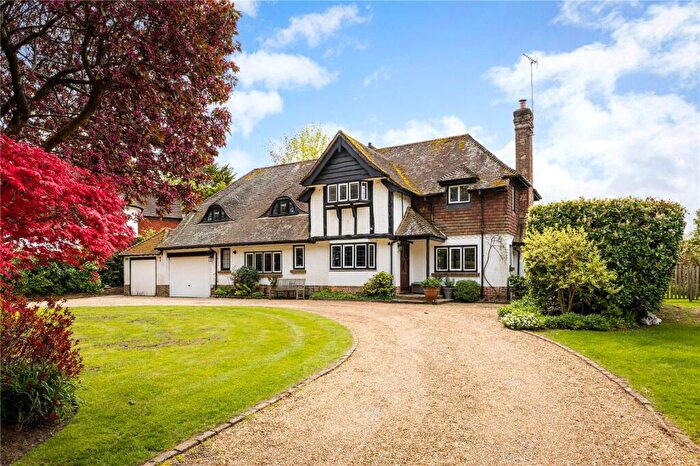
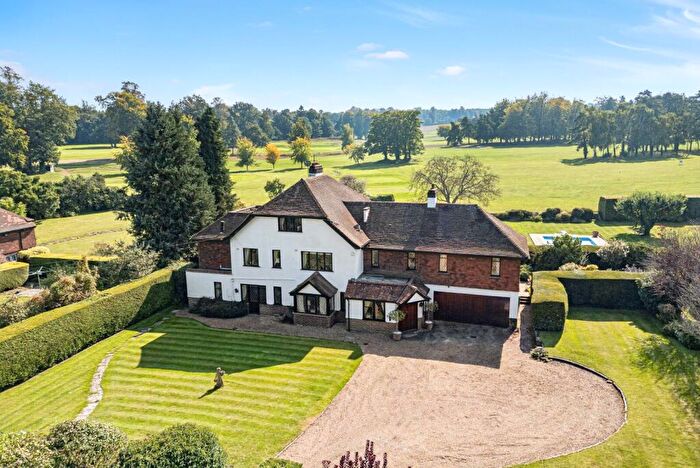
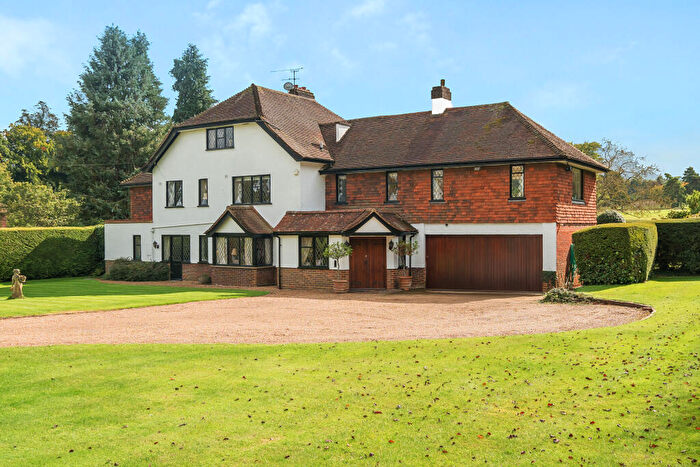
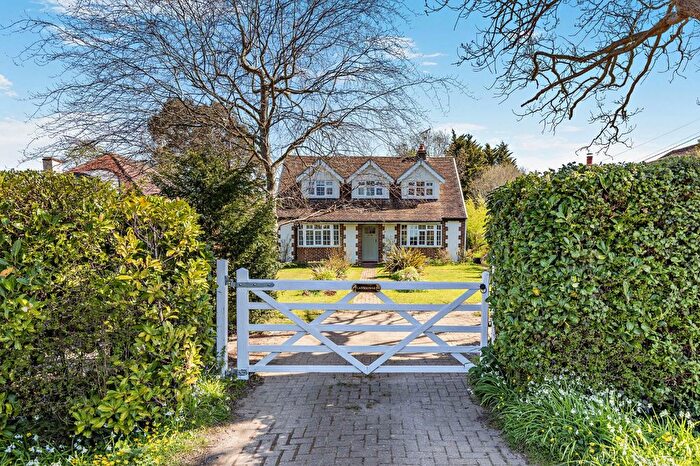
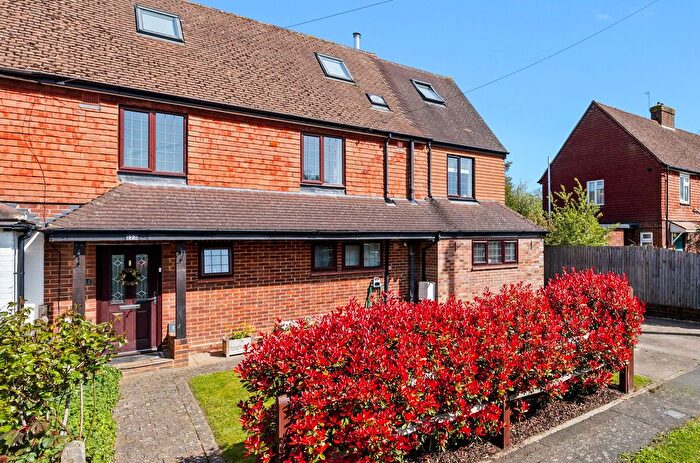
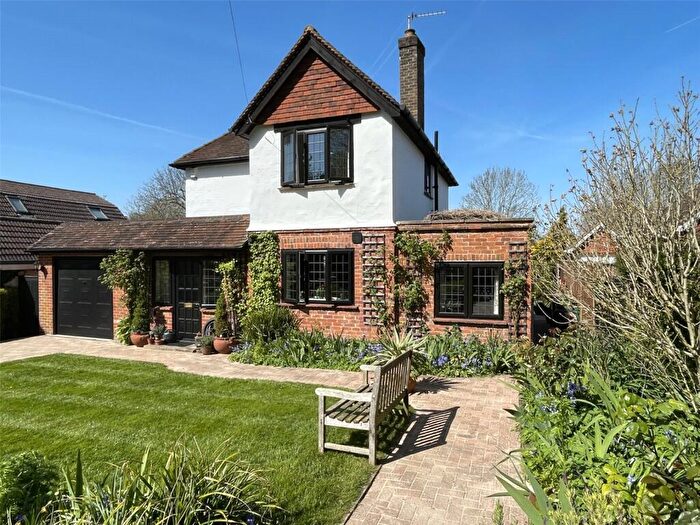
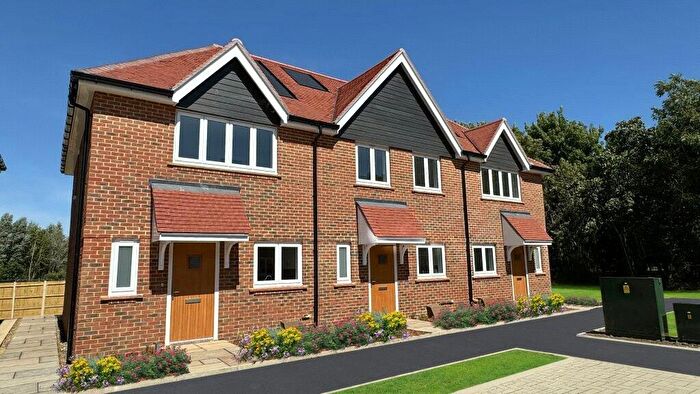
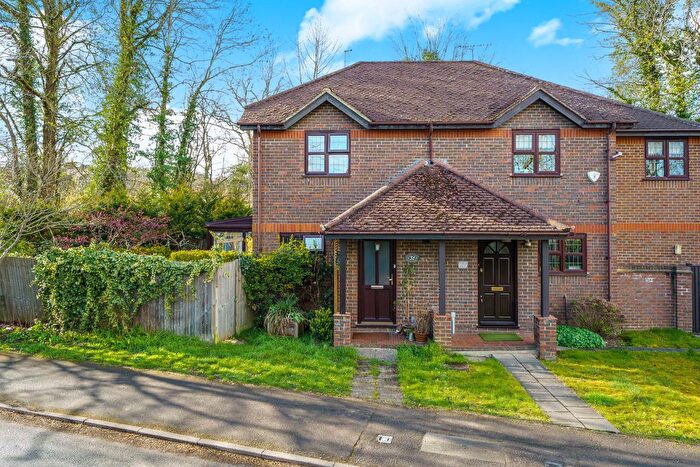
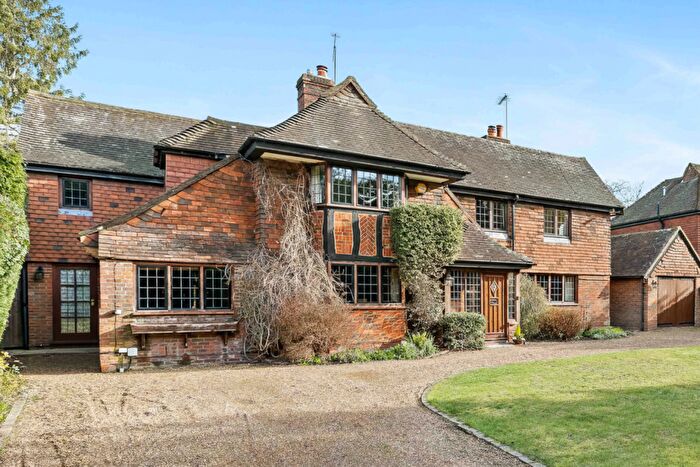
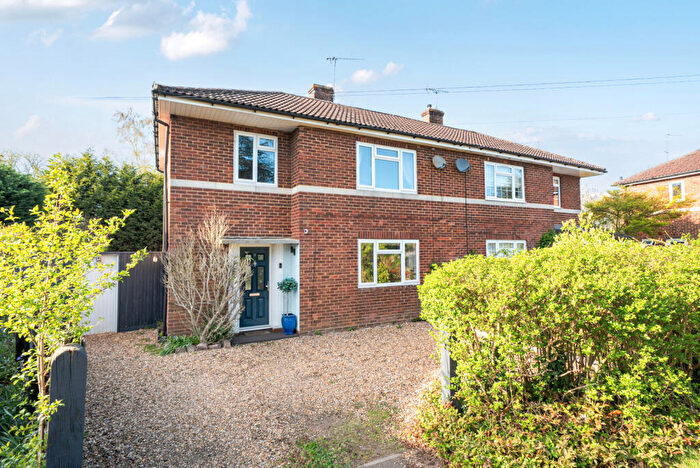
Properties for sale in Clandon And Horsley
![]()
If you are looking to sell your house, let it out, or receive a property valuation, an expert can help you.
Click the button below to get started.
Roads and Postcodes in Clandon And Horsley
Navigate through our locations to find the location of your next house in Clandon And Horsley, Leatherhead for sale or to rent.
Transport near Clandon And Horsley

- FAQ
- Price Paid By Year
- Property Type Price
Frequently asked questions about Clandon And Horsley
What is the average price for a property for sale in Clandon And Horsley?
The average price for a property for sale in Clandon And Horsley is £1,130,792. This amount is 36% higher than the average price in Leatherhead. There are 1,218 property listings for sale in Clandon And Horsley.
What streets have the most expensive properties for sale in Clandon And Horsley?
The streets with the most expensive properties for sale in Clandon And Horsley are The Warren at an average of £2,962,500, Norrels Drive at an average of £2,395,000 and Woodland Drive at an average of £2,265,000.
What streets have the most affordable properties for sale in Clandon And Horsley?
The streets with the most affordable properties for sale in Clandon And Horsley are Bishopsmead Parade at an average of £237,666, Linden Place at an average of £270,000 and Farleys Close at an average of £365,000.
Which train stations are available in or near Clandon And Horsley?
Some of the train stations available in or near Clandon And Horsley are Horsley, Effingham Junction and Bookham.
Property Price Paid in Clandon And Horsley by Year
The average sold property price by year was:
| Year | Average Sold Price | Price Change |
Sold Properties
|
|---|---|---|---|
| 2026 | £738,333 | -50% |
3 Properties |
| 2025 | £1,109,293 | -3% |
65 Properties |
| 2024 | £1,139,616 | -1% |
77 Properties |
| 2023 | £1,156,406 | -0,4% |
74 Properties |
| 2022 | £1,161,135 | 3% |
111 Properties |
| 2021 | £1,131,376 | 11% |
137 Properties |
| 2020 | £1,009,927 | 11% |
82 Properties |
| 2019 | £903,167 | -5% |
95 Properties |
| 2018 | £946,530 | 13% |
100 Properties |
| 2017 | £822,140 | -14% |
105 Properties |
| 2016 | £934,987 | 10% |
101 Properties |
| 2015 | £840,478 | 3% |
105 Properties |
| 2014 | £815,145 | 12% |
124 Properties |
| 2013 | £720,537 | -13% |
118 Properties |
| 2012 | £817,487 | 12% |
97 Properties |
| 2011 | £716,059 | 10% |
114 Properties |
| 2010 | £642,906 | 11% |
111 Properties |
| 2009 | £571,152 | -39% |
107 Properties |
| 2008 | £793,384 | 18% |
59 Properties |
| 2007 | £652,937 | 11% |
147 Properties |
| 2006 | £582,129 | 1% |
154 Properties |
| 2005 | £573,710 | 13% |
97 Properties |
| 2004 | £498,903 | -2% |
153 Properties |
| 2003 | £511,005 | 7% |
105 Properties |
| 2002 | £475,791 | 11% |
128 Properties |
| 2001 | £422,758 | 12% |
127 Properties |
| 2000 | £373,364 | 14% |
144 Properties |
| 1999 | £319,820 | 9% |
143 Properties |
| 1998 | £289,591 | 11% |
104 Properties |
| 1997 | £257,666 | 18% |
143 Properties |
| 1996 | £211,135 | 6% |
146 Properties |
| 1995 | £198,507 | - |
98 Properties |
Property Price per Property Type in Clandon And Horsley
Here you can find historic sold price data in order to help with your property search.
The average Property Paid Price for specific property types in the last three years are:
| Property Type | Average Sold Price | Sold Properties |
|---|---|---|
| Flat | £454,400.00 | 15 Flats |
| Semi Detached House | £768,410.00 | 34 Semi Detached Houses |
| Detached House | £1,297,911.00 | 162 Detached Houses |
| Terraced House | £555,000.00 | 8 Terraced Houses |