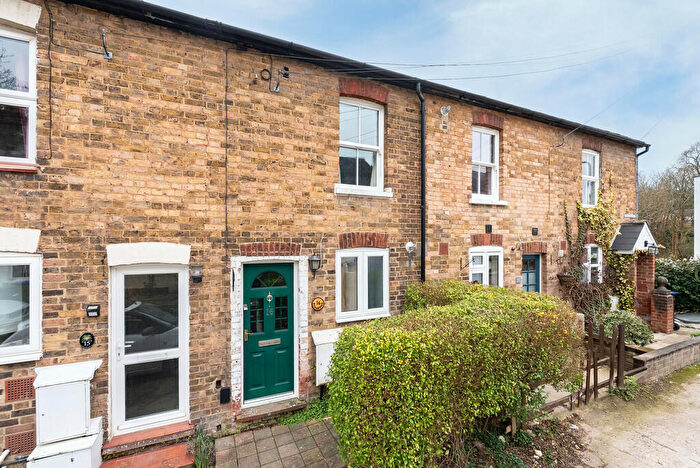
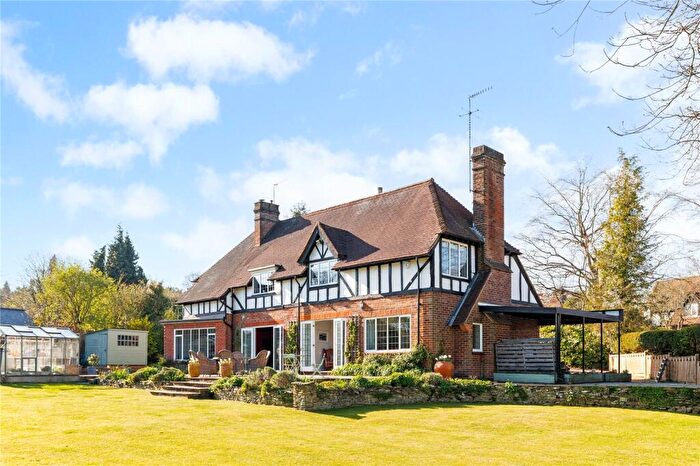
Houses for sale & to rent in Mickleham, Westhumble And Pixham, Dorking
House Prices in Mickleham, Westhumble And Pixham
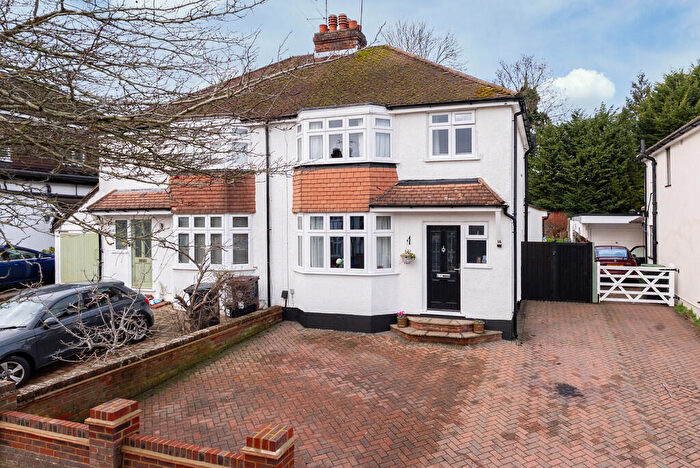
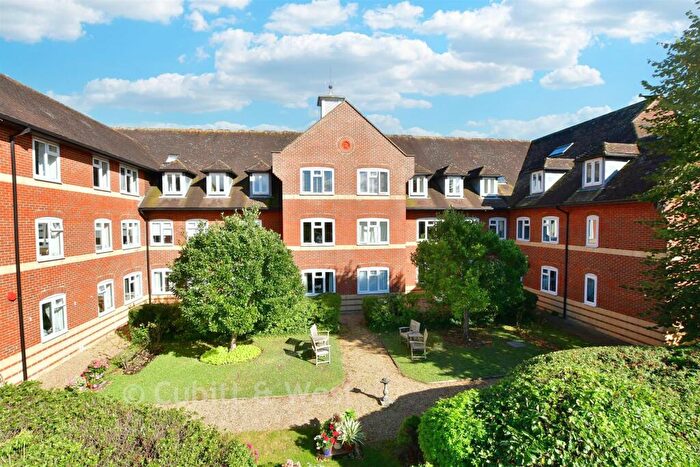
Properties in Mickleham, Westhumble And Pixham have an average house price of £736,644.00 and had 79 Property Transactions within the last 3 years¹.
Mickleham, Westhumble And Pixham is an area in Dorking, Surrey with 807 households², where the most expensive property was sold for £2,800,000.00.
Properties for sale in Mickleham, Westhumble And Pixham
Roads and Postcodes in Mickleham, Westhumble And Pixham
Navigate through our locations to find the location of your next house in Mickleham, Westhumble And Pixham, Dorking for sale or to rent.
| Streets | Postcodes |
|---|---|
| Adlers Lane | RH5 6AS |
| Betchworth Place | RH4 1BF |
| Bradley Lane | RH5 6AA |
| Burford Corner | RH5 6BS |
| Burney Road | RH5 6AT RH5 6AU RH5 6AX |
| Byttom Hill | RH5 6EL RH5 6EN |
| Camilla Drive | RH5 6BU |
| Chapel Lane | RH5 6AH RH5 6AJ RH5 6AL RH5 6AN RH5 6AY |
| Chester Close | RH4 1PP |
| Courtenay Place | RH4 1NW |
| Cowslip Lane | RH5 6ET |
| Crabtree Lane | RH5 6BG RH5 6BQ |
| Dell Close | RH5 6EE |
| Dell Close Cottages | RH5 6EF |
| Denbies Drive | RH5 6AB |
| Downs View | RH4 1PX |
| Flint Cottages | RH5 6EJ |
| Fredley Park | RH5 6DD |
| Headley Lane | RH5 6DF RH5 6DG |
| Leslie Road | RH4 1PS RH4 1PW |
| London Road | RH5 6AD RH5 6BP RH5 6DB RH5 6DL RH5 6EB RH5 6EH RH5 6EQ RH4 1GH RH4 1QP RH5 6AE RH5 6BX RH5 6BZ RH5 6DE RH5 6DJ RH5 6DX RH5 6EA RH5 6ED |
| Mickleham Downs | RH5 6DP RH5 6EG |
| Norbury Park | RH5 6DN |
| Old London Road | RH5 6BY RH5 6DU RH5 6DA |
| Pilgrims Close | RH5 6AR |
| Pilgrims Way | RH5 6AP RH5 6AW |
| Pixham End | RH4 1GB RH4 1QA RH4 1TP |
| Pixham Lane | RH4 1PF RH4 1PG RH4 1PH RH4 1PL RH4 1PQ RH4 1PT RH4 1PU |
| Pixholme Grove | RH4 1PJ |
| Ranmore Common Road | RH5 6AZ |
| Redcote Place | RH4 1PE |
| Reigate Road | RH4 1NN RH4 1NR |
| Riverside | RH4 1PR |
| School Lane | RH5 6EW |
| Swan Mill Gardens | RH4 1PN |
| Swanworth Lane | RH5 6DY RH5 6ER RH5 6ES |
| The Zigzag | RH5 6BN |
| Westhumble Street | RH5 6AF RH5 6BT |
Transport near Mickleham, Westhumble And Pixham
-
Boxhill and Westhumble Station
-
Dorking Station
-
Deepdene Station
-
Dorking West Station
-
Betchworth Station
- FAQ
- Price Paid By Year
- Property Type Price
Frequently asked questions about Mickleham, Westhumble And Pixham
What is the average price for a property for sale in Mickleham, Westhumble And Pixham?
The average price for a property for sale in Mickleham, Westhumble And Pixham is £736,644. This amount is 20% higher than the average price in Dorking. There are 1,452 property listings for sale in Mickleham, Westhumble And Pixham.
What streets have the most expensive properties for sale in Mickleham, Westhumble And Pixham?
The streets with the most expensive properties for sale in Mickleham, Westhumble And Pixham are Fredley Park at an average of £2,800,000, Pilgrims Close at an average of £1,270,000 and Swanworth Lane at an average of £1,240,000.
What streets have the most affordable properties for sale in Mickleham, Westhumble And Pixham?
The streets with the most affordable properties for sale in Mickleham, Westhumble And Pixham are Swan Mill Gardens at an average of £361,132, Riverside at an average of £420,000 and Chester Close at an average of £421,285.
Which train stations are available in or near Mickleham, Westhumble And Pixham?
Some of the train stations available in or near Mickleham, Westhumble And Pixham are Boxhill and Westhumble, Dorking and Deepdene.
Property Price Paid in Mickleham, Westhumble And Pixham by Year
The average sold property price by year was:
| Year | Average Sold Price | Price Change |
Sold Properties
|
|---|---|---|---|
| 2025 | £745,305 | -10% |
18 Properties |
| 2024 | £818,267 | 19% |
28 Properties |
| 2023 | £662,664 | -14% |
33 Properties |
| 2022 | £757,811 | 23% |
39 Properties |
| 2021 | £582,184 | -24% |
38 Properties |
| 2020 | £723,671 | 18% |
36 Properties |
| 2019 | £596,977 | 8% |
24 Properties |
| 2018 | £551,925 | -16% |
27 Properties |
| 2017 | £642,801 | 15% |
29 Properties |
| 2016 | £543,279 | -9% |
36 Properties |
| 2015 | £589,938 | 15% |
26 Properties |
| 2014 | £500,824 | 25% |
35 Properties |
| 2013 | £376,194 | -10% |
28 Properties |
| 2012 | £413,337 | -29% |
31 Properties |
| 2011 | £533,120 | 2% |
37 Properties |
| 2010 | £524,228 | 32% |
35 Properties |
| 2009 | £357,794 | -106% |
17 Properties |
| 2008 | £738,537 | 47% |
13 Properties |
| 2007 | £390,096 | -15% |
50 Properties |
| 2006 | £447,939 | 27% |
51 Properties |
| 2005 | £325,426 | -5% |
32 Properties |
| 2004 | £342,598 | 11% |
40 Properties |
| 2003 | £305,509 | 21% |
37 Properties |
| 2002 | £242,603 | -1% |
50 Properties |
| 2001 | £244,800 | 13% |
35 Properties |
| 2000 | £212,601 | -0,3% |
31 Properties |
| 1999 | £213,303 | 25% |
68 Properties |
| 1998 | £160,188 | -7% |
31 Properties |
| 1997 | £171,144 | 17% |
43 Properties |
| 1996 | £142,335 | 14% |
28 Properties |
| 1995 | £122,174 | - |
24 Properties |
Property Price per Property Type in Mickleham, Westhumble And Pixham
Here you can find historic sold price data in order to help with your property search.
The average Property Paid Price for specific property types in the last three years are:
| Property Type | Average Sold Price | Sold Properties |
|---|---|---|
| Semi Detached House | £514,768.00 | 17 Semi Detached Houses |
| Detached House | £1,057,856.00 | 35 Detached Houses |
| Terraced House | £521,666.00 | 12 Terraced Houses |
| Flat | £410,590.00 | 15 Flats |

