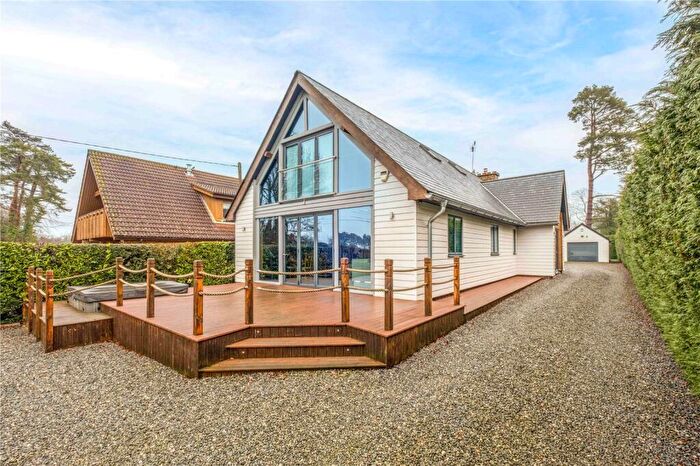
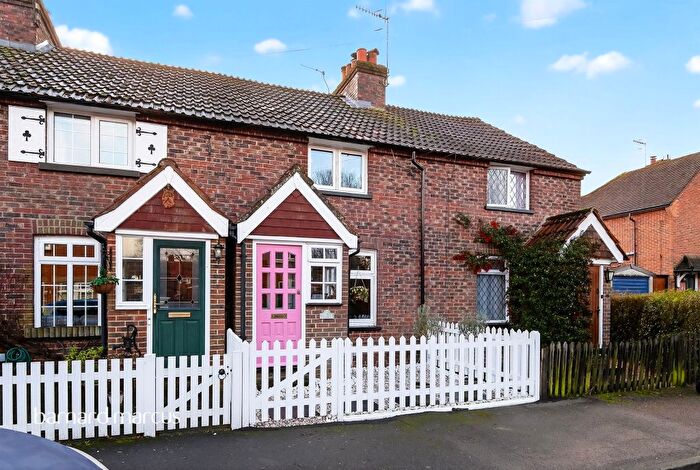
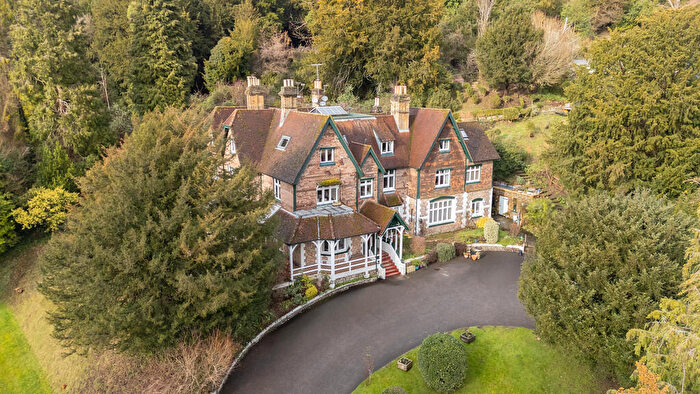
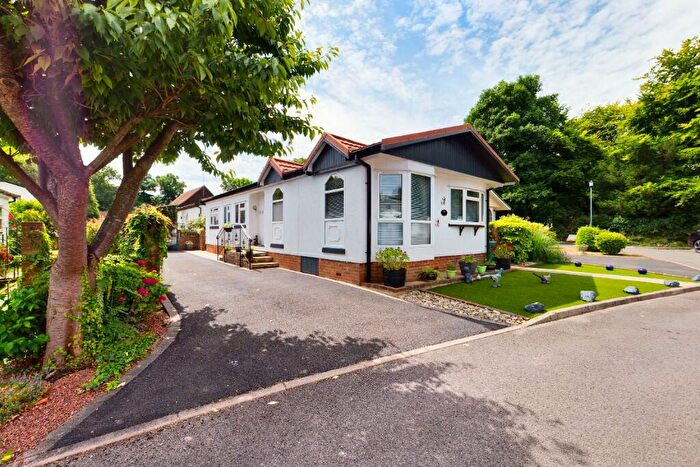
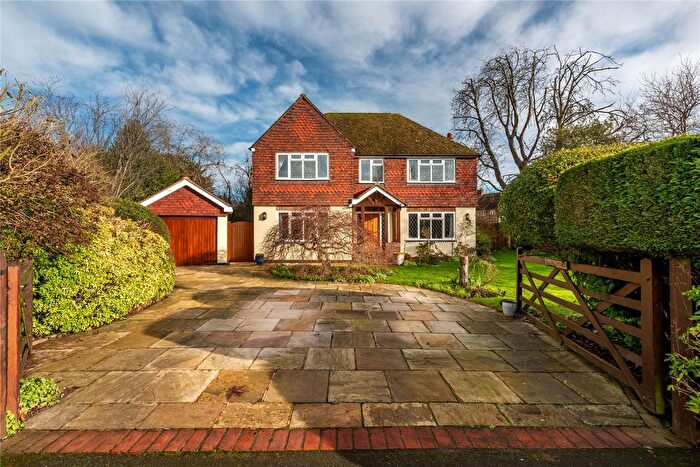
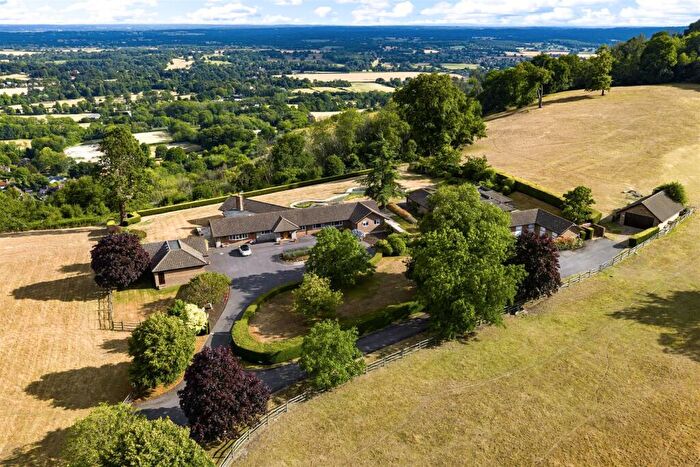
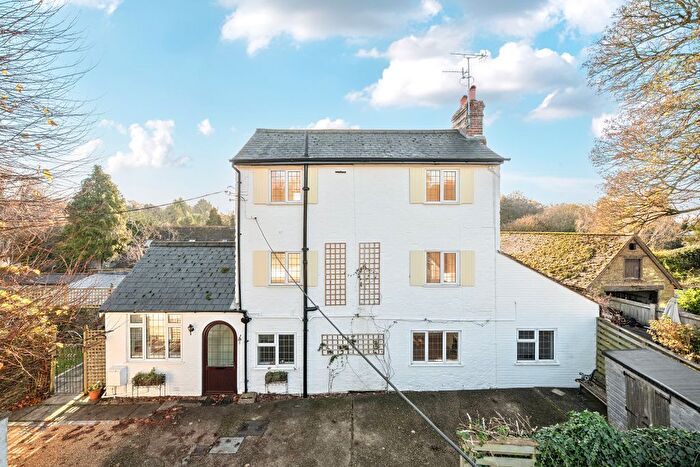
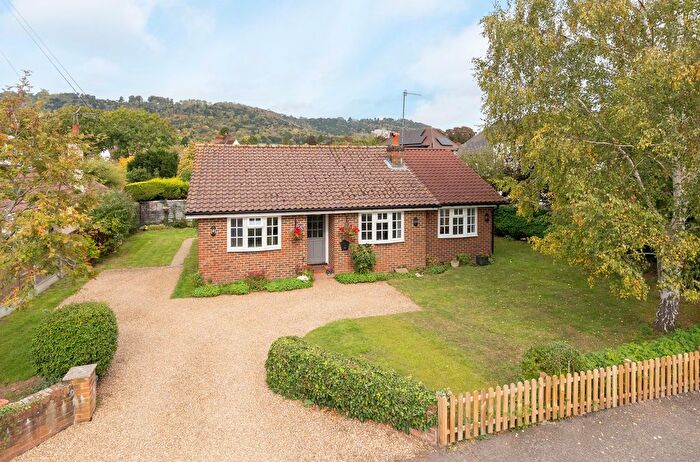
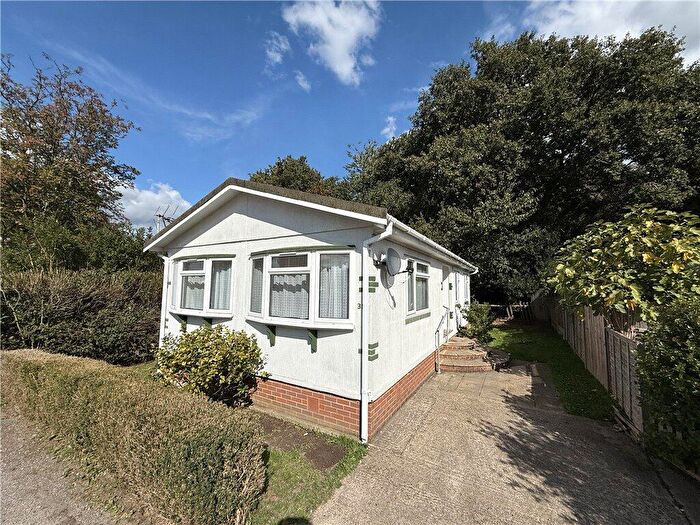
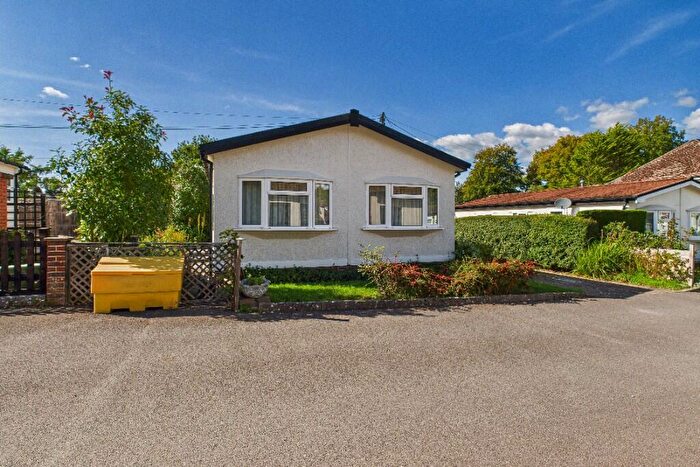
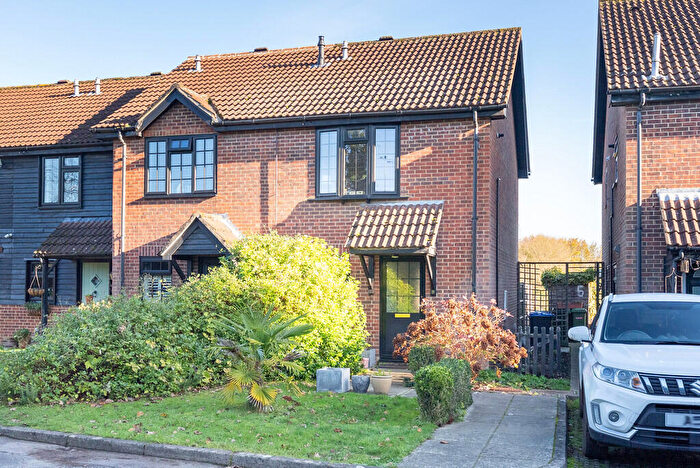
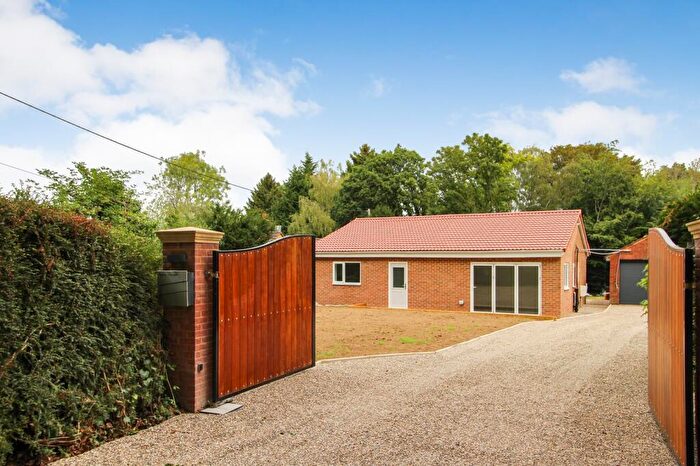
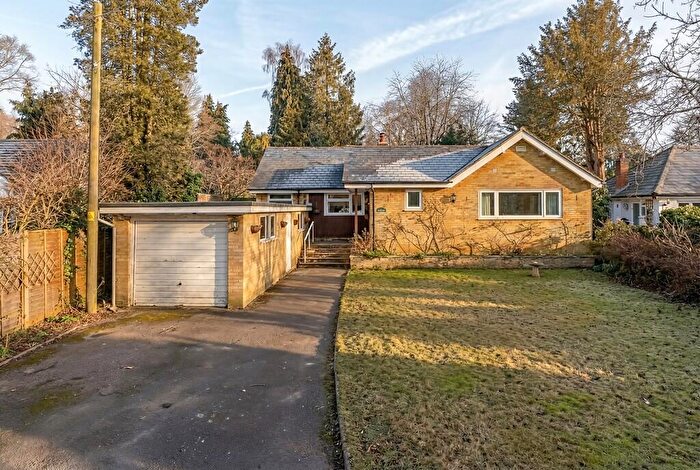
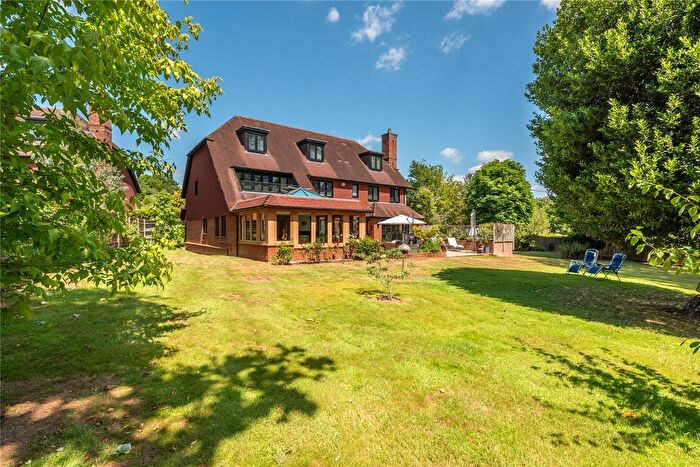
Houses for sale & to rent in Box Hill And Headley, Tadworth
House Prices in Box Hill And Headley
Properties in Box Hill And Headley have an average house price of £1,076,666.00 and had 6 Property Transactions within the last 3 years¹.
Box Hill And Headley is an area in Tadworth, Surrey with 769 households², where the most expensive property was sold for £1,850,000.00.
Properties for sale in Box Hill And Headley
Roads and Postcodes in Box Hill And Headley
Navigate through our locations to find the location of your next house in Box Hill And Headley, Tadworth for sale or to rent.
| Streets | Postcodes |
|---|---|
| Ashurst Drive | KT20 7LN KT20 7LR KT20 7LS KT20 7LW KT20 7LT |
| Barn Close | KT20 7JD |
| Boxhill Road | KT20 7JE KT20 7JF KT20 7JG KT20 7JN KT20 7JT KT20 7JX KT20 7JZ KT20 7LA KT20 7PD KT20 7PH KT20 7PL KT20 7PR KT20 7PS KT20 7PW KT20 7AH KT20 7JQ KT20 7JS KT20 7LB KT20 7LF KT20 7PF KT20 7PQ |
| Bramble Hall Lane | KT20 7JY |
| Brockham Hill Park | KT20 7PZ |
| Clump Avenue | KT20 7PY |
| Devonshire Avenue | KT20 7JA |
| Fort Road | KT20 7JJ |
| Handinhand Lane | KT20 7PP |
| Headley Heath Approach | KT20 7LG KT20 7LJ KT20 7LL KT20 7LQ |
| Hillcrest | KT20 7JW |
| Oakengate Wood | KT20 7PT |
| Orchard Mobile Home Park | KT20 7LP |
| Roof Of The World Caravan Park | KT20 7JR |
| Roof Of The World Mobile Home Park | KT20 7JP |
| Surrey Hills Residential Park | KT20 7LY KT20 7LZ KT20 7NB KT20 7ND |
| Usherwood Close | KT20 7JB |
| Warren Park | KT20 7PU |
| Woodlands Park | KT20 7JL |
Transport near Box Hill And Headley
-
Betchworth Station
-
Boxhill and Westhumble Station
-
Dorking Station
-
Deepdene Station
-
Dorking West Station
- FAQ
- Price Paid By Year
- Property Type Price
Frequently asked questions about Box Hill And Headley
What is the average price for a property for sale in Box Hill And Headley?
The average price for a property for sale in Box Hill And Headley is £1,076,666. This amount is 41% higher than the average price in Tadworth. There are 453 property listings for sale in Box Hill And Headley.
What streets have the most expensive properties for sale in Box Hill And Headley?
The street with the most expensive properties for sale in Box Hill And Headley is Boxhill Road at an average of £1,313,333.
What streets have the most affordable properties for sale in Box Hill And Headley?
The street with the most affordable properties for sale in Box Hill And Headley is Woodlands Park at an average of £835,000.
Which train stations are available in or near Box Hill And Headley?
Some of the train stations available in or near Box Hill And Headley are Betchworth, Boxhill and Westhumble and Dorking.
Property Price Paid in Box Hill And Headley by Year
The average sold property price by year was:
| Year | Average Sold Price | Price Change |
Sold Properties
|
|---|---|---|---|
| 2025 | £820,000 | -12% |
1 Property |
| 2024 | £920,000 | -28% |
1 Property |
| 2023 | £1,180,000 | 38% |
4 Properties |
| 2022 | £730,249 | -18% |
6 Properties |
| 2021 | £858,277 | 3% |
9 Properties |
| 2020 | £830,745 | 10% |
11 Properties |
| 2019 | £747,083 | -6% |
9 Properties |
| 2018 | £788,778 | -6% |
7 Properties |
| 2017 | £838,750 | 30% |
2 Properties |
| 2016 | £584,575 | -4% |
6 Properties |
| 2015 | £605,142 | -2% |
7 Properties |
| 2014 | £617,312 | -11% |
8 Properties |
| 2013 | £684,600 | 22% |
5 Properties |
| 2012 | £536,750 | 41% |
4 Properties |
| 2011 | £318,333 | -64% |
3 Properties |
| 2010 | £521,666 | 27% |
3 Properties |
| 2009 | £383,017 | -17% |
3 Properties |
| 2008 | £447,499 | -14% |
4 Properties |
| 2007 | £509,229 | 3% |
17 Properties |
| 2006 | £491,677 | 7% |
11 Properties |
| 2005 | £455,500 | 9% |
11 Properties |
| 2004 | £415,269 | -9% |
13 Properties |
| 2003 | £452,500 | 29% |
8 Properties |
| 2002 | £322,997 | 15% |
18 Properties |
| 2001 | £275,940 | -21% |
10 Properties |
| 2000 | £334,525 | 10% |
10 Properties |
| 1999 | £300,090 | 28% |
11 Properties |
| 1998 | £217,112 | 12% |
8 Properties |
| 1997 | £190,845 | 22% |
10 Properties |
| 1996 | £148,644 | 8% |
7 Properties |
| 1995 | £137,000 | - |
4 Properties |
Property Price per Property Type in Box Hill And Headley
Here you can find historic sold price data in order to help with your property search.
The average Property Paid Price for specific property types in the last three years are:
| Property Type | Average Sold Price | Sold Properties |
|---|---|---|
| Semi Detached House | £1,170,000.00 | 1 Semi Detached House |
| Detached House | £1,058,000.00 | 5 Detached Houses |

