
Houses for sale & to rent in PO10 8BT, Mill Quay, Southbourne, Emsworth
House Prices in PO10 8BT, Mill Quay, Southbourne
Properties in PO10 8BT have no sales history available within the last 3 years. PO10 8BT is a postcode in Mill Quay located in Southbourne, an area in Emsworth, Surrey, with 4 households².
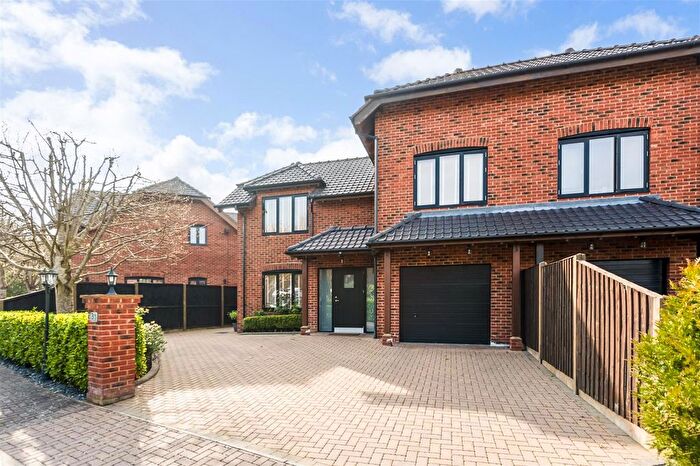
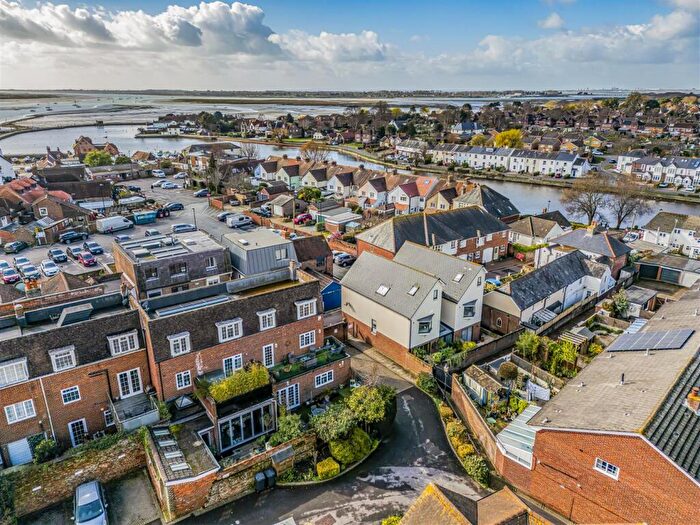
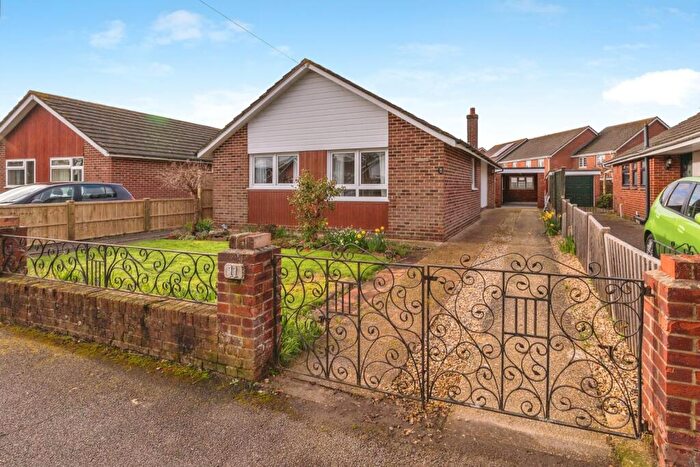
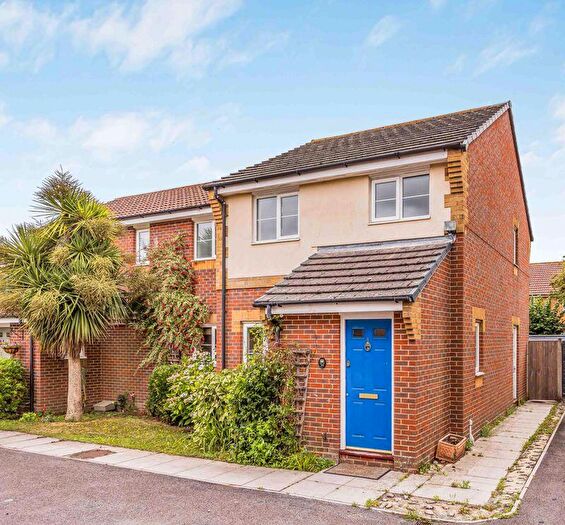
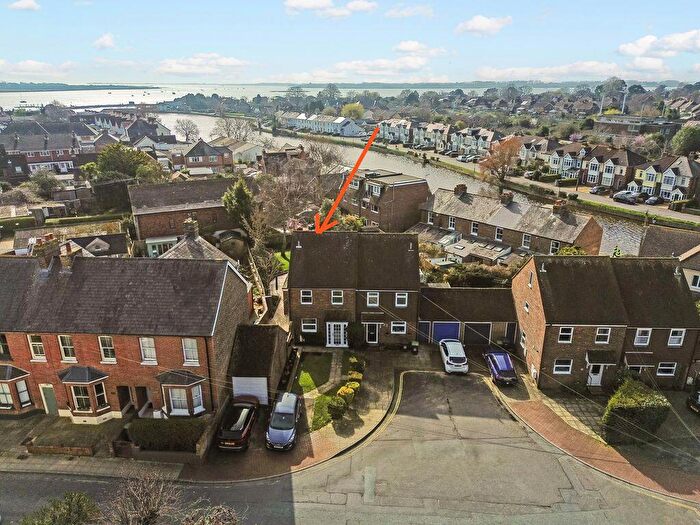
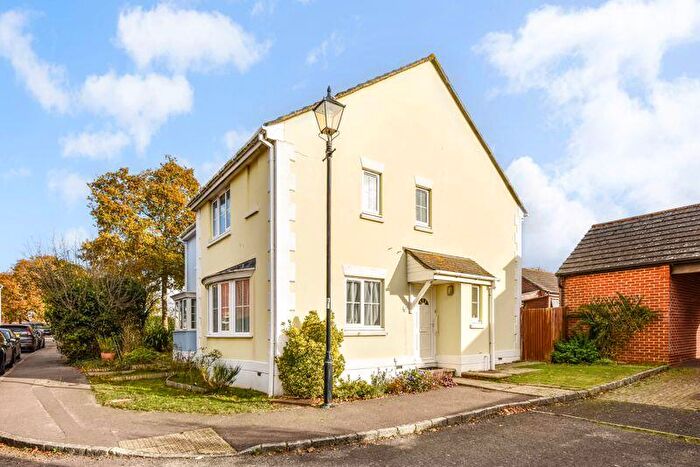
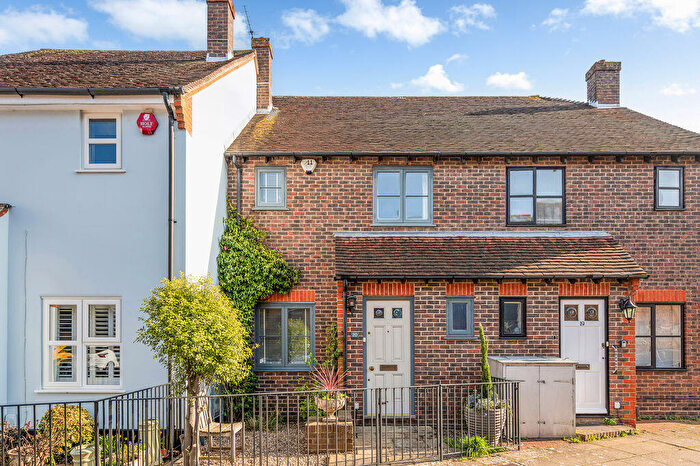
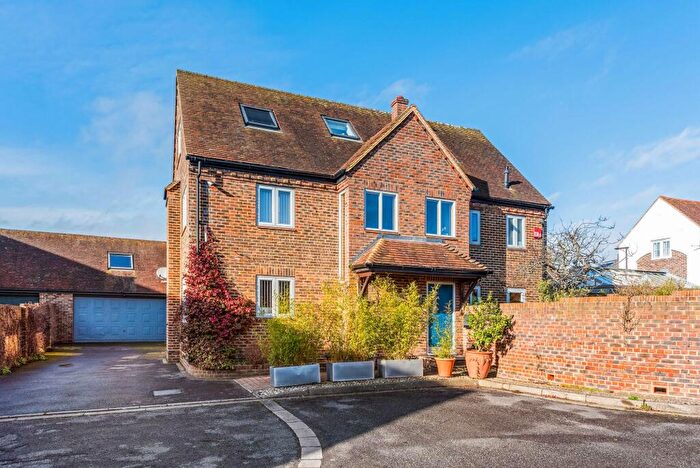
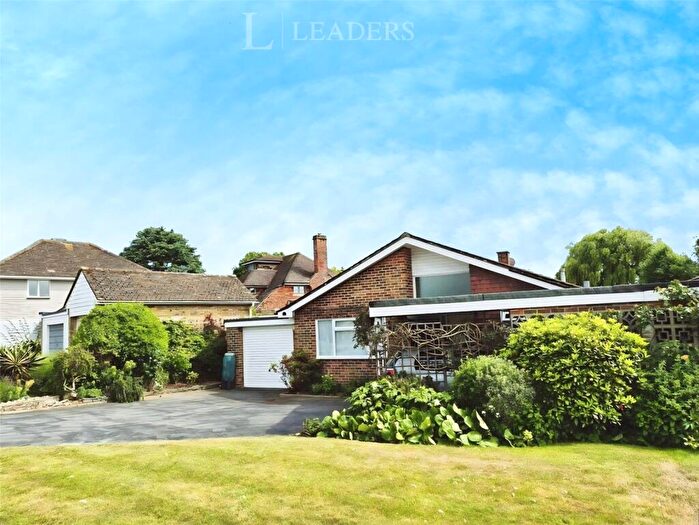
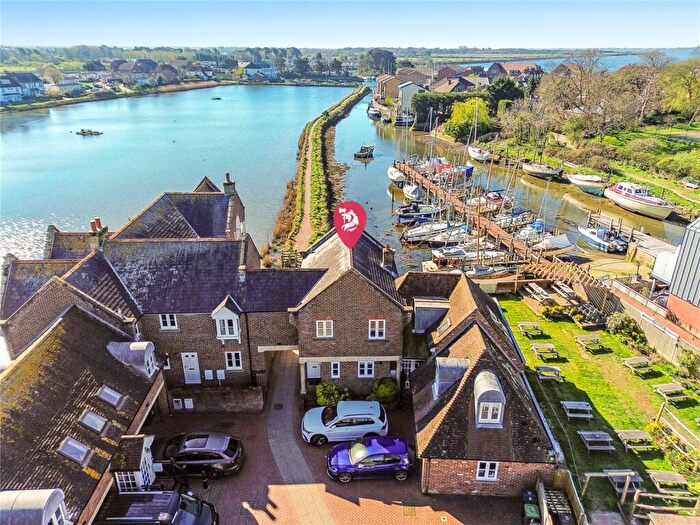
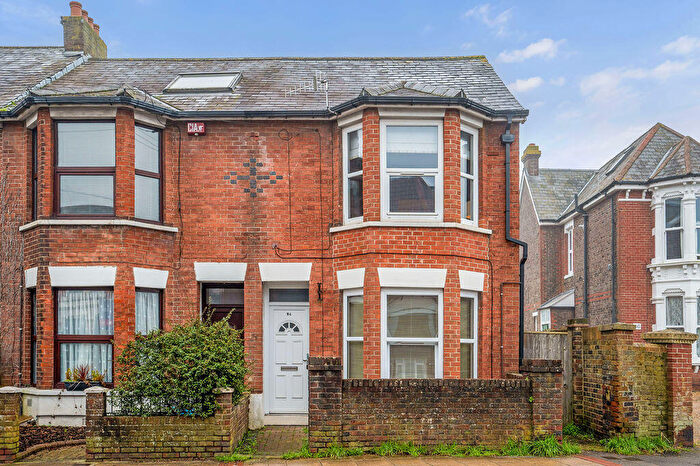
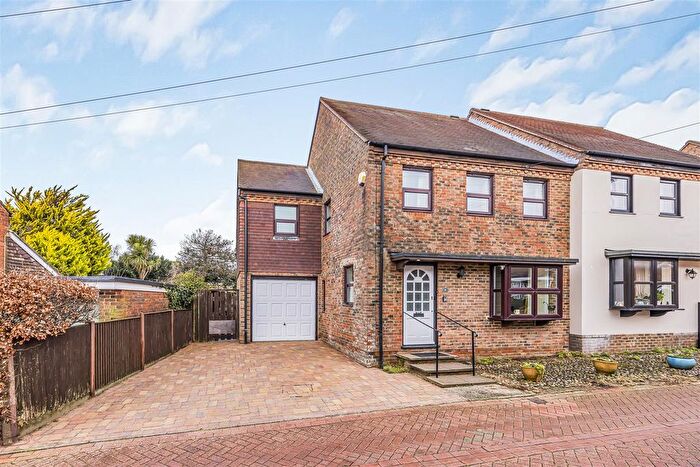
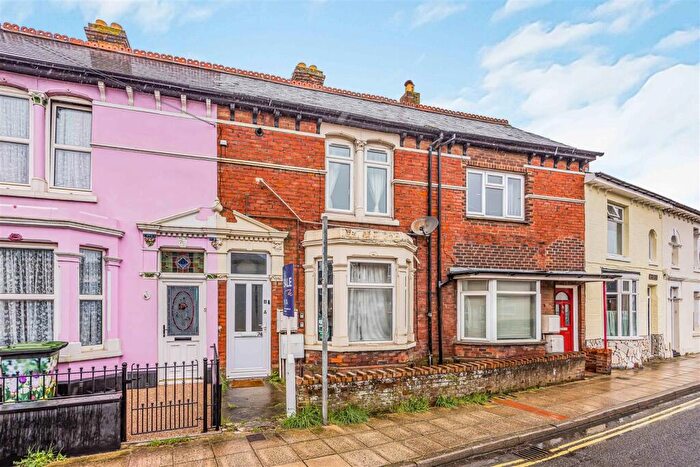
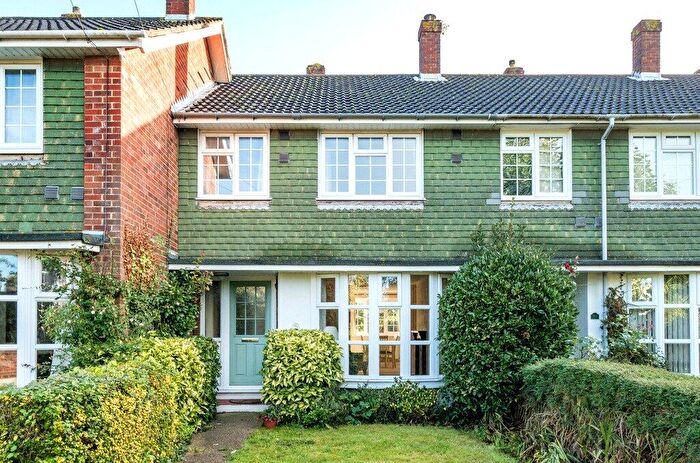
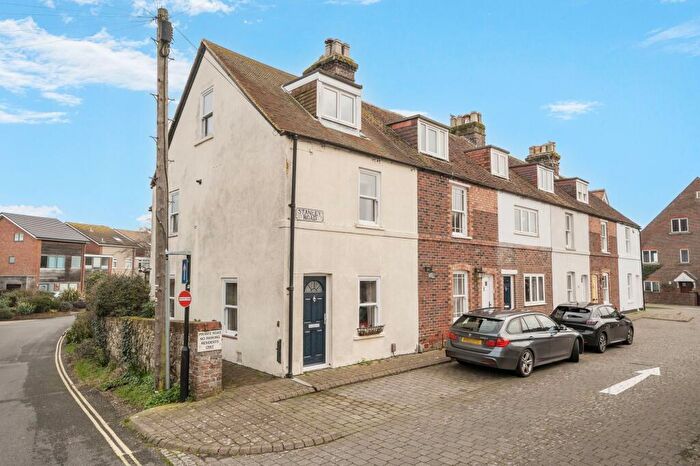
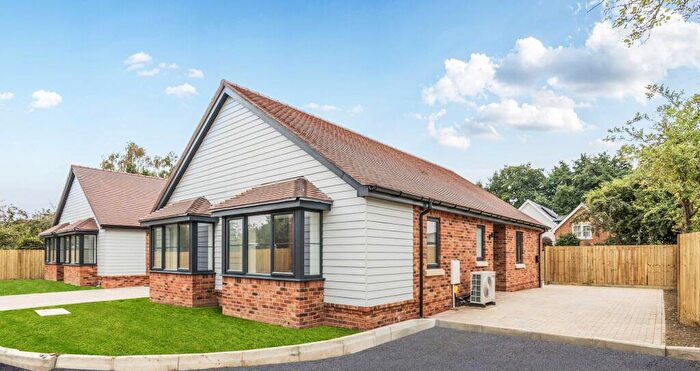
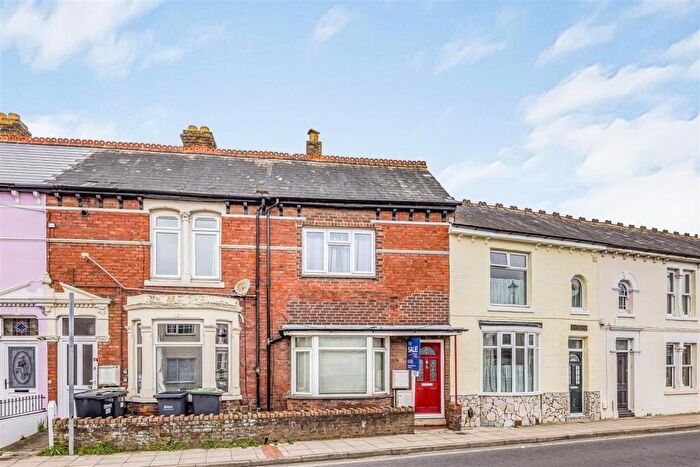
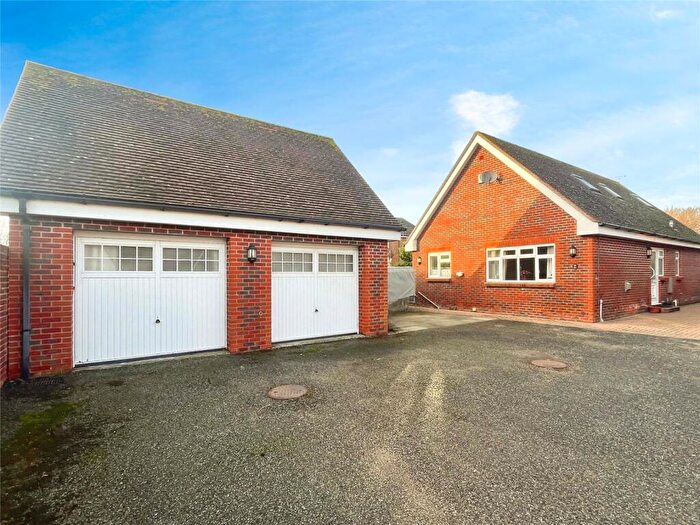
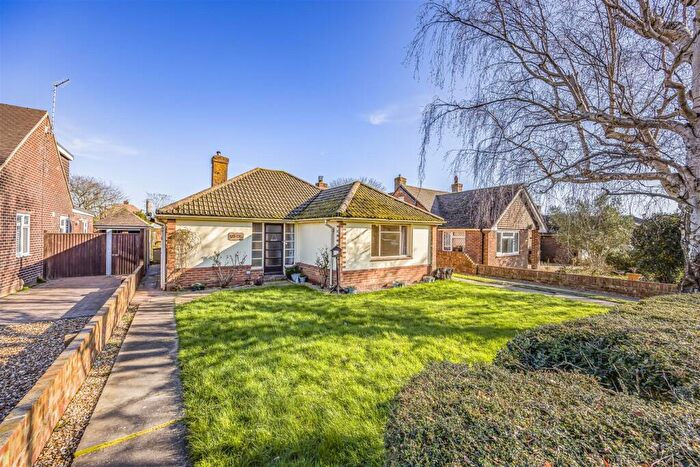
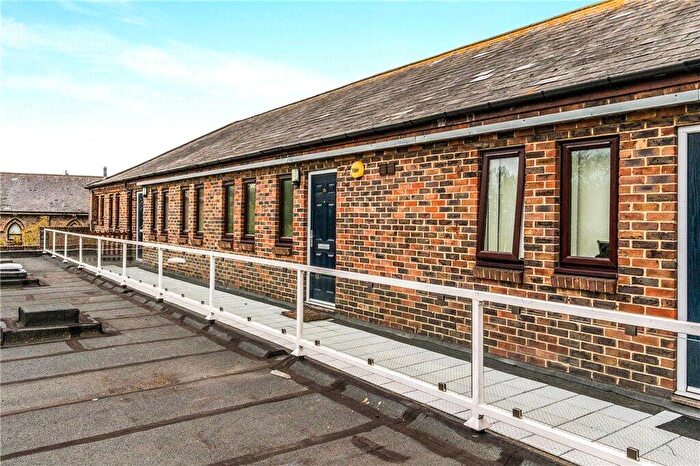
Properties for sale near PO10 8BT, Mill Quay
![]()
If you are looking to sell your house, let it out, or receive a property valuation, an expert can help you.
Click the button below to get started.
Price Paid in Mill Quay, PO10 8BT, Southbourne
4 Mill Quay, PO10 8BT, Southbourne Emsworth
Property 4 has been sold 1 time. The last time it was sold was in 28/06/2021 and the sold price was £325,000.00.
This detached house, sold as a leasehold on 28/06/2021, is a 50 sqm detached bungalow with an EPC rating of E.
| Date | Price | Property Type | Tenure | Classification |
|---|---|---|---|---|
| 28/06/2021 | £325,000.00 | Detached House | leasehold | Established Building |
6 Mill Quay, PO10 8BT, Southbourne Emsworth
Property 6 has been sold 3 times. The last time it was sold was in 20/11/2020 and the sold price was £365,000.00.
This flat, sold as a leasehold on 20/11/2020, is a 61 sqm detached house with an EPC rating of C.
| Date | Price | Property Type | Tenure | Classification |
|---|---|---|---|---|
| 20/11/2020 | £365,000.00 | Flat | leasehold | Established Building |
| 06/06/2000 | £85,000.00 | Flat | leasehold | Established Building |
| 21/01/1997 | £64,000.00 | Flat | leasehold | Established Building |
3 Mill Quay, PO10 8BT, Southbourne Emsworth
Property 3 has been sold 1 time. The last time it was sold was in 14/12/2015 and the sold price was £300,000.00.
This detached house, sold as a leasehold on 14/12/2015, is a 48 sqm detached house with an EPC rating of F.
| Date | Price | Property Type | Tenure | Classification |
|---|---|---|---|---|
| 14/12/2015 | £300,000.00 | Detached House | leasehold | Established Building |
7 Mill Quay, PO10 8BT, Southbourne Emsworth
Property 7 has been sold 2 times. The last time it was sold was in 15/12/2011 and the sold price was £280,000.00.
This detached house, sold as a leasehold on 15/12/2011, is a 51 sqm detached house with an EPC rating of D.
| Date | Price | Property Type | Tenure | Classification |
|---|---|---|---|---|
| 15/12/2011 | £280,000.00 | Detached House | leasehold | Established Building |
| 15/09/2003 | £153,750.00 | Flat | leasehold | Established Building |
2 Mill Quay, PO10 8BT, Southbourne Emsworth
Property 2 has been sold 3 times. The last time it was sold was in 28/11/2008 and the sold price was £175,000.00.
This is a Semi Detached House which was sold as a leasehold in 28/11/2008
| Date | Price | Property Type | Tenure | Classification |
|---|---|---|---|---|
| 28/11/2008 | £175,000.00 | Semi Detached House | leasehold | Established Building |
| 22/05/2001 | £120,000.00 | Semi Detached House | leasehold | Established Building |
| 24/11/1997 | £57,000.00 | Semi Detached House | leasehold | Established Building |
5 Mill Quay, PO10 8BT, Southbourne Emsworth
Property 5 has been sold 1 time. The last time it was sold was in 05/12/2003 and the sold price was £164,000.00.
This is a Flat which was sold as a leasehold in 05/12/2003
| Date | Price | Property Type | Tenure | Classification |
|---|---|---|---|---|
| 05/12/2003 | £164,000.00 | Flat | leasehold | Established Building |
1 Mill Quay, PO10 8BT, Southbourne Emsworth
Property 1 has been sold 3 times. The last time it was sold was in 05/03/2001 and the sold price was £120,000.00.
This terraced house, sold as a leasehold on 05/03/2001, is a 52 sqm detached bungalow with an EPC rating of F.
| Date | Price | Property Type | Tenure | Classification |
|---|---|---|---|---|
| 05/03/2001 | £120,000.00 | Terraced House | leasehold | Established Building |
| 25/03/1997 | £60,000.00 | Terraced House | leasehold | Established Building |
| 08/03/1996 | £58,000.00 | Terraced House | leasehold | Established Building |
Transport near PO10 8BT, Mill Quay

House price paid reports for PO10 8BT, Mill Quay
Click on the buttons below to see price paid reports by year or property price:
- Price Paid By Year
Property Price Paid in PO10 8BT, Mill Quay by Year
The average sold property price by year was:
| Year | Average Sold Price | Price Change |
Sold Properties
|
|---|---|---|---|
| 2021 | £325,000 | -12% |
1 Property |
| 2020 | £365,000 | 18% |
1 Property |
| 2015 | £300,000 | 7% |
1 Property |
| 2011 | £280,000 | 38% |
1 Property |
| 2008 | £175,000 | 9% |
1 Property |
| 2003 | £158,875 | 24% |
2 Properties |
| 2001 | £120,000 | 29% |
2 Properties |
| 2000 | £85,000 | 29% |
1 Property |
| 1997 | £60,333 | 4% |
3 Properties |
| 1996 | £58,000 | - |
1 Property |