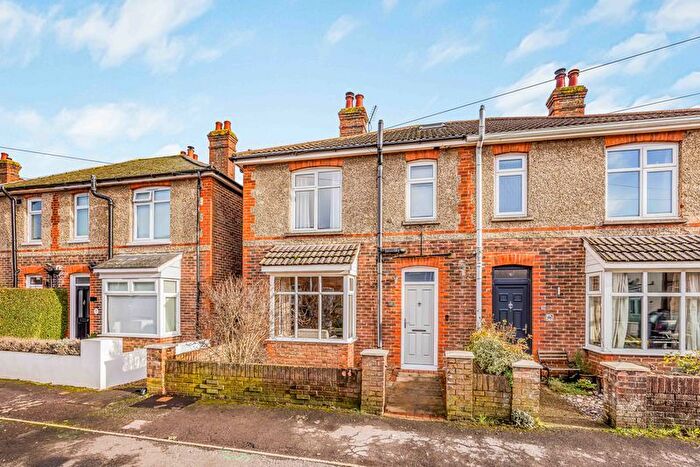
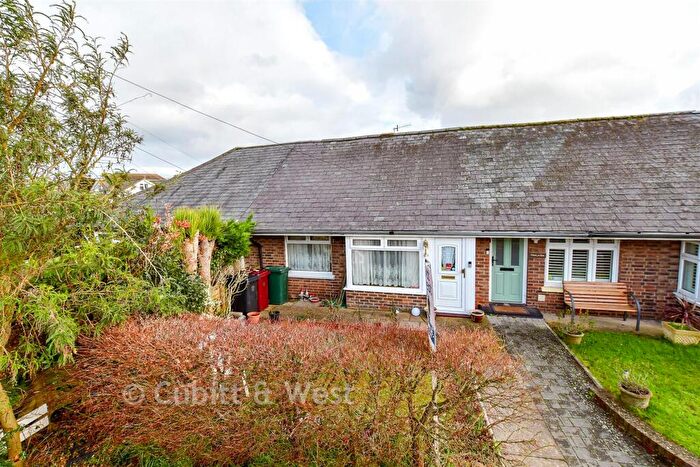
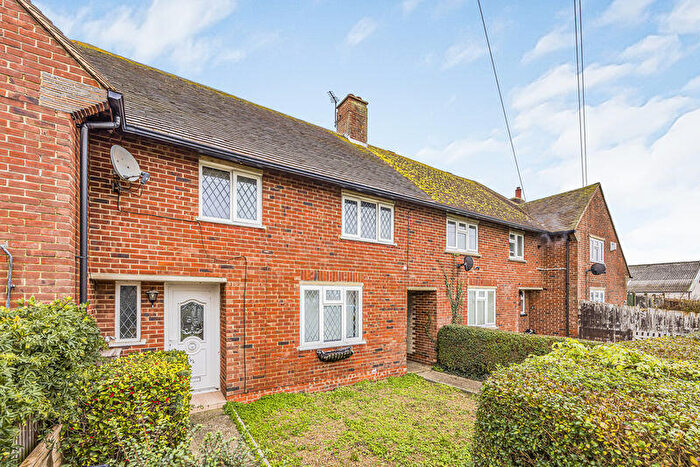
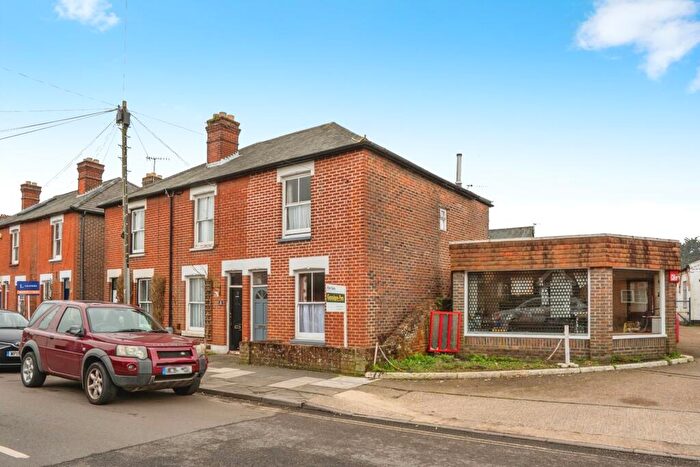
Houses for sale & to rent in Southbourne, Emsworth
House Prices in Southbourne
Properties in Southbourne have an average house price of £421,101.00 and had 245 Property Transactions within the last 3 years¹.
Southbourne is an area in Emsworth, Surrey with 2,608 households², where the most expensive property was sold for £1,532,500.00.
Properties for sale in Southbourne
Roads and Postcodes in Southbourne
Navigate through our locations to find the location of your next house in Southbourne, Emsworth for sale or to rent.
| Streets | Postcodes |
|---|---|
| Alfrey Close | PO10 8ET |
| Apple Grove | PO10 8EU |
| Avocet Quay | PO10 8BY |
| Barnfield Close | PO10 8NH |
| Belmont Place | PO10 8GF |
| Bourne View Close | PO10 8NS |
| Bramley Gardens | PO10 8AN |
| Breach Avenue | PO10 8NB |
| Brundrett Gardens | PO10 8GA |
| Canberra Road | PO10 8EE |
| Cheshire Way | PO10 8PU |
| Church Road | PO10 8GZ PO10 8JT PO10 8DS |
| Clovelly Road | PO10 8PD PO10 8PE PO10 8PF PO10 8PQ PO10 8PW |
| Collett Crescent | PO10 8GD |
| Cooks Lane | PO10 8LG PO10 8LQ |
| Doric Close | PO10 8NU |
| Dunkirk Rise | PO10 8QE |
| Eastfield Close | PO10 8NJ |
| Eden Place | PO10 8FH |
| Emsworth Road | PO10 8DA PO10 8DF PO10 8DJ PO10 8DL PO10 8DN |
| First Avenue | PO10 8HN |
| Flanders Close | PO10 8FN |
| Frarydene | PO10 8HU |
| Fraser Gardens | PO10 8PY |
| Furnston Grove | PO10 8LH PO10 8NP |
| Garsons Road | PO10 8HH PO10 8HJ |
| Gladstone Walk | PO10 8GJ |
| Glenwood Road | PO10 8NL |
| Goodwood Court | PO10 8JZ |
| Gordon Road | PO10 8AZ |
| Guildford Close | PO10 8FB PO10 8LW |
| Ham Lane | PO10 8XT |
| Harcourt Crescent | PO10 8GG |
| Hartland Court | PO10 8LP |
| Haslemere Road | PO10 8PL |
| Heron Quay | PO10 8BX |
| Hither Green | PO10 8JA |
| Hornet Road | PO10 8EL |
| Hunter Road | PO10 8EG |
| Hurstwood Avenue | PO10 8LN |
| Javelin Road | PO10 8ED |
| Jubilee Mews | PO10 8EA |
| Kelsey Avenue | PO10 8NE PO10 8NF PO10 8NG PO10 8NQ |
| Kings Court | PO10 8FD |
| Lauder Close | PO10 8PX |
| Lawley Avenue | PO10 8GB |
| Lawleys View | PO10 8FZ |
| Lazy Acre | PO10 8HW |
| Lodgebury Close | PO10 8NR |
| Longlands Road | PO10 8HL PO10 8FR |
| Lumley Gardens | PO10 8AG |
| Lumley Road | PO10 8AA PO10 8AF PO10 8AQ |
| Lumley Terrace | PO10 8AB |
| Main Road | PO10 8AP PO10 8AR PO10 8AT PO10 8AU PO10 8AX PO10 8AY PO10 8EX PO10 8EY PO10 8EZ PO10 8HA PO10 8JD PO10 8JE PO10 8JG PO10 8JH PO10 8JJ PO10 8JL PO10 8JN PO10 8JQ PO10 8AS PO10 8HB |
| Malling Way | PO10 8GN |
| Manor Gardens | PO10 8PA |
| Manor Road | PO10 8LX PO10 8NX |
| Manor Way | PO10 8LY PO10 8LZ |
| Meteor Road | PO10 8EP |
| Mill End | PO10 8BJ |
| Mill Quay | PO10 8BT |
| Mons Close | PO10 8FJ |
| Mosdell Road | PO10 8LA |
| Mountwood Road | PO10 8NA |
| Nelson Close | PO10 8JW |
| New Road | PO10 8JX |
| North Bay | PO10 8EH |
| Northcote Gardens | PO10 8LF |
| Orchard Lane | PO10 8BH |
| Osprey Quay | PO10 8BZ |
| Overton Road | PO10 8NN |
| Pagham Close | PO10 8JB |
| Parham Place | PO10 8FS |
| Park Road | PO10 8NY PO10 8NZ PO10 8PG PO10 8PJ PO10 8QJ |
| Pears Grove | PO10 8JY |
| Penny Lane | PO10 8HE PO10 8HF |
| Prinsted Gardens | PO10 8FP |
| Prinsted Lane | PO10 8HR PO10 8HS PO10 8HT |
| Priors Close | PO10 8LJ |
| Priors Orchard | PO10 8GE |
| Raglan Terrace | PO10 8AD |
| Roundhouse Meadow | PO10 8BD |
| Russet Gardens | PO10 8AW PO10 8DG PO10 8DQ |
| Sabre Road | PO10 8EJ |
| Sadlers Walk | PO10 8JR |
| Salterns Reach | PO10 8FQ |
| Second Avenue | PO10 8HP |
| Slipper Caravan Site | PO10 8BU |
| Slipper Mill | PO10 8XD |
| Slipper Road | PO10 8BS |
| Smallcutts Avenue | PO10 8PH |
| Smith Lane | PO10 8DP |
| South Bay | PO10 8EN |
| South Lane | PO10 8PP PO10 8PR PO10 8PS |
| Southbourne Avenue | PO10 8BB |
| Spartan Close | PO10 8AL |
| St Johns Road | PO10 8PB |
| Stein Road | PO10 8EW PO10 8LB PO10 8LD PO10 8LE PO10 8LL PO10 8LR PO10 8LS PO10 8LT PO10 8LU PO10 8PN |
| Stein Terrace | PO10 8FL |
| Swift Road | PO10 8EB |
| The Crescent | PO10 8JS |
| The Drive | PO10 8JP |
| The Rookery | PO10 8AH |
| Thistledowne Gardens | PO10 8BF |
| Thorney Island | PO10 8DH PO10 8ES PO10 8FU |
| Thorney Old Park | PO10 8DR |
| Thorney Road | PO10 8BL PO10 8BN PO10 8BW PO10 8DB PO10 8BA PO10 8BP PO10 8DE |
| Thornham Lane | PO10 8DD |
| Trafalgar Close | PO10 8HQ |
| Tuppenny Lane | PO10 8HG |
| Valetta Road | PO10 8DY |
| Valiant Road | PO10 8DX |
| Varsity Road | PO10 8DU |
| Victor Road | PO10 8DZ |
| Victoria Terrace | PO10 8AE PO10 8HX |
| Vulcan Road | PO10 8DT |
| Wentworth Drive | PO10 8EF |
| Whitchers Walk | PO10 8FX |
| Windsor Close | PO10 8GH |
| Wodehouse Way | PO10 8FY |
| Woodfield Park Road | PO10 8BE PO10 8BG PO10 8BQ |
| Worcester Drive | PO10 8GL |
Transport near Southbourne
- FAQ
- Price Paid By Year
- Property Type Price
Frequently asked questions about Southbourne
What is the average price for a property for sale in Southbourne?
The average price for a property for sale in Southbourne is £421,101. This amount is 1% lower than the average price in Emsworth. There are 1,729 property listings for sale in Southbourne.
What streets have the most expensive properties for sale in Southbourne?
The streets with the most expensive properties for sale in Southbourne are Ham Lane at an average of £1,525,000, Prinsted Lane at an average of £940,000 and Southbourne Avenue at an average of £800,500.
What streets have the most affordable properties for sale in Southbourne?
The streets with the most affordable properties for sale in Southbourne are Doric Close at an average of £110,000, Malling Way at an average of £142,666 and Prinsted Gardens at an average of £197,500.
Which train stations are available in or near Southbourne?
Some of the train stations available in or near Southbourne are Southbourne, Emsworth and Nutbourne.
Property Price Paid in Southbourne by Year
The average sold property price by year was:
| Year | Average Sold Price | Price Change |
Sold Properties
|
|---|---|---|---|
| 2025 | £441,865 | 6% |
83 Properties |
| 2024 | £413,589 | 2% |
96 Properties |
| 2023 | £405,915 | -13% |
66 Properties |
| 2022 | £458,962 | 3% |
87 Properties |
| 2021 | £446,459 | 13% |
155 Properties |
| 2020 | £387,025 | -3% |
116 Properties |
| 2019 | £398,428 | 6% |
142 Properties |
| 2018 | £374,182 | -4% |
95 Properties |
| 2017 | £390,170 | 4% |
100 Properties |
| 2016 | £376,189 | 9% |
99 Properties |
| 2015 | £343,614 | 18% |
101 Properties |
| 2014 | £280,423 | 1% |
125 Properties |
| 2013 | £276,380 | 3% |
96 Properties |
| 2012 | £267,918 | -14% |
82 Properties |
| 2011 | £305,858 | 8% |
73 Properties |
| 2010 | £281,512 | 6% |
81 Properties |
| 2009 | £263,528 | 11% |
89 Properties |
| 2008 | £235,590 | -16% |
62 Properties |
| 2007 | £273,879 | 10% |
131 Properties |
| 2006 | £245,972 | -2% |
141 Properties |
| 2005 | £251,996 | 17% |
126 Properties |
| 2004 | £209,622 | -6% |
118 Properties |
| 2003 | £222,361 | 24% |
85 Properties |
| 2002 | £169,990 | 16% |
136 Properties |
| 2001 | £142,670 | 15% |
98 Properties |
| 2000 | £121,093 | 15% |
87 Properties |
| 1999 | £102,892 | -5% |
113 Properties |
| 1998 | £108,048 | 18% |
123 Properties |
| 1997 | £88,452 | 6% |
154 Properties |
| 1996 | £83,282 | 7% |
99 Properties |
| 1995 | £77,392 | - |
62 Properties |
Property Price per Property Type in Southbourne
Here you can find historic sold price data in order to help with your property search.
The average Property Paid Price for specific property types in the last three years are:
| Property Type | Average Sold Price | Sold Properties |
|---|---|---|
| Flat | £185,518.00 | 25 Flats |
| Semi Detached House | £383,791.00 | 105 Semi Detached Houses |
| Detached House | £665,741.00 | 56 Detached Houses |
| Terraced House | £355,124.00 | 59 Terraced Houses |

