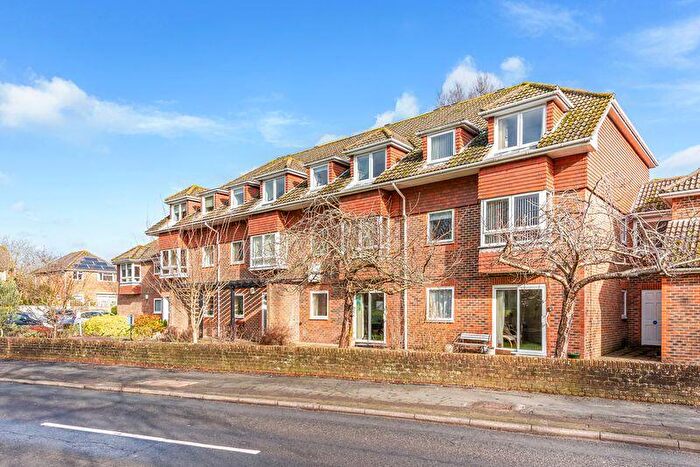
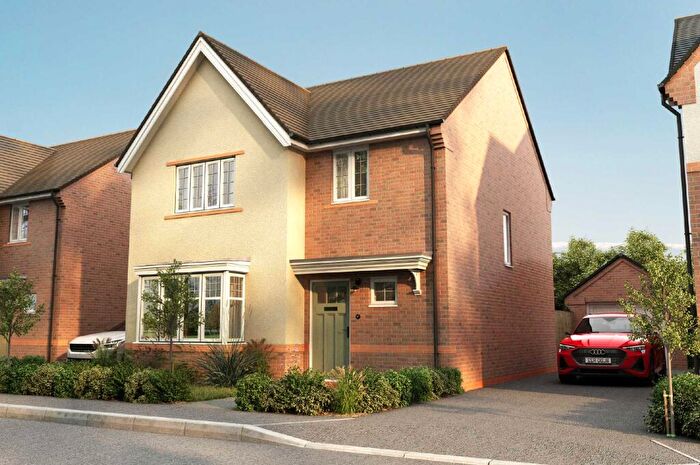
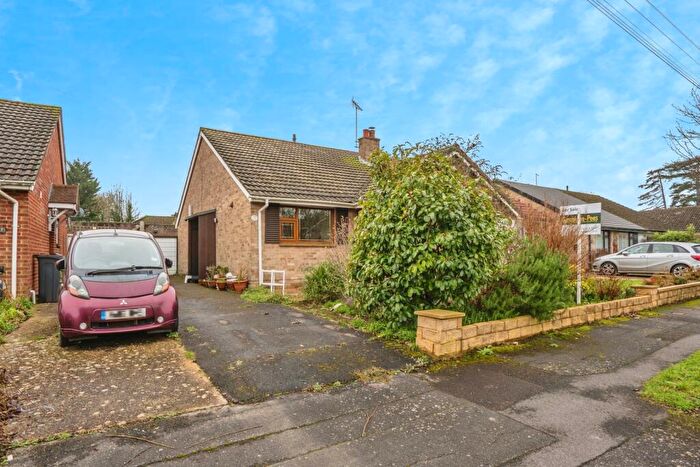
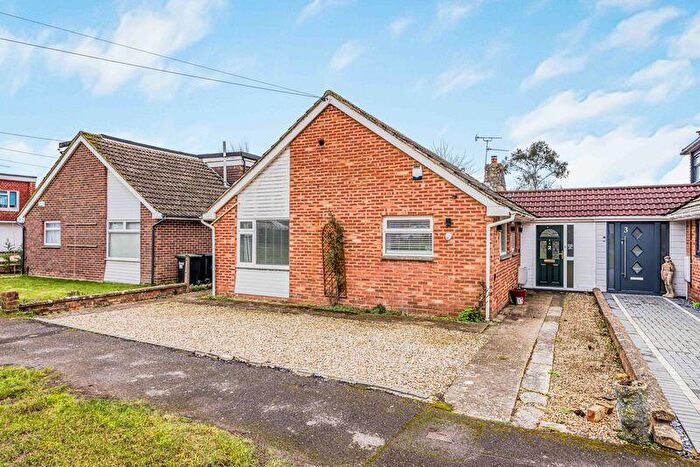
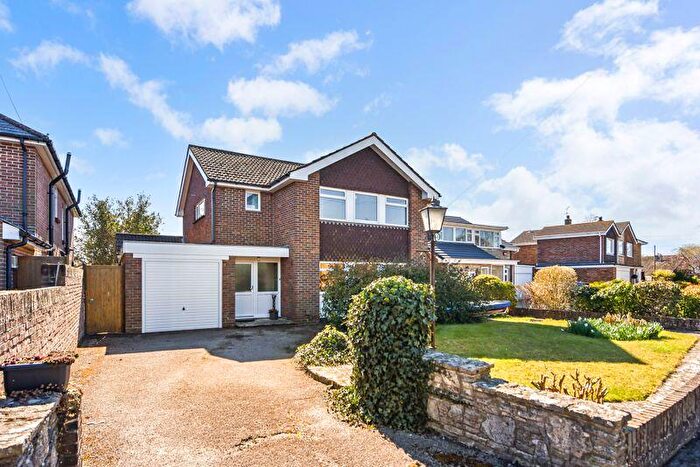
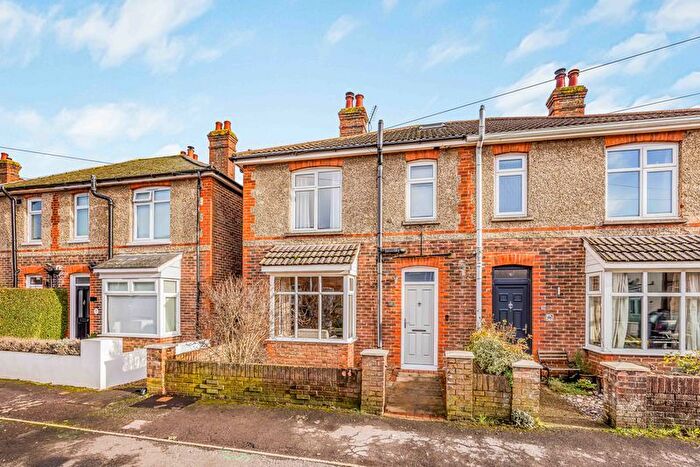
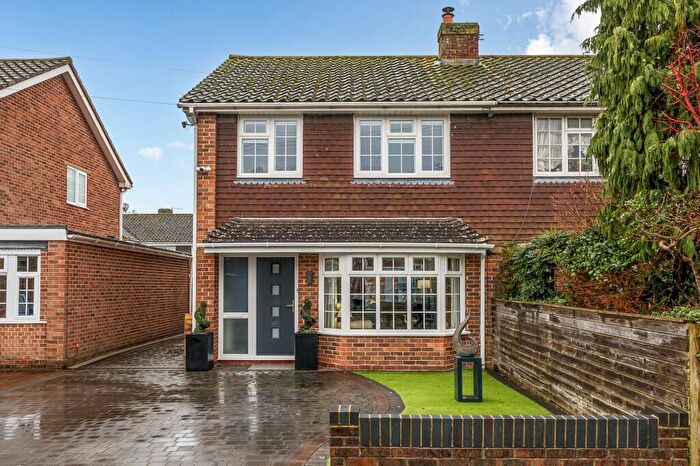
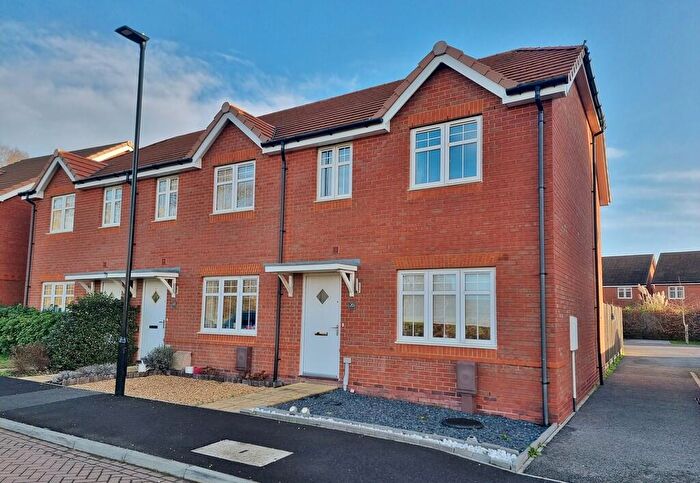
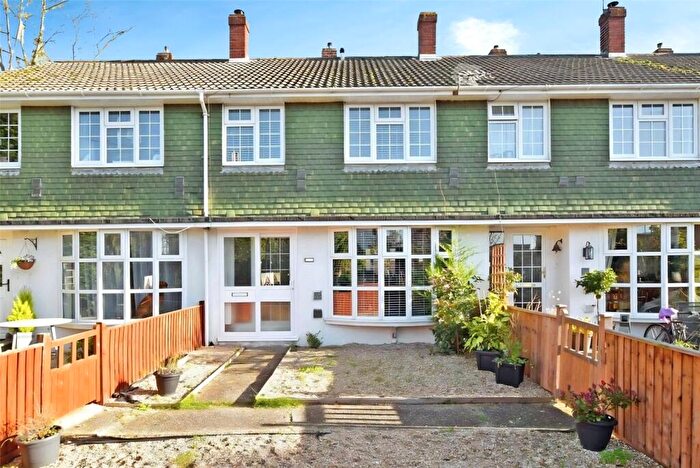
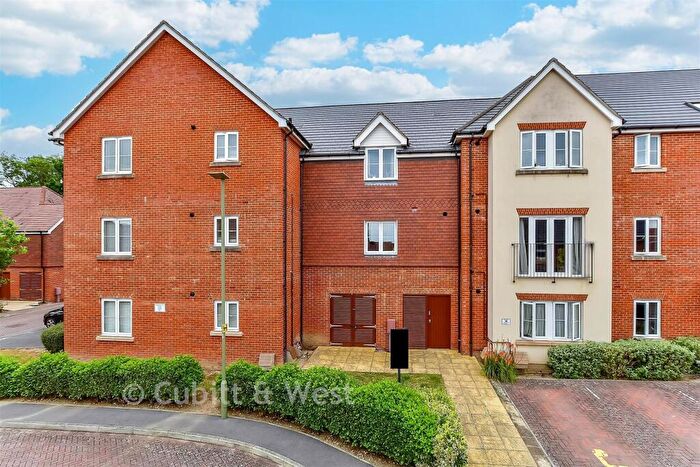
Houses for sale & to rent in Westbourne, Emsworth
House Prices in Westbourne
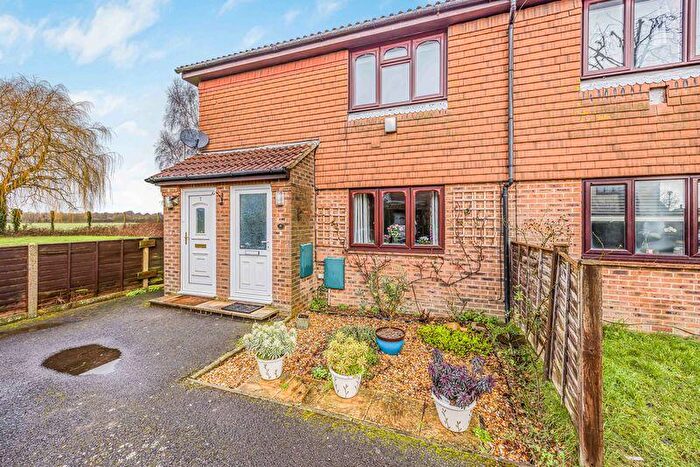
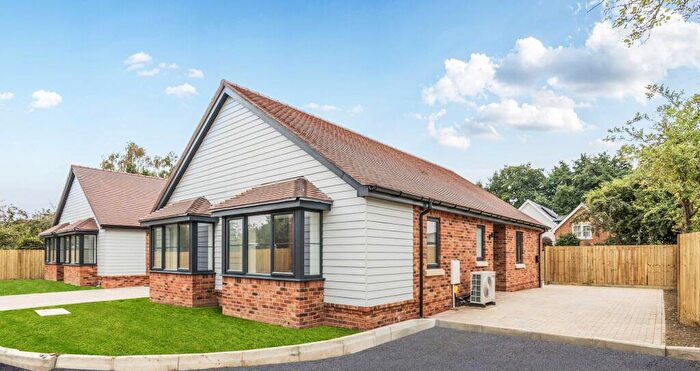
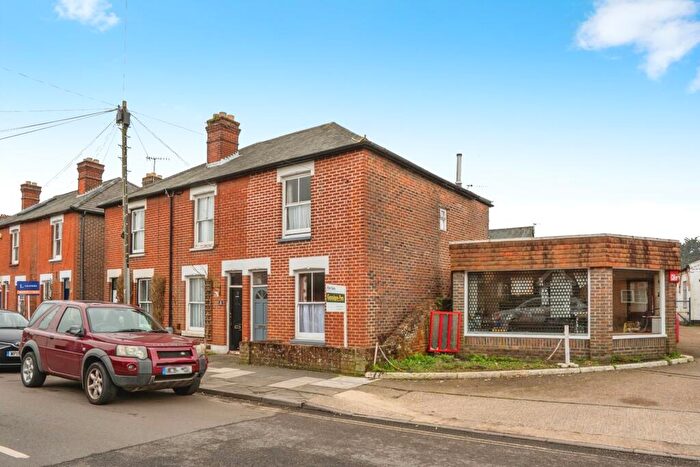
Properties in Westbourne have an average house price of £442,302.00 and had 71 Property Transactions within the last 3 years¹.
Westbourne is an area in Emsworth, Surrey with 992 households², where the most expensive property was sold for £1,350,000.00.
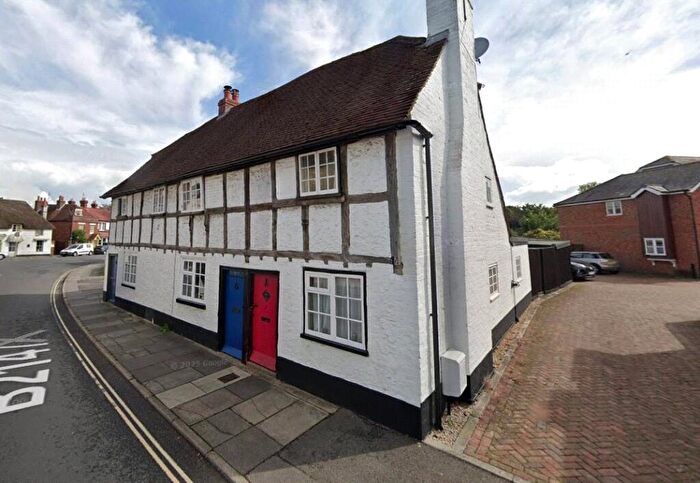
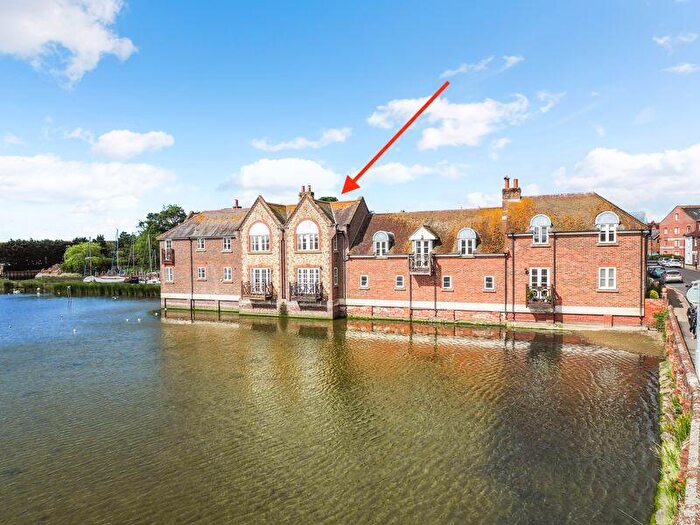
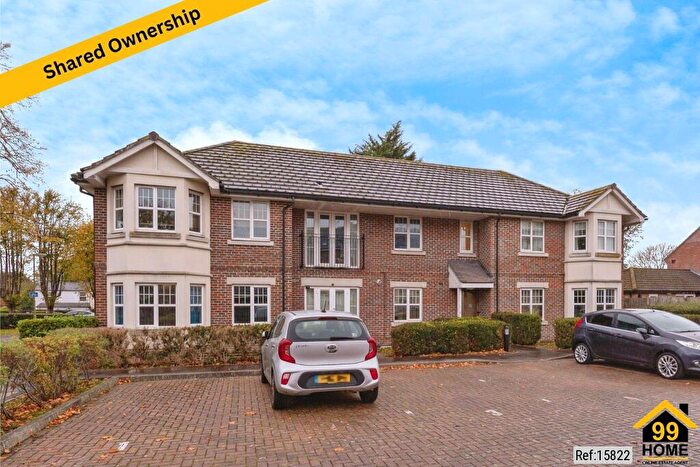
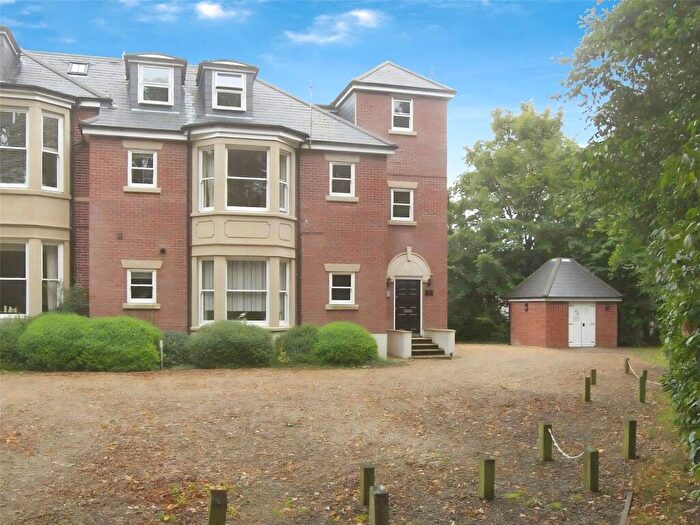
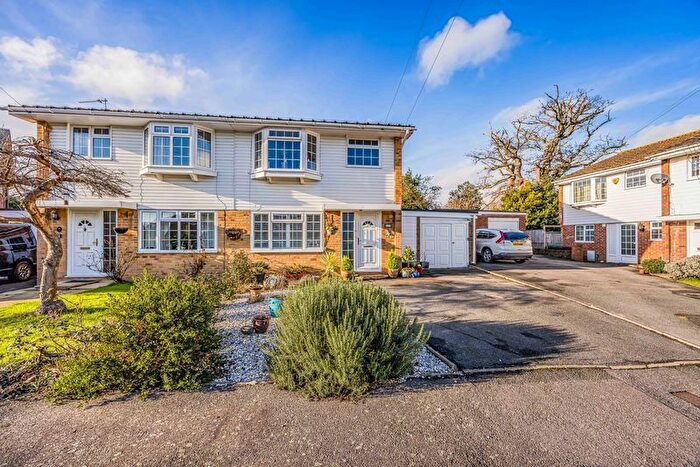
Properties for sale in Westbourne
Roads and Postcodes in Westbourne
Navigate through our locations to find the location of your next house in Westbourne, Emsworth for sale or to rent.
| Streets | Postcodes |
|---|---|
| Akela Way | PO10 8FF |
| Broad Walk | PO10 8RY |
| Byerley Close | PO10 8TS |
| Cedar Close | PO10 8TY |
| Cemetery Lane | PO10 8QA PO10 8QB PO10 8RR PO10 8SB PO10 8RZ |
| Chantry Hall | PO10 8FG |
| Church Road | PO10 8UA |
| Churcher Road | PO10 8TJ |
| Common Road | PO10 8QX PO10 8QY |
| Commonside | PO10 8TA PO10 8TU |
| Covington Road | PO10 8SY |
| Crockford Road | PO10 8TW PO10 8TZ |
| Dell Cottages | PO10 8RG |
| Devon Terrace | PO10 8SQ |
| Duffield Lane | PO10 8PZ |
| Dukes Close | PO10 8FA |
| East Street | PO10 8RP PO10 8RW PO10 8SE PO10 8SH |
| Edgell Road | PO10 8UP PO10 8UR PO10 8UT |
| Ellesmere Orchard | PO10 8TP PO10 8TR |
| Emsworth Common Road | PO10 8QL |
| Foxbury Lane | PO10 8RH PO10 8RJ PO10 8RL PO10 8RN |
| Grebe Close | PO10 8UY |
| Harold Road | PO10 8SJ |
| Homefield Road | PO10 8TN |
| Jubilee Terrace | PO10 8SG |
| King Street | PO10 8UG |
| Kingfisher Drive | PO10 8UZ |
| Lansdowne Terrace | PO10 8TE |
| Lark Way | PO10 8UU |
| Lingfield Close | PO10 8FE |
| Long Copse Lane | PO10 8SU |
| Mallard Way | PO10 8US |
| Maple Villas | PO10 8TD |
| Marlpit Lane | PO10 8EQ |
| Mill Lane | PO10 8RT PO10 8RA |
| Mill Road | PO10 8TH |
| Monks Hill | PO10 8QP PO10 8SX |
| New Road | PO10 8UH |
| Nightingale Court | PO10 8UD |
| North Street | PO10 8SL PO10 8SN PO10 8SP PO10 8SR PO10 8SS PO10 8SW PO10 8UN |
| Old Farm Lane | PO10 8RU PO10 8RX |
| Old Rectory Close | PO10 8UB |
| Paradise Lane | PO10 8ST |
| River Street | PO10 8TG |
| School Lane | PO10 8TL |
| Silverlock Place | PO10 8TB |
| South Lane | PO10 8PT |
| Sydenham Terrace | PO10 8SZ |
| The Grove | PO10 8UJ |
| The Shire | PO10 8FT |
| The Square | PO10 8UE |
| Victoria Terrace | PO10 8SF |
| Walnut Tree Drive | PO10 8QH |
| Westbourne Road | PO10 8UL |
| White Chimney Row | PO10 8RS PO10 8SD |
| Whitley Close | PO10 8TT |
| Willow Gardens | PO10 8TX |
| Woodmancote Lane | PO10 8RB |
| PO10 8QD PO10 8QR PO10 8QT PO10 8RD PO10 8RE PO10 8RF PO10 8UX PO10 8QS PO10 8QU |
Transport near Westbourne
-
Emsworth Station
-
Southbourne Station
-
Nutbourne Station
-
Warblington Station
-
Rowland's Castle Station
-
Havant Station
- FAQ
- Price Paid By Year
- Property Type Price
Frequently asked questions about Westbourne
What is the average price for a property for sale in Westbourne?
The average price for a property for sale in Westbourne is £442,302. This amount is 4% higher than the average price in Emsworth. There are 1,878 property listings for sale in Westbourne.
What streets have the most expensive properties for sale in Westbourne?
The streets with the most expensive properties for sale in Westbourne are White Chimney Row at an average of £1,025,000, South Lane at an average of £750,000 and Mallard Way at an average of £712,500.
What streets have the most affordable properties for sale in Westbourne?
The streets with the most affordable properties for sale in Westbourne are Crockford Road at an average of £162,416, Homefield Road at an average of £211,200 and Silverlock Place at an average of £295,000.
Which train stations are available in or near Westbourne?
Some of the train stations available in or near Westbourne are Emsworth, Southbourne and Nutbourne.
Property Price Paid in Westbourne by Year
The average sold property price by year was:
| Year | Average Sold Price | Price Change |
Sold Properties
|
|---|---|---|---|
| 2025 | £442,270 | -9% |
24 Properties |
| 2024 | £482,940 | 18% |
25 Properties |
| 2023 | £396,159 | -31% |
22 Properties |
| 2022 | £518,276 | 3% |
36 Properties |
| 2021 | £501,982 | 11% |
48 Properties |
| 2020 | £448,411 | 17% |
31 Properties |
| 2019 | £372,983 | 2% |
30 Properties |
| 2018 | £364,356 | -18% |
22 Properties |
| 2017 | £431,156 | 17% |
38 Properties |
| 2016 | £356,784 | 8% |
33 Properties |
| 2015 | £327,909 | 9% |
37 Properties |
| 2014 | £298,422 | -22% |
40 Properties |
| 2013 | £363,858 | 21% |
40 Properties |
| 2012 | £288,324 | 1% |
20 Properties |
| 2011 | £285,186 | -27% |
33 Properties |
| 2010 | £362,688 | 30% |
38 Properties |
| 2009 | £254,764 | -39% |
25 Properties |
| 2008 | £355,011 | 22% |
21 Properties |
| 2007 | £276,441 | -4% |
49 Properties |
| 2006 | £288,131 | 25% |
45 Properties |
| 2005 | £216,396 | -39% |
39 Properties |
| 2004 | £300,468 | 24% |
55 Properties |
| 2003 | £228,735 | 18% |
38 Properties |
| 2002 | £187,219 | 17% |
60 Properties |
| 2001 | £155,243 | 12% |
86 Properties |
| 2000 | £137,069 | 5% |
60 Properties |
| 1999 | £130,572 | 3% |
53 Properties |
| 1998 | £126,947 | 23% |
35 Properties |
| 1997 | £97,863 | 28% |
45 Properties |
| 1996 | £70,270 | -6% |
36 Properties |
| 1995 | £74,495 | - |
24 Properties |
Property Price per Property Type in Westbourne
Here you can find historic sold price data in order to help with your property search.
The average Property Paid Price for specific property types in the last three years are:
| Property Type | Average Sold Price | Sold Properties |
|---|---|---|
| Semi Detached House | £450,785.00 | 21 Semi Detached Houses |
| Detached House | £702,093.00 | 16 Detached Houses |
| Terraced House | £370,620.00 | 25 Terraced Houses |
| Flat | £159,777.00 | 9 Flats |

