
Houses for sale in Nork, Epsom
House Prices in Nork
Properties in Nork have an average house price of £731k and had 101 Property Transactions within the last 3 years¹.
Nork is an area in Epsom, Surrey with 950 households², where the most expensive property was sold for £1.65M.
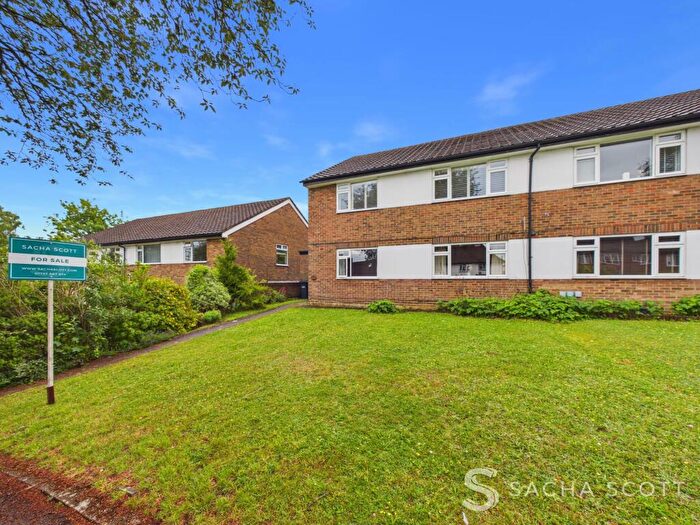
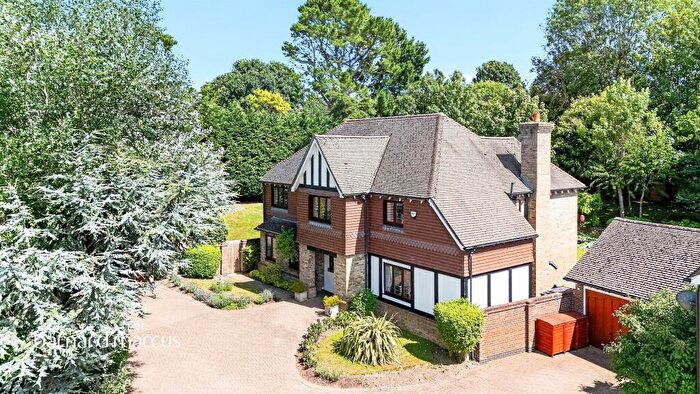
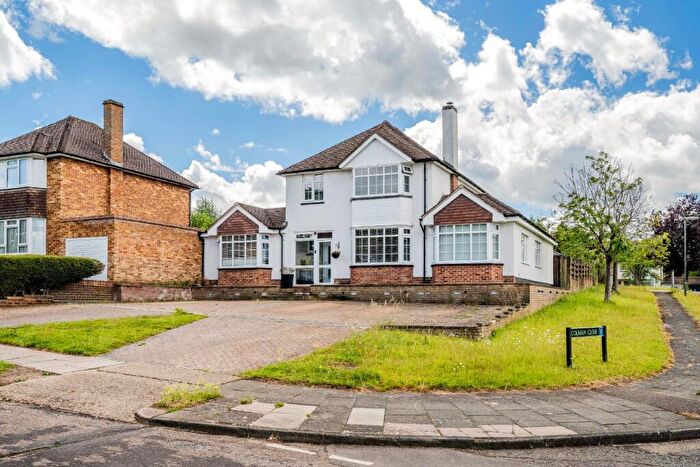
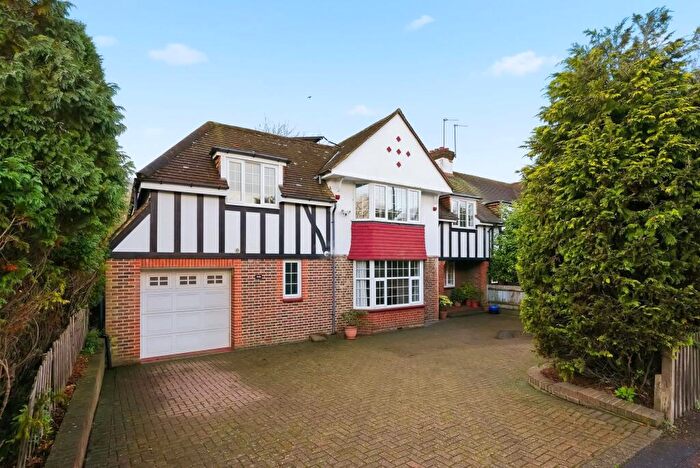
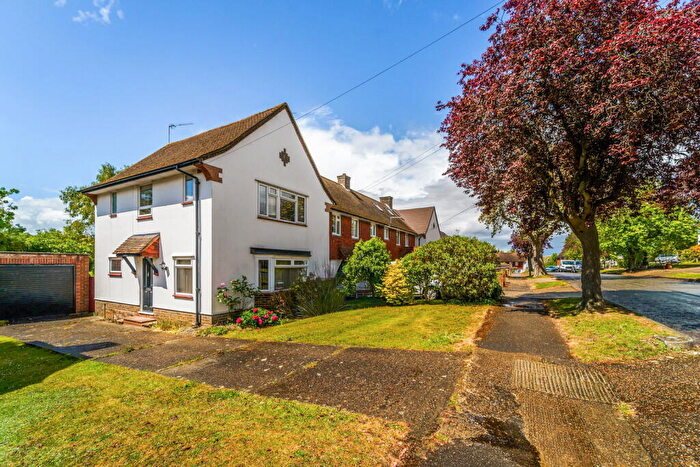
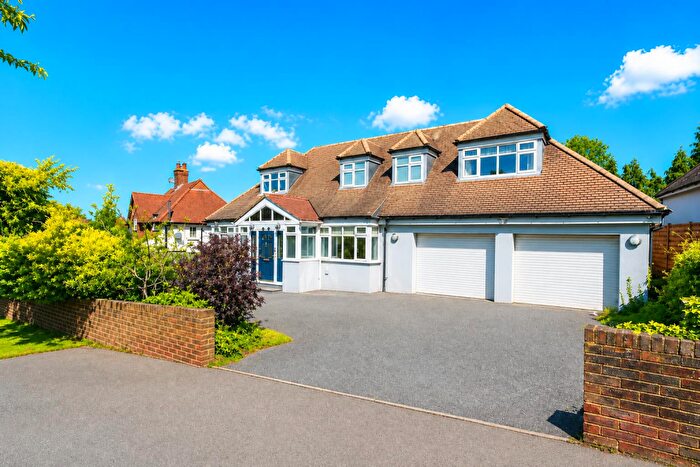
Properties for sale in Nork
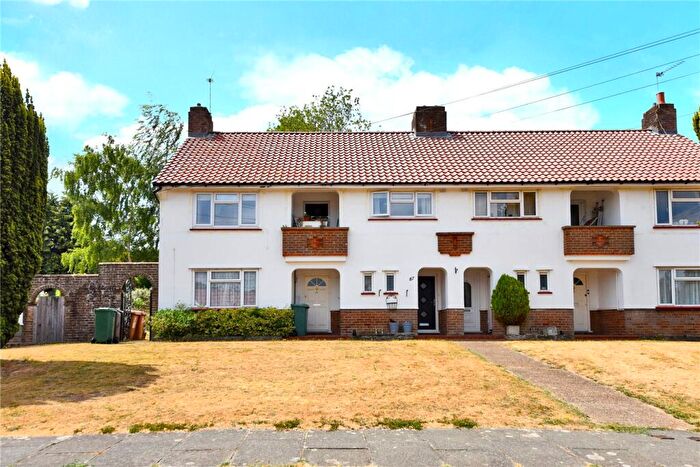
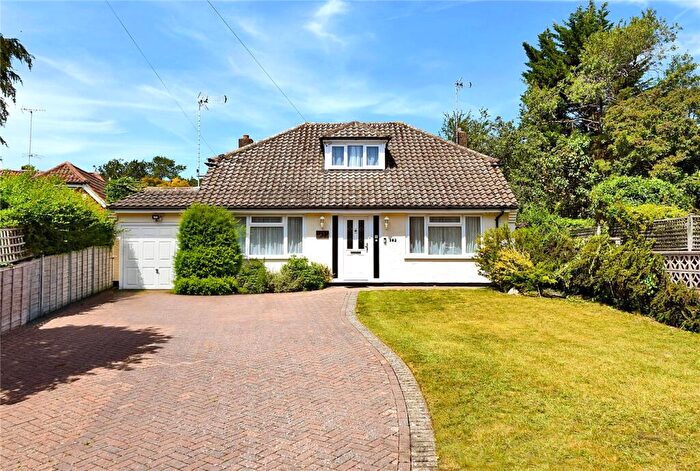
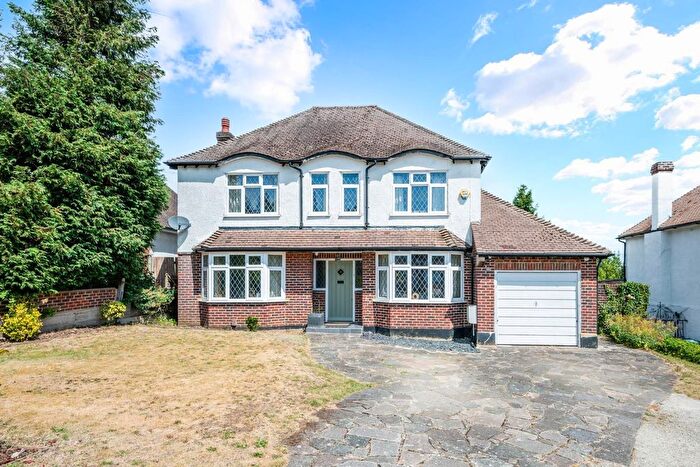
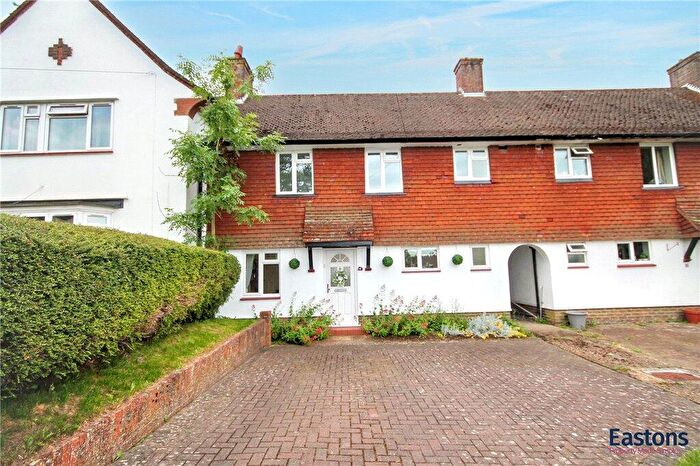
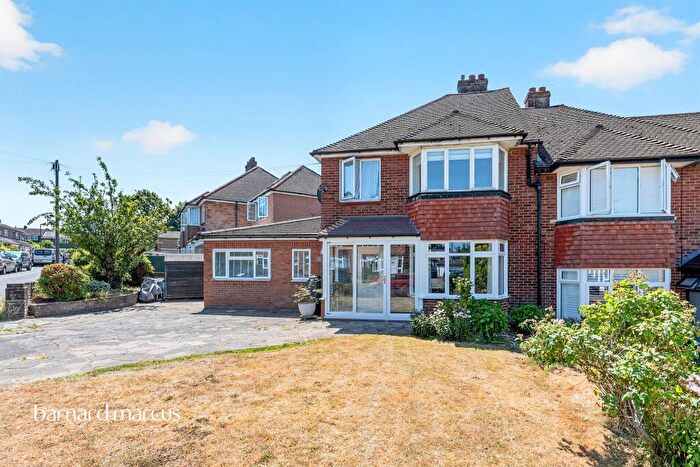
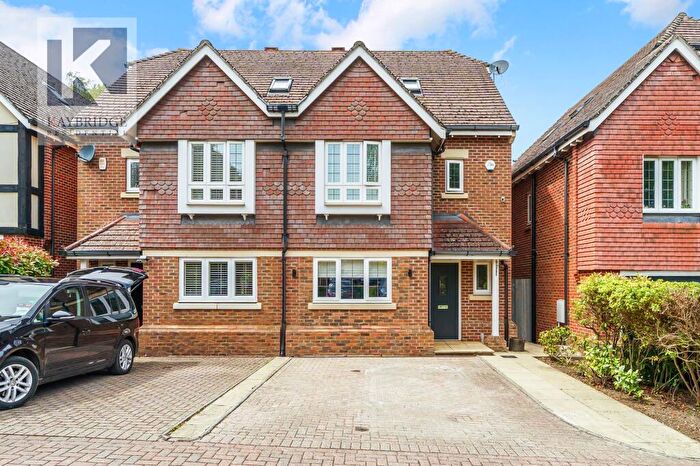
![]()
If you are looking to sell your house, let it out, or receive a property valuation, an expert can help you.
Click the button below to get started.
Roads and Postcodes in Nork
Navigate through our locations to find the location of your next house in Nork, Epsom for sale or to rent.
| Streets | Postcodes |
|---|---|
| Albertine Close | KT17 3NR |
| Amber Close | KT17 3BG |
| Bankside | KT17 3AR |
| Blackthorn Close | KT17 3DF |
| Brunswick Close | KT17 3LZ |
| Bunbury Way | KT17 4JP |
| Chestnut Way | KT17 3DQ |
| Claremount Close | KT18 5XN |
| Claremount Gardens | KT18 5XF |
| Downs Reach | KT17 3DJ |
| Elder Close | KT17 3DD |
| Elmshorn | KT17 3PE |
| Fir Tree Close | KT17 3LD |
| Fir Tree Road | KT17 3LB KT17 3LF KT17 3LG KT17 3LQ KT17 3NL KT17 3NN KT17 3NW |
| Frensham Way | KT17 3PA |
| Harkness Close | KT17 3PG |
| Honeysuckle Place | KT17 3DA |
| Hornbeam Close | KT17 3FG |
| Juniper Place | KT17 3BF |
| Kenmore Close | KT17 3FE |
| Linnet Close | KT17 3FJ |
| Mimosa Close | KT17 3FF |
| Montrouge Crescent | KT17 3NY KT17 3PB KT17 3PD KT17 3PF |
| Nower Close | KT18 5FN |
| Poplar Close | KT17 3LH |
| Reigate Road | KT17 3LA KT17 3JZ KT17 3LT KT17 3LU KT17 3LX KT17 3LY KT17 3NB KT18 5XA KT18 5XE |
| Rose Bushes | KT17 3NS KT17 3NT KT17 3NU KT17 3NX |
| Ruden Way | KT17 3LL KT17 3LN KT17 3LP KT17 3LW |
| Tabarin Way | KT17 3NZ |
| Talisman Way | KT17 3PQ |
| The Knolls | KT17 3ND |
| Warren Farm Close | KT17 3AJ |
| Whitebeam Close | KT17 3AU |
| Yew Tree Bottom Road | KT18 5UX KT18 5UZ KT18 5XS KT18 5XT KT17 3NE KT17 3NF KT17 3NH KT17 3NQ |
| Yew Tree Close | KT17 3AZ |
Property price trends in Nork
According to the latest Land Registry data, the average home in Nork sold for £857,500 in 2026. That figure comes from 1,353 sales logged over the past 31 years.
Prices have continued to climb over the last three years. Compared with 2023, when the typical sale came in around £786,828, that's a rise of roughly 9%.
Looking back five years, average prices are up about 23.2% since 2021, a gain of around £161,362 in cash terms.
Zoom out to the past decade for the fuller picture. Back in 2016, homes here averaged £628,846, so the typical sold price has climbed about 36.4% since then, roughly 3.1% a year. Stretch the view to fifteen years and that annual pace edges up closer to 4.5%.
Frequently asked questions about Nork
What is the average price for a property for sale in Nork?
The average price for a property for sale in Nork is £730,920. This amount is 27% higher than the average price in Epsom. There are 805 property listings for sale in Nork.
What streets have the most expensive properties for sale in Nork?
The streets with the most expensive properties for sale in Nork are Amber Close at an average of £982,500, Bunbury Way at an average of £922,333 and Elder Close at an average of £916,000.
What streets have the most affordable properties for sale in Nork?
The streets with the most affordable properties for sale in Nork are Reigate Road at an average of £503,750, Harkness Close at an average of £587,500 and Montrouge Crescent at an average of £596,500.
Which train stations are available in or near Nork?
Some of the train stations available in or near Nork are Epsom Downs, Tattenham Corner and Banstead.
Property Price Paid in Nork by Year
The average sold property price by year was:
| Year | Average Sold Price | Price Change |
Sold Properties
|
|---|---|---|---|
| 2026 | £857,500 | 16% |
2 Properties |
| 2025 | £724,462 | 6% |
27 Properties |
| 2024 | £684,225 | -15% |
40 Properties |
| 2023 | £786,828 | 2% |
32 Properties |
| 2022 | £768,577 | 9% |
38 Properties |
| 2021 | £696,138 | 3% |
59 Properties |
| 2020 | £674,439 | -3% |
33 Properties |
| 2019 | £696,172 | 1% |
37 Properties |
| 2018 | £690,026 | -1% |
37 Properties |
| 2017 | £697,637 | 10% |
58 Properties |
Property Price per Property Type in Nork
Here you can find historic sold price data in order to help with your property search.
The average Property Paid Price for specific property types in the last three years are:
| Property Type | Average Sold Price | Sold Properties |
|---|---|---|
| Semi Detached House | £738,777.00 | 27 Semi Detached Houses |
| Detached House | £874,306.00 | 49 Detached Houses |
| Terraced House | £566,900.00 | 10 Terraced Houses |
| Flat | £357,733.00 | 15 Flats |
