
Houses for sale in Epsom, Surrey
House Prices in Epsom
Properties in Epsom have an average house price of £575k and had 3,066 Property Transactions within the last 3 years.¹
Epsom is an area in Surrey with 31,434 households², where the most expensive property was sold for £3.5M.
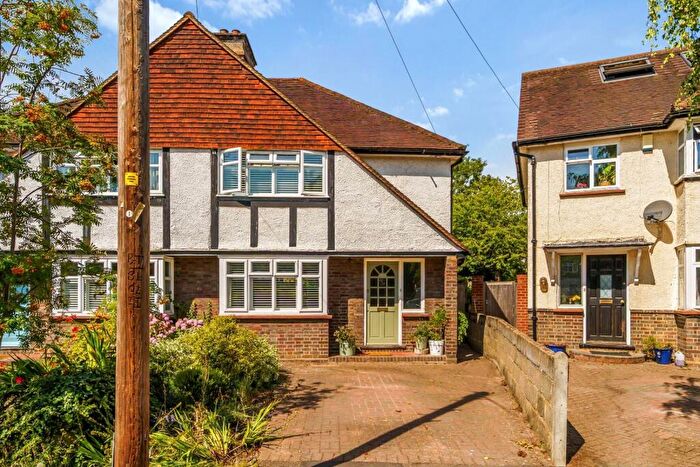
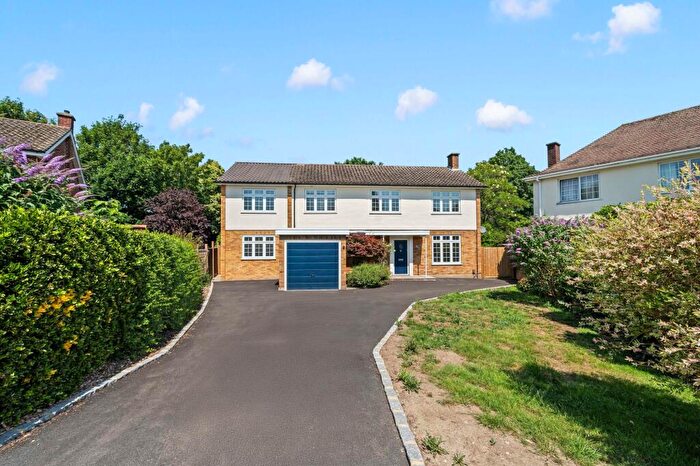
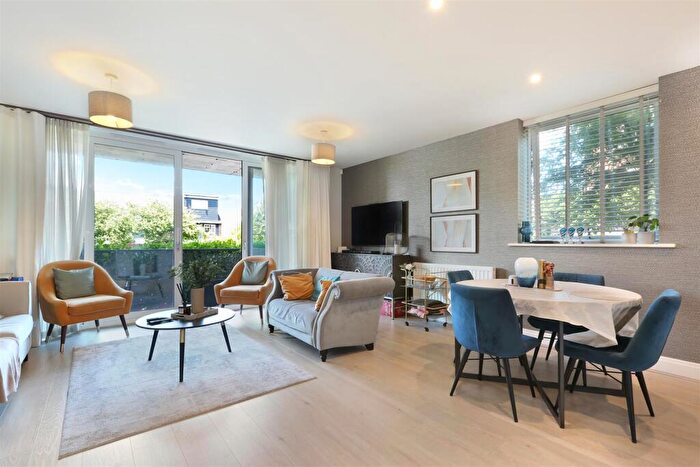
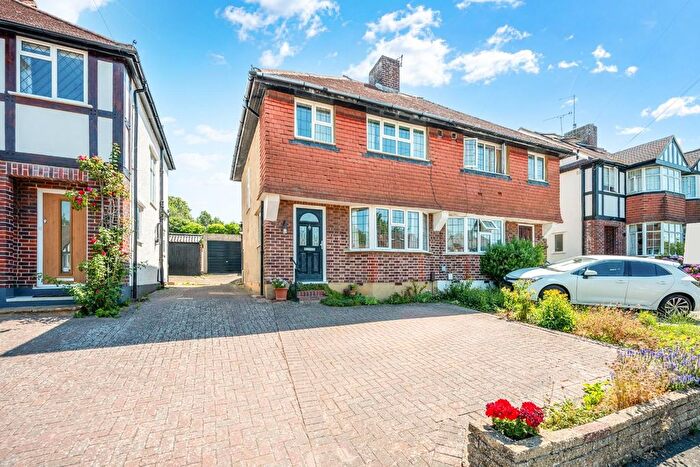
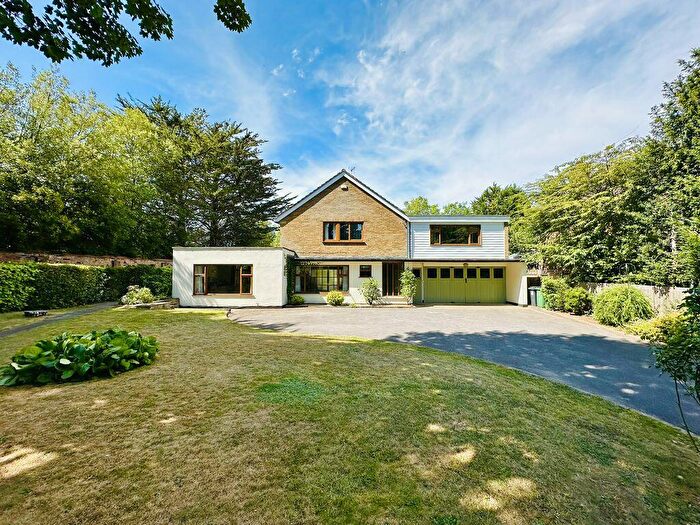
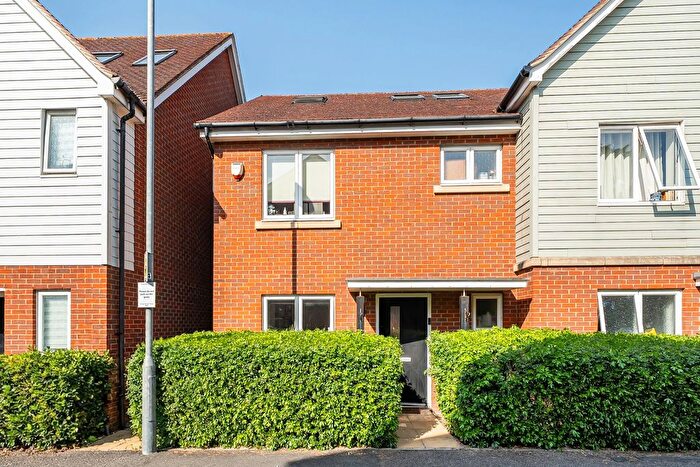
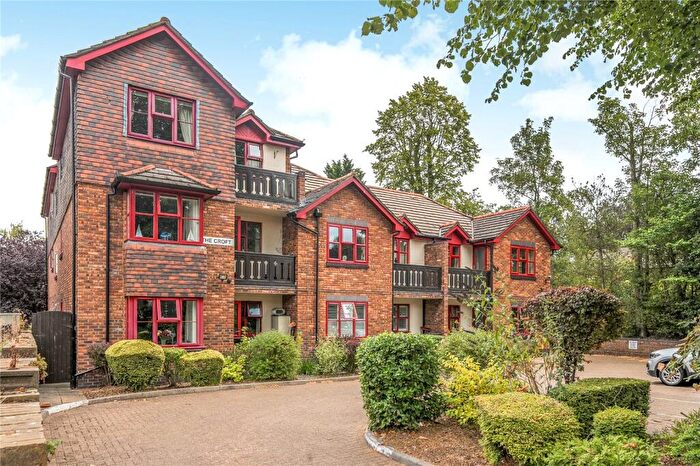
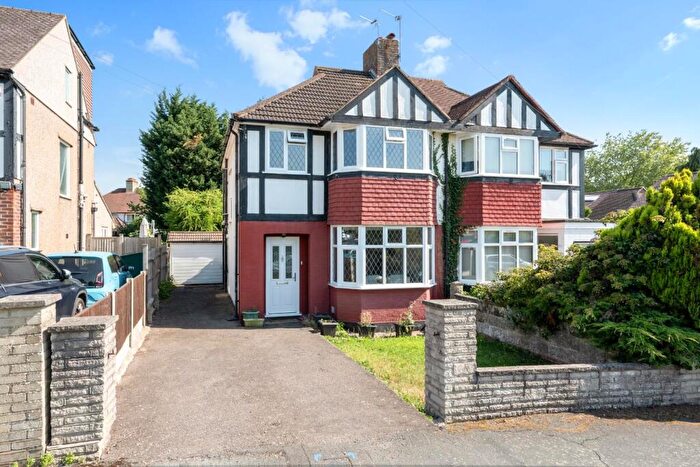
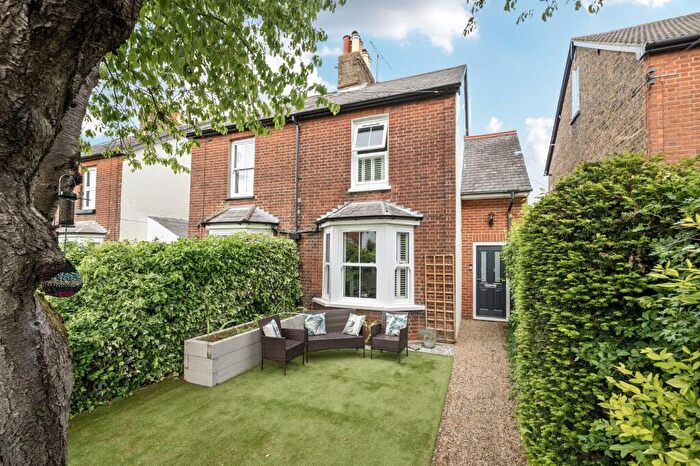
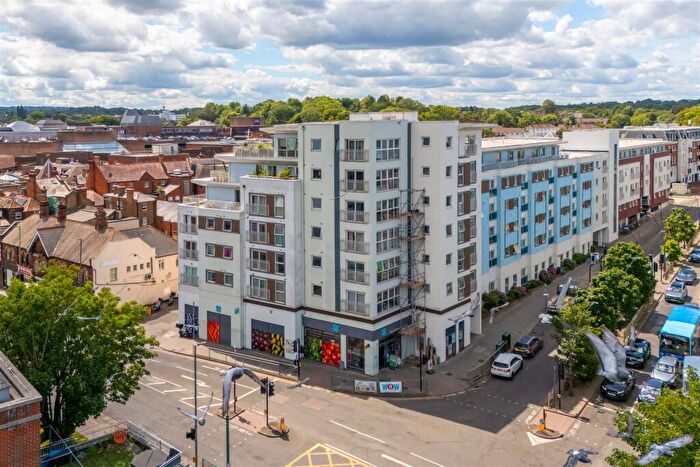
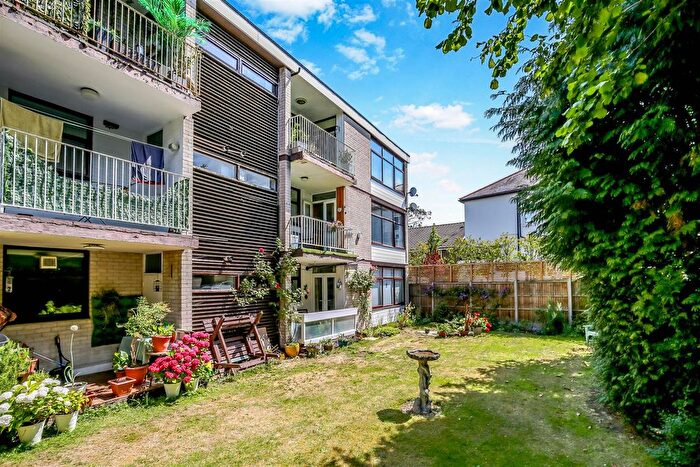
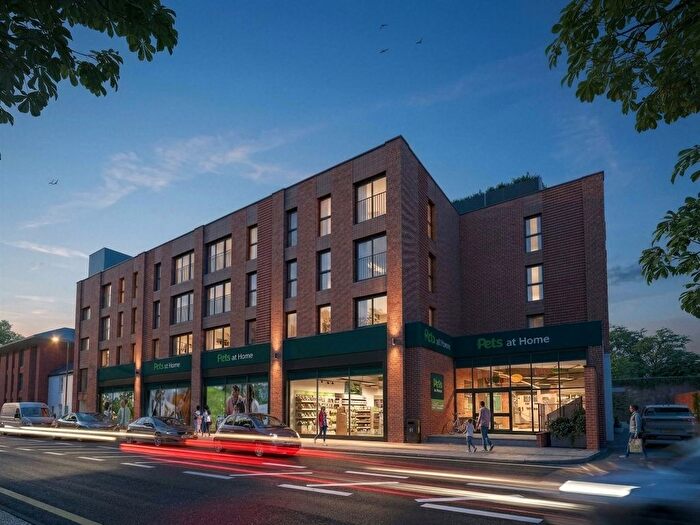
Properties for sale in Epsom
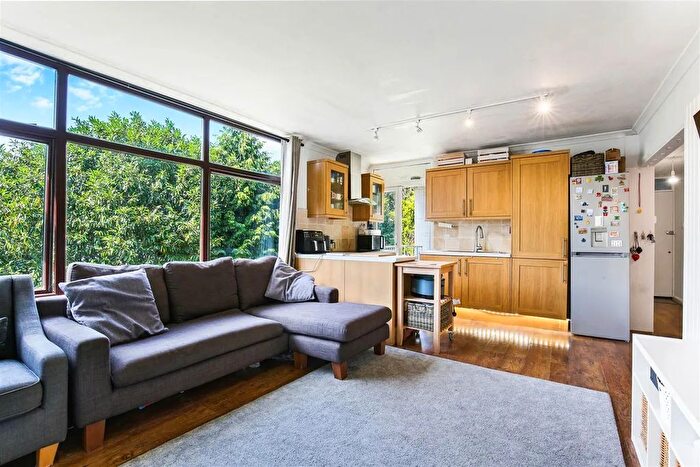
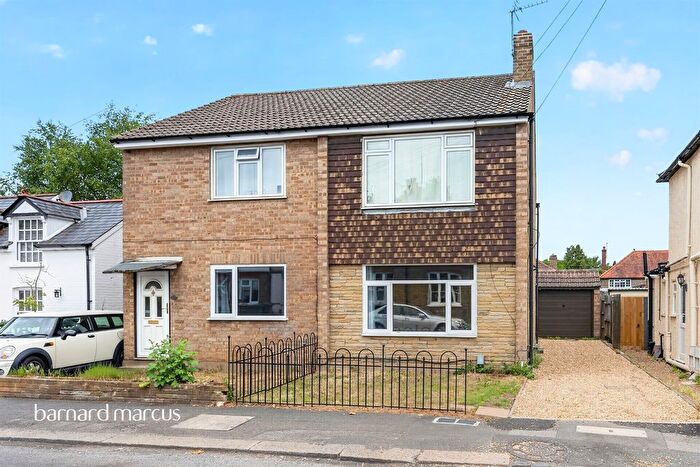
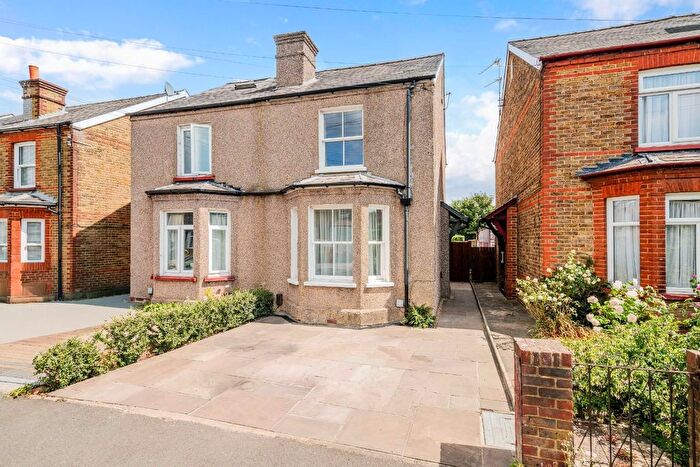
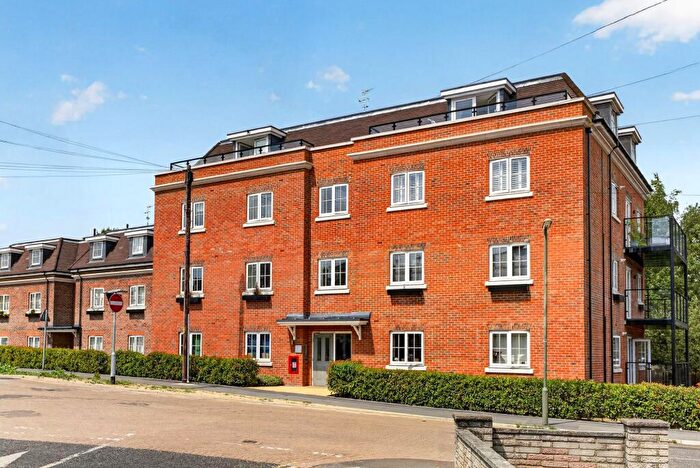
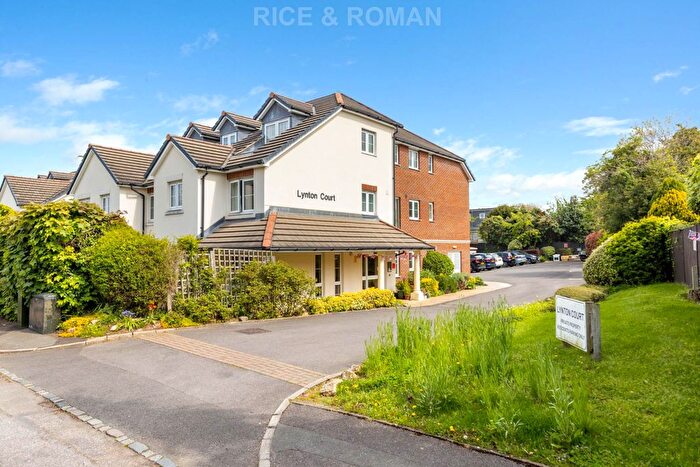
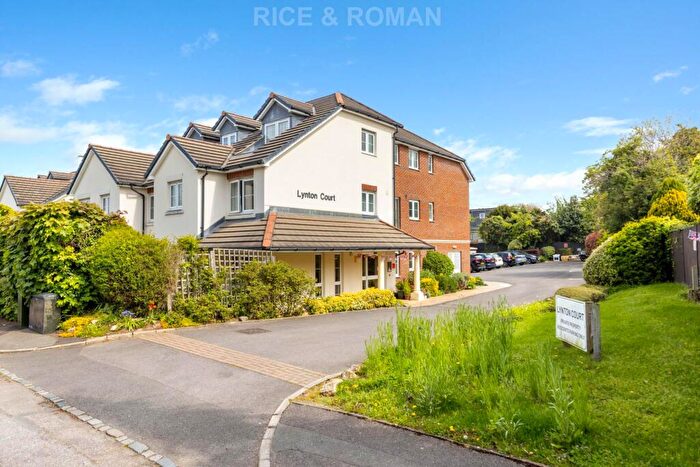
![]()
If you are looking to sell your house, let it out, or receive a property valuation, an expert can help you.
Click the button below to get started.


Neighbourhoods in Epsom
Navigate through our locations to find the location of your next house in Epsom, Surrey for sale or to rent.
Property price trends in Epsom
According to the latest Land Registry data, the average home in Epsom sold for £611,280 in 2026. That figure comes from a substantial record of 42,981 sales logged over the past 31 years.
Prices have moved up over the last three years. Compared with 2023, when the typical sale came in around £576,696, that's a rise of roughly 6%.
Looking back five years, average prices are up about 12.4% since 2021, a gain of around £67,557 in cash terms.
Zoom out to the past decade for the fuller picture. Back in 2016, homes here averaged £486,801, so the typical sold price has climbed about 25.6% since then, roughly 2.3% a year. Stretch the view to fifteen years and that annual pace edges up closer to 3.8%.
Frequently asked questions about Epsom
What is the average price for a property for sale in Epsom?
The average price for a property for sale in Epsom is £575,327. This amount is 6% lower than the average price in Surrey. There are more than 10,000 property listings for sale in Epsom.
What locations have the most expensive properties for sale in Epsom?
The locations with the most expensive properties for sale in Epsom are Nonsuch at an average of £997,657, Box Hill And Headley at an average of £902,266 and Tattenham Corner & Preston at an average of £778,166.
What locations have the most affordable properties for sale in Epsom?
The locations with the most affordable properties for sale in Epsom are Town at an average of £416,481, Ruxley at an average of £445,303 and Court at an average of £460,671.
Which train stations are available in or near Epsom?
Some of the train stations available in or near Epsom are Epsom, Ewell West and Ewell East.
Property Price Paid in Epsom by Year
The average sold property price by year was:
| Year | Average Sold Price | Price Change |
Sold Properties
|
|---|---|---|---|
| 2026 | £611,280 | 6% |
65 Properties |
| 2025 | £577,169 | 1% |
969 Properties |
| 2024 | £570,082 | -1% |
1,044 Properties |
| 2023 | £576,696 | -4% |
988 Properties |
| 2022 | £599,152 | 9% |
1,155 Properties |
| 2021 | £543,723 | 4% |
1,573 Properties |
| 2020 | £522,203 | 2% |
1,146 Properties |
| 2019 | £512,322 | -1% |
1,171 Properties |
| 2018 | £515,638 | 2% |
1,113 Properties |
| 2017 | £507,359 | 4% |
1,258 Properties |
Property Price per Property Type in Epsom
Here you can find historic sold price data in order to help with your property search.
The average Property Paid Price for specific property types in the last three years are:
| Property Type | Average Sold Price | Sold Properties |
|---|---|---|
| Semi Detached House | £617,865.00 | 1,041 Semi Detached Houses |
| Terraced House | £493,006.00 | 504 Terraced Houses |
| Detached House | £904,230.00 | 664 Detached Houses |
| Flat | £317,235.00 | 857 Flats |
Transport in Epsom
Please see below transportation links in this area:
