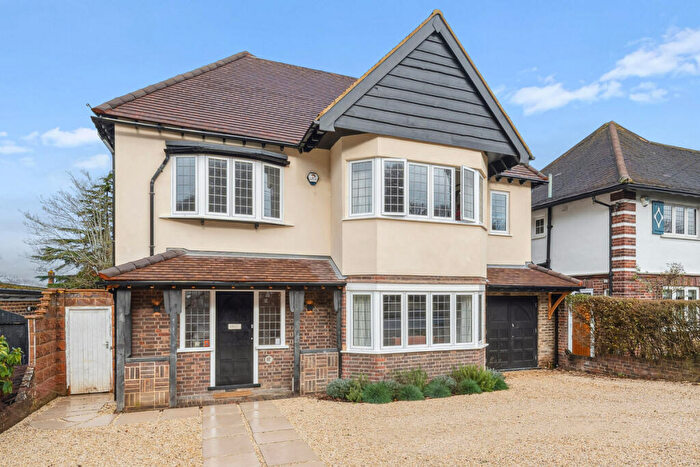
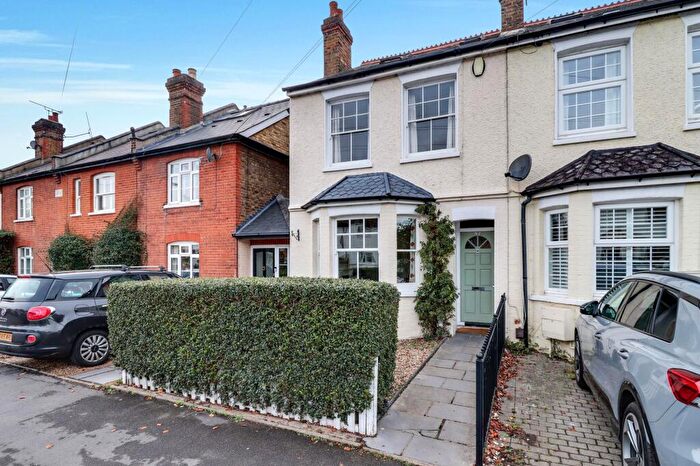
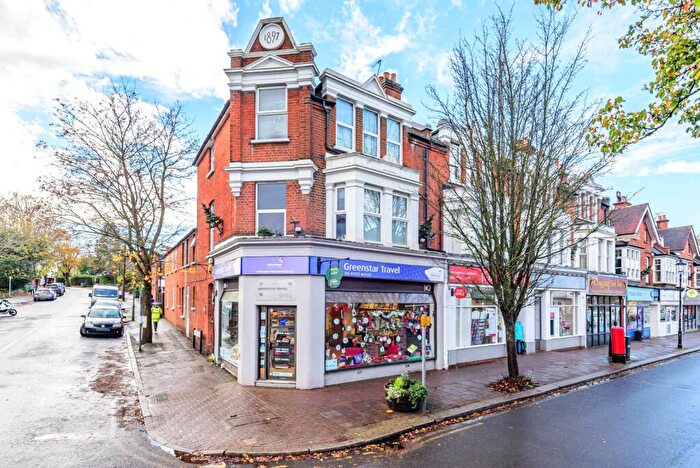
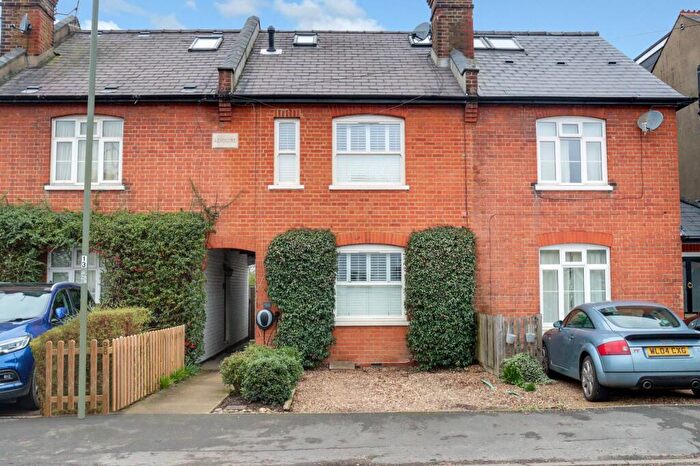
Houses for sale & to rent in Claygate, Esher
House Prices in Claygate
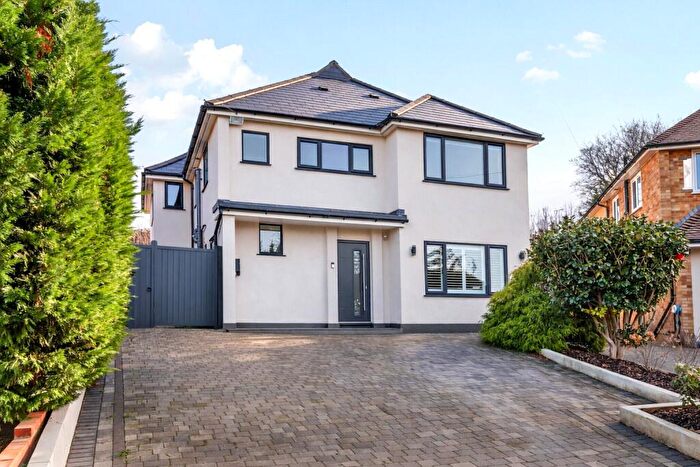
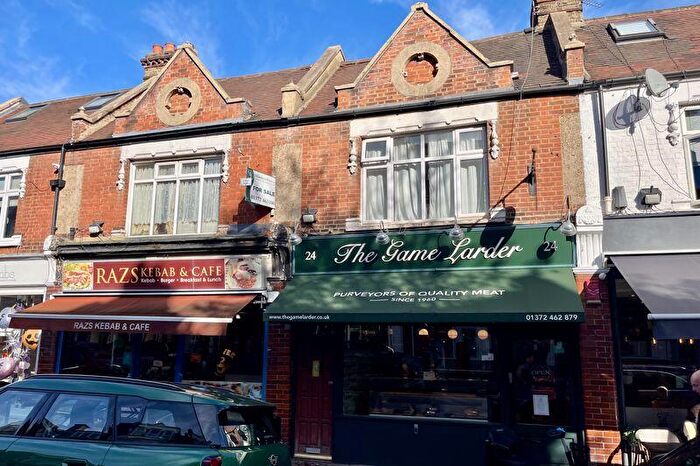
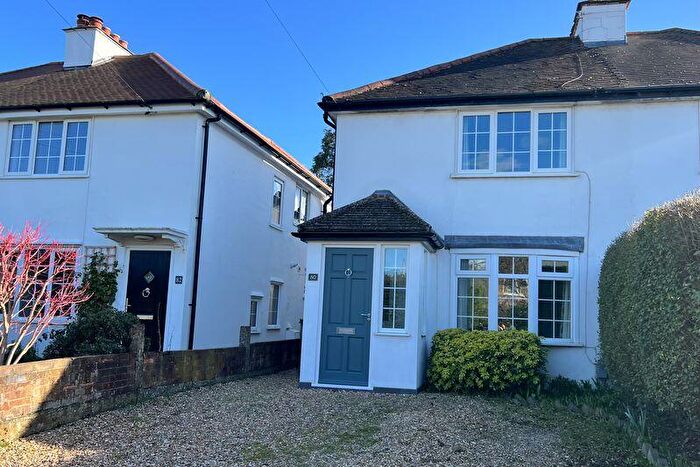
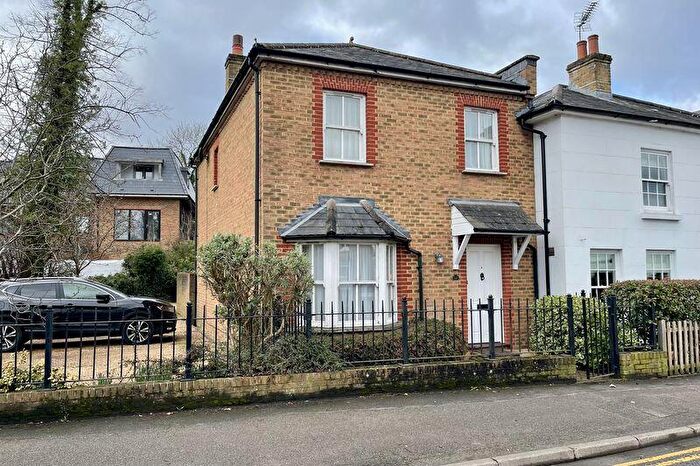
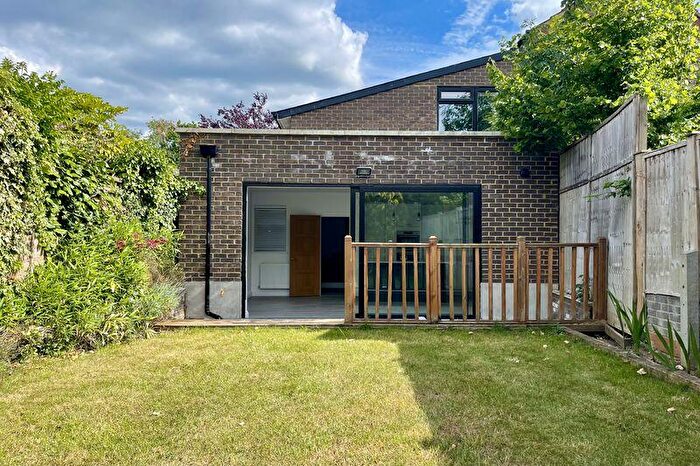
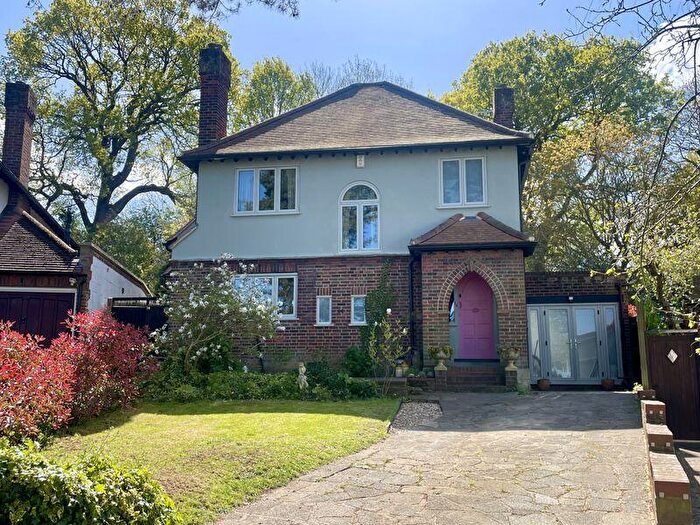
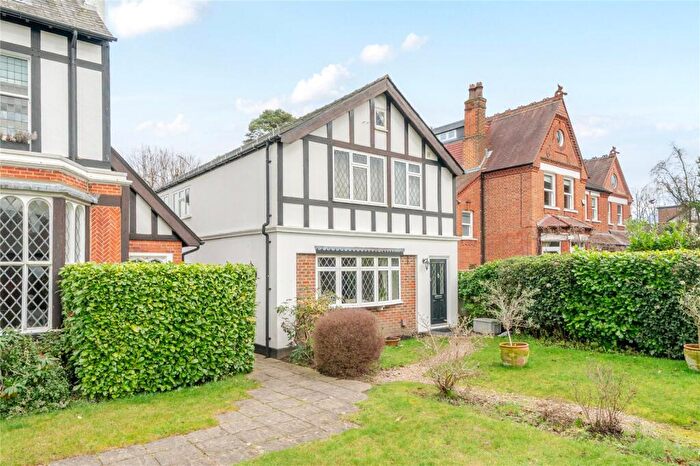
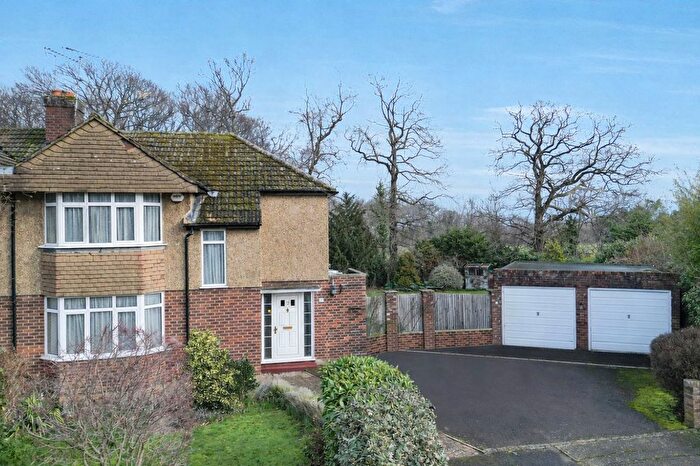
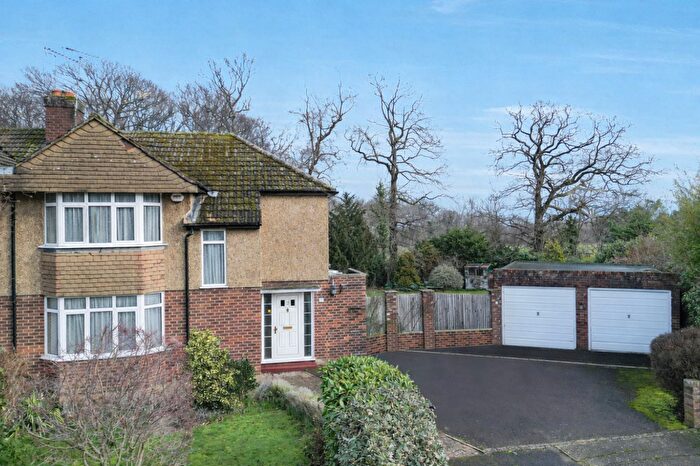
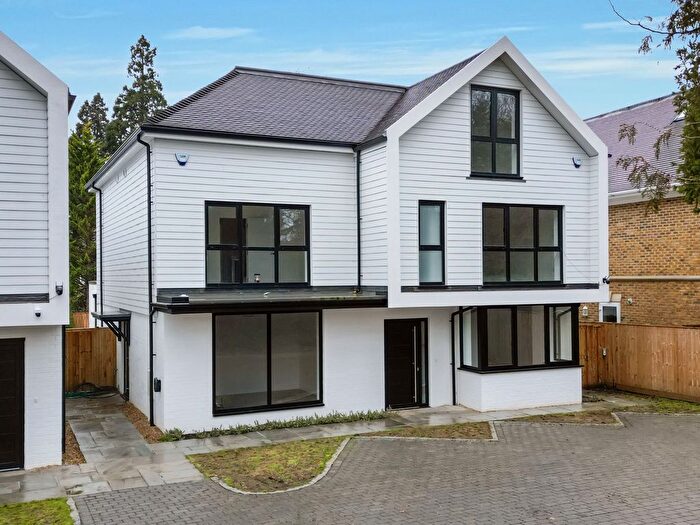
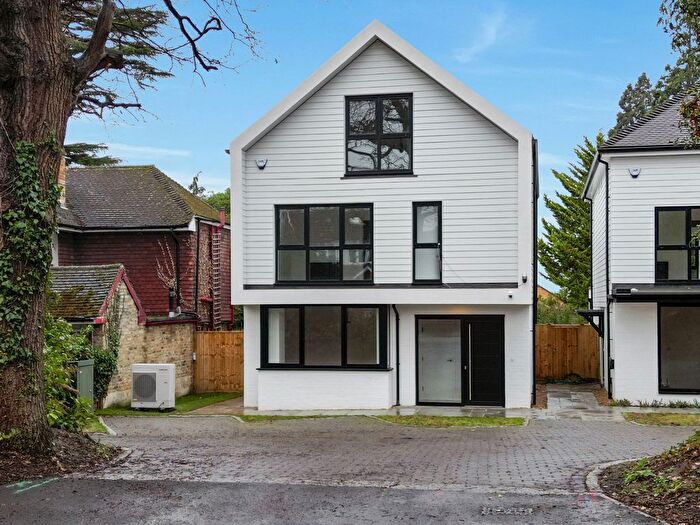
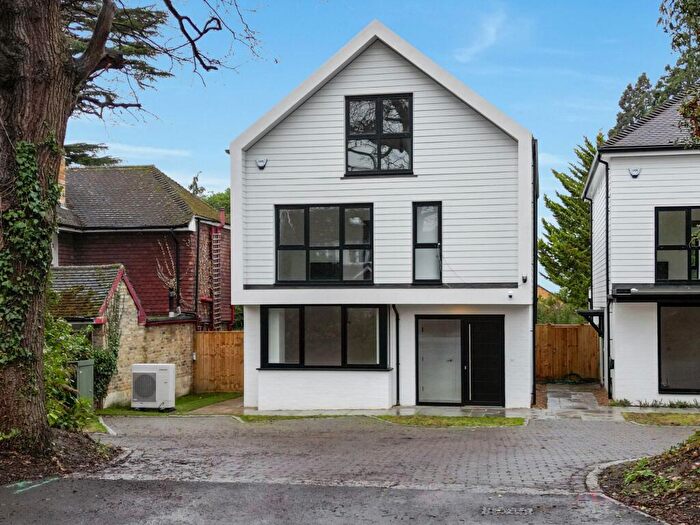
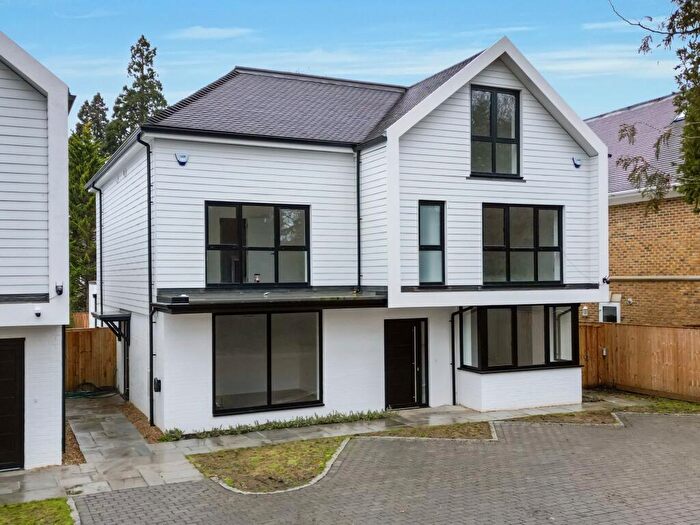
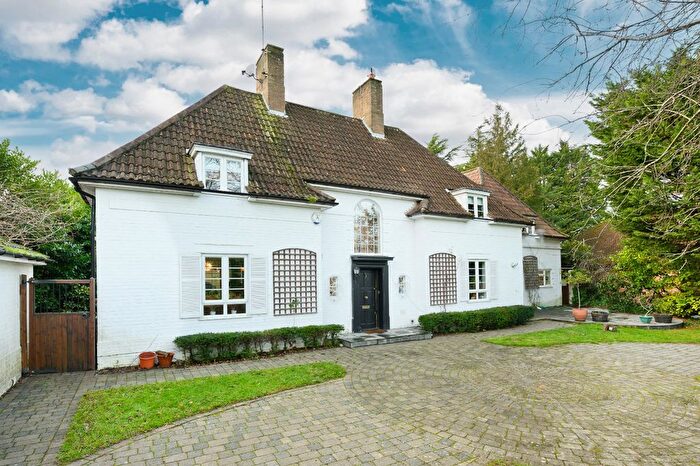
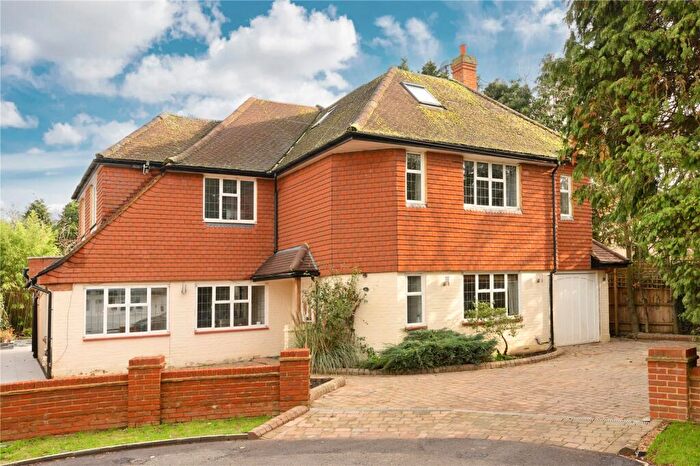
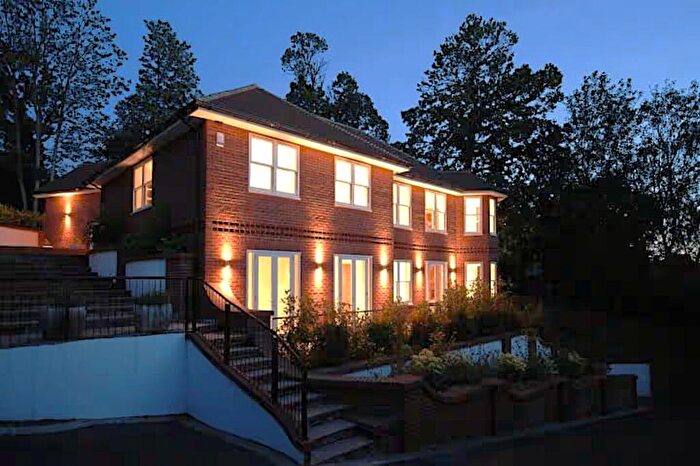
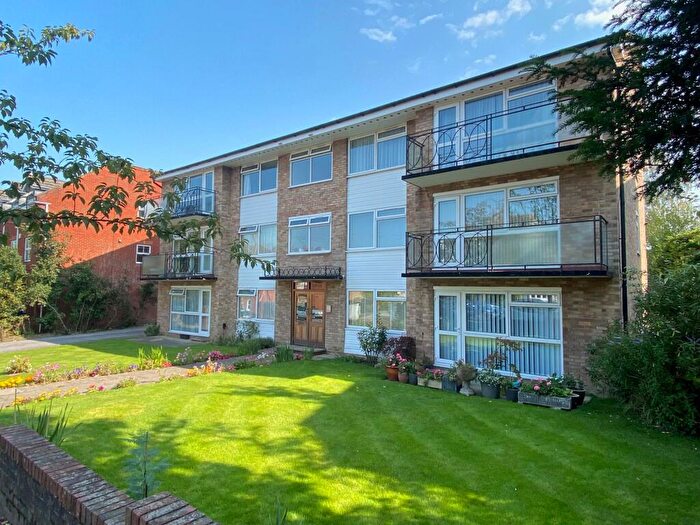
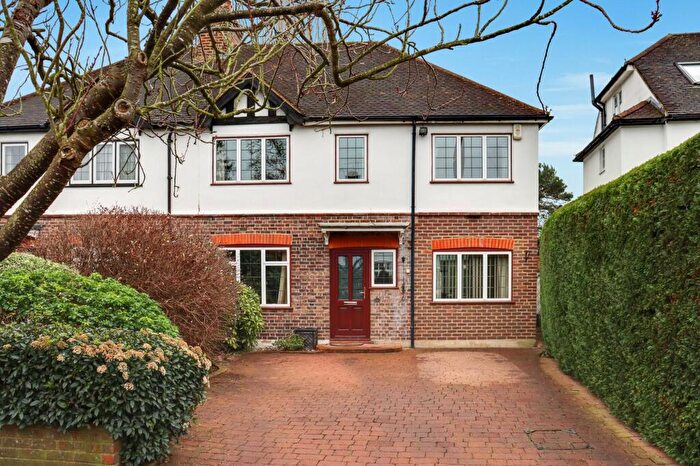
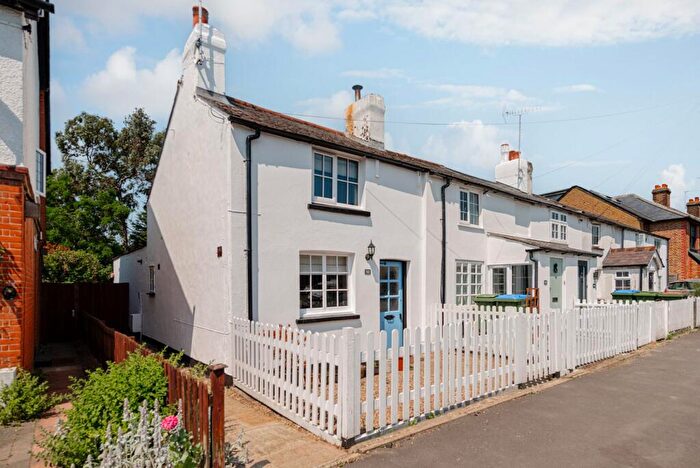
Properties in Claygate have an average house price of £935,590.00 and had 255 Property Transactions within the last 3 years¹.
Claygate is an area in Esher, Surrey with 2,790 households², where the most expensive property was sold for £2,473,000.00.
Properties for sale in Claygate
Roads and Postcodes in Claygate
Navigate through our locations to find the location of your next house in Claygate, Esher for sale or to rent.
| Streets | Postcodes |
|---|---|
| Albany Crescent | KT10 0PE KT10 0PF KT10 0DQ KT10 0PG |
| Applegarth | KT10 0ED |
| Ashton Place | KT10 0BN |
| Aston Road | KT10 0RR |
| Beaconsfield Gardens | KT10 0PX |
| Beaconsfield Road | KT10 0PN KT10 0PW |
| Berkeley Gardens | KT10 0TP |
| Blakeden Drive | KT10 0JR |
| Bridle Road | KT10 0ET |
| Brookfield Gardens | KT10 0DS |
| Caerleon Close | KT10 0TY |
| Cavendish Drive | KT10 0QE |
| Cedar Walk | KT10 0RN |
| Chadworth Way | KT10 9DB |
| Church Road | KT10 0AR KT10 0JD KT10 0JP KT10 0BF |
| Claremont Road | KT10 0PL |
| Claygate Lodge Close | KT10 0PS |
| Common Lane | KT10 0HY |
| Common Road | KT10 0HG KT10 0HJ KT10 0HU KT10 0HW |
| Cornwall Avenue | KT10 0HX |
| Coverts Road | KT10 0JU KT10 0JY KT10 0LE KT10 0LH KT10 0LJ KT10 0LL KT10 0LN |
| Crediton Way | KT10 0EB |
| Dalmore Avenue | KT10 0HQ |
| Denman Drive | KT10 0EA |
| Derwent Close | KT10 0RF |
| Dove Place | KT10 0LD |
| Elm Gardens | KT10 0JS |
| Elm Road | KT10 0EH KT10 0EJ |
| Fairlawn Close | KT10 0EN |
| Fawcus Close | KT10 0HF |
| Fee Farm Road | KT10 0JX |
| Firs Close | KT10 0NW |
| Fishersdene | KT10 0HT |
| Fitzalan Road | KT10 0LX |
| Foley Mews | KT10 0LR |
| Foley Road | KT10 0LU KT10 0LY KT10 0NA KT10 0NB KT10 0ND |
| Foley Wood | KT10 0LT |
| Forge Drive | KT10 0HR |
| Foxwarren | KT10 0JZ KT10 0LA KT10 0LB |
| Garden Villas | KT10 0NF |
| Glebelands | KT10 0LF |
| Glenavon Close | KT10 0HP |
| Gordon Road | KT10 0PJ KT10 0PQ |
| Hare Lane | KT10 0QU KT10 0QX KT10 0QY KT10 0RA KT10 0RB KT10 0RD KT10 9BS KT10 9BT KT10 9BY KT10 0LZ KT10 0QT KT10 9BU KT10 9BX |
| Hermitage Close | KT10 0HH |
| High Foleys | KT10 0UA |
| High Street | KT10 0JG KT10 0JN KT10 0JW |
| Hillview Road | KT10 0TU |
| Holroyd Road | KT10 0LG KT10 0LQ |
| Homestead Gardens | KT10 0QF |
| Hurstbourne | KT10 0NG |
| Judge Walk | KT10 0RP |
| Kilnside | KT10 0HS |
| Kingsmead Park | KT10 0NS |
| Lane Gardens | KT10 0NP |
| Langbourne Way | KT10 0DZ |
| Littleworth Road | KT10 9FD KT10 9PN KT10 9FP |
| Loseberry Road | KT10 9DQ |
| Lower Wood Road | KT10 0EU |
| Meadow Road | KT10 0RZ |
| Melbury Close | KT10 0EX |
| Merrilyn Close | KT10 0EQ |
| Mountview Road | KT10 0UB KT10 0UD |
| Norfolk Road | KT10 0RS |
| Oaken Drive | KT10 0DL |
| Oaken Lane | KT10 0RE KT10 0RG KT10 0RQ |
| Oakhill | KT10 0TG |
| Old Claygate Lane | KT10 0ER |
| Queen Anne Drive | KT10 0PP |
| Raleigh Drive | KT10 9DE |
| Raymond Way | KT10 0EY |
| Red Lane | KT10 0EP KT10 0ES KT10 0EW |
| Redruth Gardens | KT10 0HD |
| Rosehill | KT10 0HL |
| Ruxley Crescent | KT10 0TX KT10 0TZ |
| Ruxley Ridge | KT10 0HZ |
| Ruxley Towers | KT10 0HA |
| Rythe Close | KT10 9DD |
| Rythe Road | KT10 9DF KT10 9DG |
| Simmil Road | KT10 0RT KT10 0RU |
| St Leonards Road | KT10 0EL |
| Station Road | KT10 9DH KT10 9DJ |
| Station Way | KT10 0QR KT10 0QS |
| Stevens Lane | KT10 0TD KT10 0TE KT10 0TH KT10 0TJ KT10 0TQ KT10 0TT |
| Stockfield Road | KT10 0QG |
| Sydney Terrace | KT10 0JJ |
| Telegraph Lane | KT10 0DT KT10 0DU KT10 0DY |
| The Avenue | KT10 0RX KT10 0RY |
| The Causeway | KT10 0NE KT10 0NH |
| The Elms | KT10 0JT |
| The Green | KT10 0JH KT10 0JQ KT10 0JL |
| The Maples | KT10 0TN |
| The Parade | KT10 0NU KT10 0PD KT10 0PA KT10 0PB |
| The Roundway | KT10 0DP KT10 0DW |
| The Willows | KT10 0PR |
| Thorne Close | KT10 0HE |
| Torrington Close | KT10 0SB |
| Torrington Road | KT10 0SA |
| Tower Gardens | KT10 0HB |
| Trystings Close | KT10 0TF |
| Vale Croft | KT10 0NX |
| Vale Road | KT10 0NJ KT10 0NL KT10 0NN |
| Westbury Avenue | KT10 0DN |
| Woodbourne Drive | KT10 0DR |
| Woodlands Close | KT10 0JF |
| Woodstock Lane South | KT10 0TA KT10 0TB |
| Woodward Close | KT10 0EG |
Transport near Claygate
-
Claygate Station
-
Hinchley Wood Station
-
Chessington South Station
-
Esher Station
-
Chessington North Station
-
Oxshott Station
-
Thames Ditton Station
-
Hersham Station
-
Surbiton Station
-
Tolworth Station
- FAQ
- Price Paid By Year
- Property Type Price
Frequently asked questions about Claygate
What is the average price for a property for sale in Claygate?
The average price for a property for sale in Claygate is £935,590. This amount is 14% lower than the average price in Esher. There are 732 property listings for sale in Claygate.
What streets have the most expensive properties for sale in Claygate?
The streets with the most expensive properties for sale in Claygate are Beaconsfield Gardens at an average of £2,446,500, Common Lane at an average of £2,400,000 and Fitzalan Road at an average of £2,176,600.
What streets have the most affordable properties for sale in Claygate?
The streets with the most affordable properties for sale in Claygate are Station Way at an average of £315,000, The Elms at an average of £365,000 and The Willows at an average of £415,000.
Which train stations are available in or near Claygate?
Some of the train stations available in or near Claygate are Claygate, Hinchley Wood and Chessington South.
Property Price Paid in Claygate by Year
The average sold property price by year was:
| Year | Average Sold Price | Price Change |
Sold Properties
|
|---|---|---|---|
| 2025 | £852,994 | -13% |
80 Properties |
| 2024 | £963,657 | -2% |
97 Properties |
| 2023 | £985,399 | 0,2% |
78 Properties |
| 2022 | £983,171 | 12% |
99 Properties |
| 2021 | £866,166 | 2% |
155 Properties |
| 2020 | £849,265 | 7% |
108 Properties |
| 2019 | £789,020 | -4% |
104 Properties |
| 2018 | £818,295 | -10% |
95 Properties |
| 2017 | £899,137 | 23% |
108 Properties |
| 2016 | £696,300 | -10% |
88 Properties |
| 2015 | £766,335 | 9% |
125 Properties |
| 2014 | £698,131 | 0,3% |
125 Properties |
| 2013 | £695,881 | 2% |
124 Properties |
| 2012 | £683,498 | 6% |
112 Properties |
| 2011 | £644,490 | 11% |
113 Properties |
| 2010 | £572,272 | 16% |
118 Properties |
| 2009 | £478,115 | -15% |
91 Properties |
| 2008 | £549,055 | -2% |
81 Properties |
| 2007 | £560,912 | 16% |
154 Properties |
| 2006 | £469,469 | -11% |
196 Properties |
| 2005 | £522,577 | 19% |
133 Properties |
| 2004 | £421,360 | 5% |
153 Properties |
| 2003 | £400,024 | 3% |
101 Properties |
| 2002 | £386,314 | 10% |
144 Properties |
| 2001 | £347,868 | 10% |
151 Properties |
| 2000 | £312,936 | 12% |
137 Properties |
| 1999 | £275,503 | 17% |
150 Properties |
| 1998 | £229,742 | 12% |
123 Properties |
| 1997 | £202,863 | 18% |
152 Properties |
| 1996 | £166,480 | -3% |
135 Properties |
| 1995 | £171,277 | - |
117 Properties |
Property Price per Property Type in Claygate
Here you can find historic sold price data in order to help with your property search.
The average Property Paid Price for specific property types in the last three years are:
| Property Type | Average Sold Price | Sold Properties |
|---|---|---|
| Flat | £485,227.00 | 31 Flats |
| Semi Detached House | £834,436.00 | 83 Semi Detached Houses |
| Detached House | £1,228,802.00 | 109 Detached Houses |
| Terraced House | £635,493.00 | 32 Terraced Houses |

