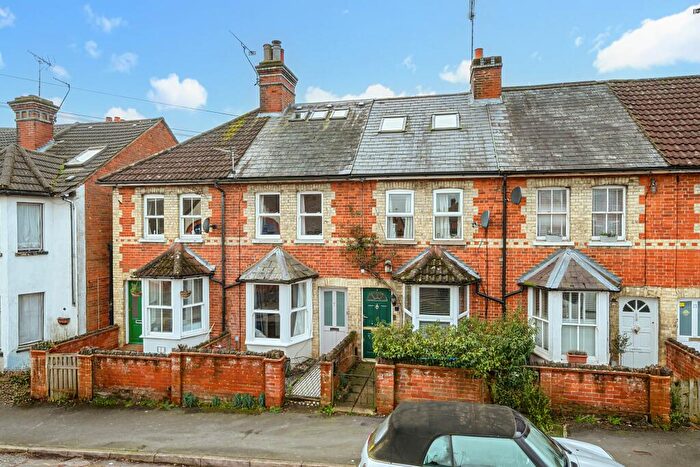
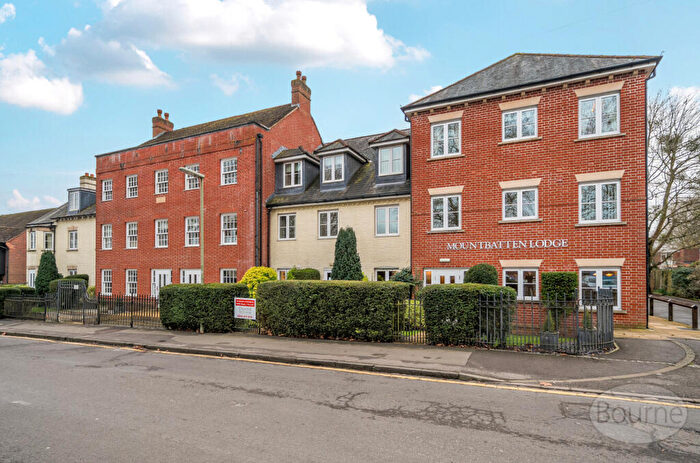
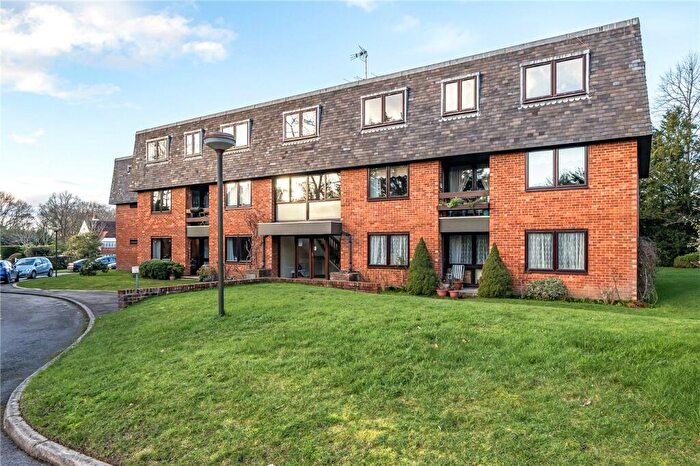
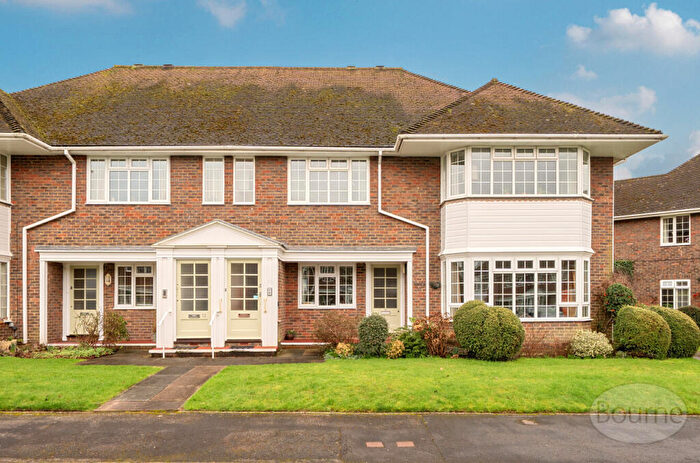
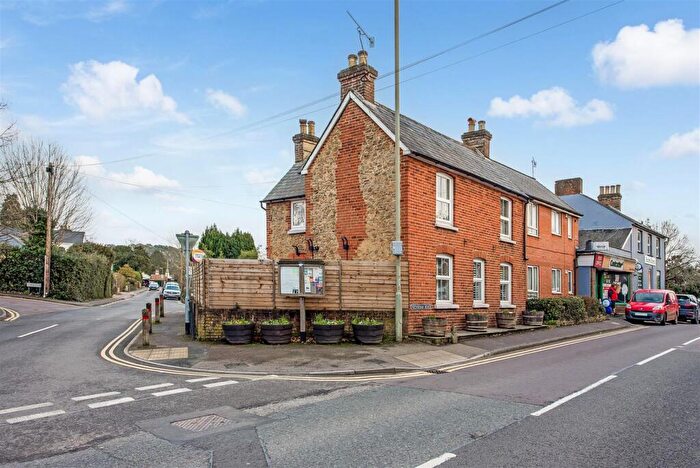
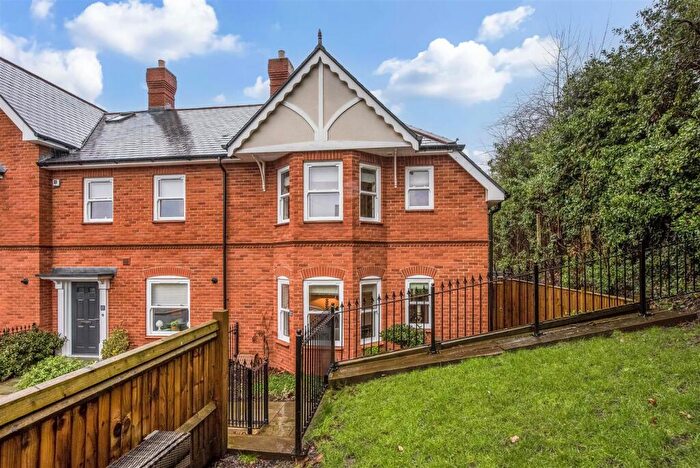
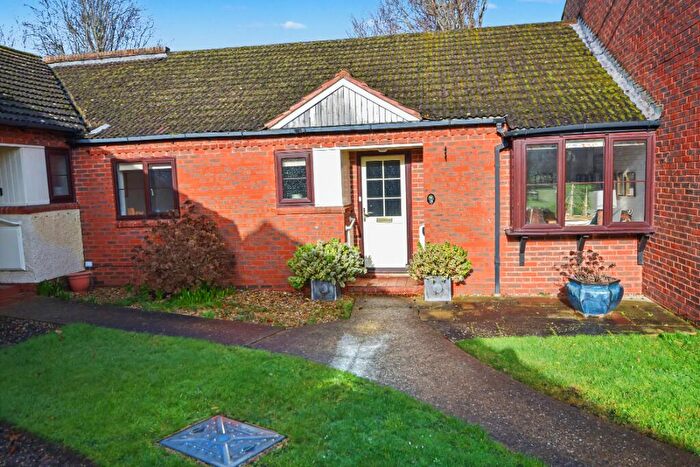
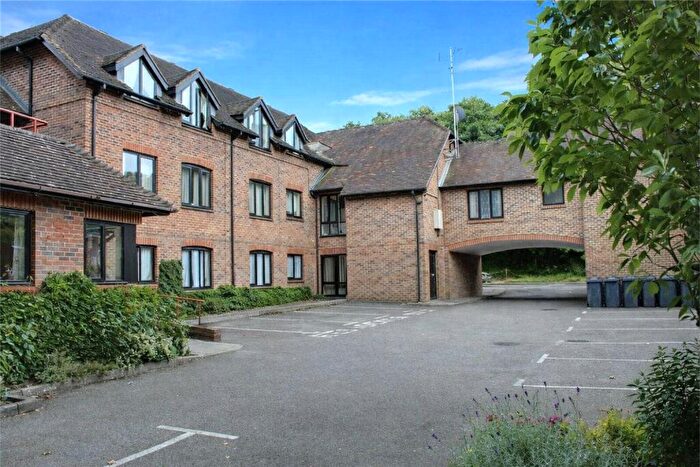
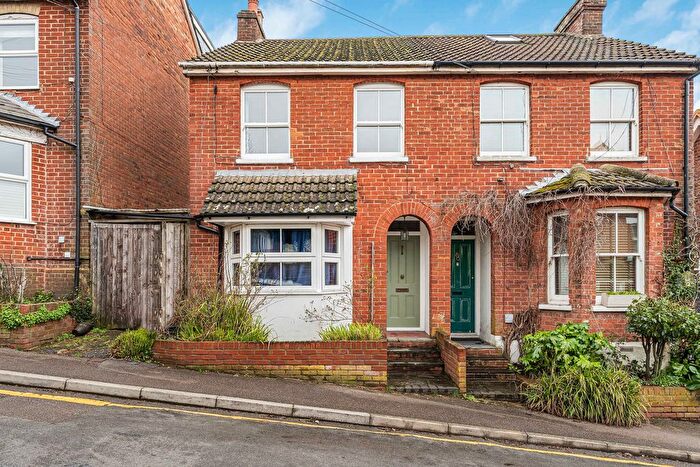
Houses for sale & to rent in Farnham Firgrove, Farnham
House Prices in Farnham Firgrove
Properties in Farnham Firgrove have an average house price of £679,698.00 and had 153 Property Transactions within the last 3 years¹.
Farnham Firgrove is an area in Farnham, Surrey with 1,767 households², where the most expensive property was sold for £1,950,000.00.
Properties for sale in Farnham Firgrove
Roads and Postcodes in Farnham Firgrove
Navigate through our locations to find the location of your next house in Farnham Firgrove, Farnham for sale or to rent.
| Streets | Postcodes |
|---|---|
| Alfred Road | GU9 8ND GU9 8NE GU9 8NF |
| Arthur Close | GU9 8PE |
| Arthur Road | GU9 8PB GU9 8PD GU9 8ST |
| Ashley Mews | GU9 8AX |
| Avon Road | GU9 8PF GU9 8PG GU9 8PH |
| Barncroft | GU9 8RU |
| Brambleton Avenue | GU9 8QU GU9 8RA |
| Bridgefield | GU9 8AN GU9 8AW |
| Broomleaf Corner | GU9 8BG |
| College Place | GU9 8JE |
| Darvill Heights | GU9 8AL |
| Edward Road | GU9 8NP |
| Eleanor Place | GU9 8FR |
| Fairholme Gardens | GU9 8JB |
| Farnham Business Park | GU9 8QL GU9 8QT |
| Firgrove Hill | GU9 8LH GU9 8LL GU9 8LN GU9 8LP GU9 8LQ GU9 8LW |
| Grove End Road | GU9 8RB GU9 8RD GU9 8RE |
| Hillary Close | GU9 8QZ |
| Hillary Road | GU9 8QX GU9 8QY |
| Hookstile Lane | GU9 8LG |
| Hopfields Close | GU9 8EE |
| Lacey Mews | GU9 8AY |
| Lancaster Avenue | GU9 8JY |
| Langham Court | GU9 8FL |
| Longley Road | GU9 8LZ |
| Merlins Close | GU9 8PJ |
| Morley Road | GU9 8LX GU9 8NJ GU9 8LT GU9 8LU GU9 8LY |
| Old Farnham Lane | GU9 8JU |
| Ridgway Hill Road | GU9 8LS |
| Ridgway Parade | GU9 8UZ |
| Ridgway Road | GU9 8NN GU9 8NR GU9 8NS GU9 8NW |
| Ryle Road | GU9 8RN GU9 8RW |
| Searle Road | GU9 8LJ |
| Sheephouse | GU9 8LR |
| Shortheath Road | GU9 8SR |
| Southern Way | GU9 8DF |
| St Georges Road | GU9 8NA GU9 8NB GU9 8NH |
| St Johns Road | GU9 8NT GU9 8NU |
| Station Hill | GU9 8AA GU9 8AD |
| Talbot Road | GU9 8RP GU9 8RR |
| Templar Avenue | GU9 8LE |
| The Drive | GU9 8FS |
| The Fairfield | GU9 8AB GU9 8AG GU9 8AH GU9 8AJ |
| The Woodbarn | GU9 8NQ |
| Tilford Road | GU9 8DJ GU9 8DL GU9 8DN GU9 8DW |
| Trebor Avenue | GU9 8JH |
| Upper Way | GU9 8RF GU9 8RG GU9 8RL GU9 8RQ |
| Waverley Close | GU9 8BE |
| Waverley Lane | GU9 8BB GU9 8BD GU9 8BJ GU9 8BQ |
| Wessex Place | GU9 8NG |
| Westbourne Place | GU9 8EF |
| Weydon Farm Lane | GU9 8QJ |
| Weydon Hill Close | GU9 8PA |
| Weydon Hill Road | GU9 8DB GU9 8NX GU9 8NY GU9 8NZ |
| Weydon Lane | GU9 8QF GU9 8QG GU9 8QH GU9 8QQ GU9 8QR GU9 8UY GU9 8QW |
| York Road | GU9 8JX GU9 8JZ |
| GU9 8LF GU9 8SS |
Transport near Farnham Firgrove
- FAQ
- Price Paid By Year
- Property Type Price
Frequently asked questions about Farnham Firgrove
What is the average price for a property for sale in Farnham Firgrove?
The average price for a property for sale in Farnham Firgrove is £679,698. This amount is 4% higher than the average price in Farnham. There are 1,502 property listings for sale in Farnham Firgrove.
What streets have the most expensive properties for sale in Farnham Firgrove?
The streets with the most expensive properties for sale in Farnham Firgrove are Searle Road at an average of £1,732,500, Shortheath Road at an average of £1,550,000 and Broomleaf Corner at an average of £1,500,000.
What streets have the most affordable properties for sale in Farnham Firgrove?
The streets with the most affordable properties for sale in Farnham Firgrove are Alfred Road at an average of £185,000, Weydon Lane at an average of £218,492 and Avon Road at an average of £289,300.
Which train stations are available in or near Farnham Firgrove?
Some of the train stations available in or near Farnham Firgrove are Farnham, Aldershot and Bentley.
Property Price Paid in Farnham Firgrove by Year
The average sold property price by year was:
| Year | Average Sold Price | Price Change |
Sold Properties
|
|---|---|---|---|
| 2025 | £722,990 | 11% |
50 Properties |
| 2024 | £644,332 | -5% |
57 Properties |
| 2023 | £676,466 | 3% |
46 Properties |
| 2022 | £656,141 | 3% |
67 Properties |
| 2021 | £633,522 | 2% |
88 Properties |
| 2020 | £618,574 | 7% |
58 Properties |
| 2019 | £577,714 | -1% |
76 Properties |
| 2018 | £585,865 | -6% |
79 Properties |
| 2017 | £620,389 | 13% |
68 Properties |
| 2016 | £541,888 | 9% |
82 Properties |
| 2015 | £492,218 | 10% |
85 Properties |
| 2014 | £443,899 | 10% |
79 Properties |
| 2013 | £401,562 | 13% |
86 Properties |
| 2012 | £349,906 | -17% |
98 Properties |
| 2011 | £409,627 | 8% |
64 Properties |
| 2010 | £376,968 | 7% |
64 Properties |
| 2009 | £348,984 | -13% |
65 Properties |
| 2008 | £393,883 | 2% |
52 Properties |
| 2007 | £387,625 | 15% |
110 Properties |
| 2006 | £330,733 | 1% |
118 Properties |
| 2005 | £326,170 | 12% |
96 Properties |
| 2004 | £285,967 | 8% |
93 Properties |
| 2003 | £263,307 | 9% |
105 Properties |
| 2002 | £240,112 | 9% |
107 Properties |
| 2001 | £218,844 | 7% |
109 Properties |
| 2000 | £203,583 | 14% |
91 Properties |
| 1999 | £175,634 | 14% |
89 Properties |
| 1998 | £150,259 | 19% |
99 Properties |
| 1997 | £120,983 | 4% |
142 Properties |
| 1996 | £116,179 | 24% |
99 Properties |
| 1995 | £88,437 | - |
78 Properties |
Property Price per Property Type in Farnham Firgrove
Here you can find historic sold price data in order to help with your property search.
The average Property Paid Price for specific property types in the last three years are:
| Property Type | Average Sold Price | Sold Properties |
|---|---|---|
| Semi Detached House | £634,593.00 | 53 Semi Detached Houses |
| Detached House | £1,045,528.00 | 53 Detached Houses |
| Terraced House | £407,031.00 | 16 Terraced Houses |
| Flat | £272,095.00 | 31 Flats |

