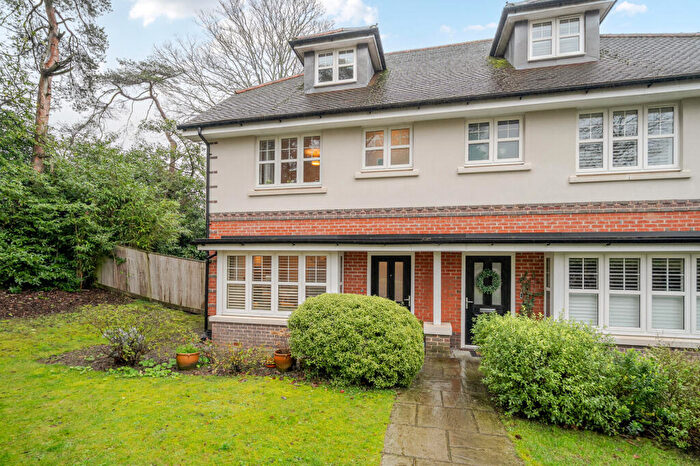
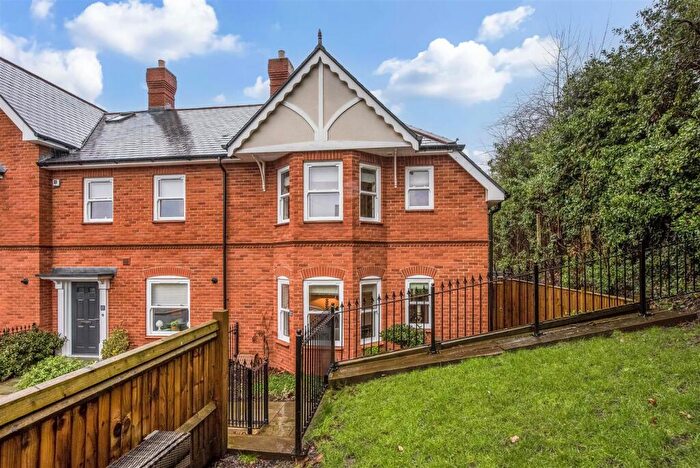
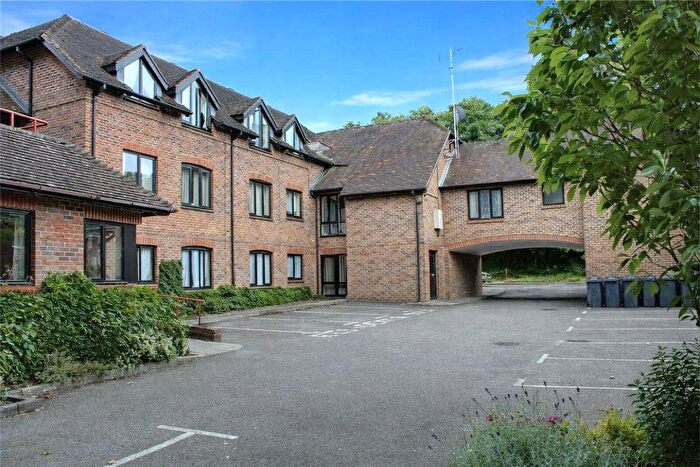
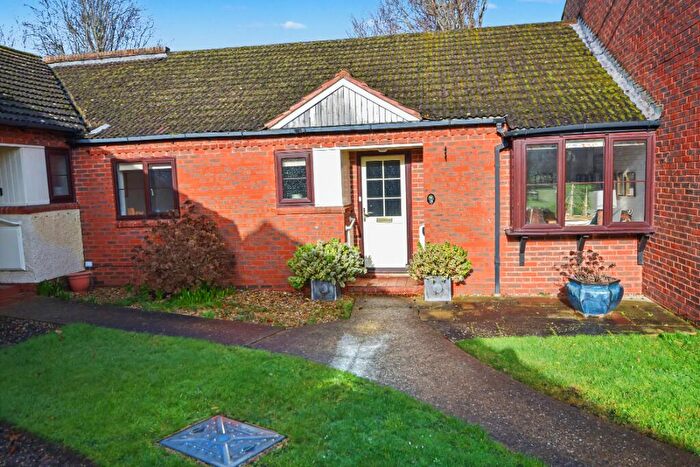
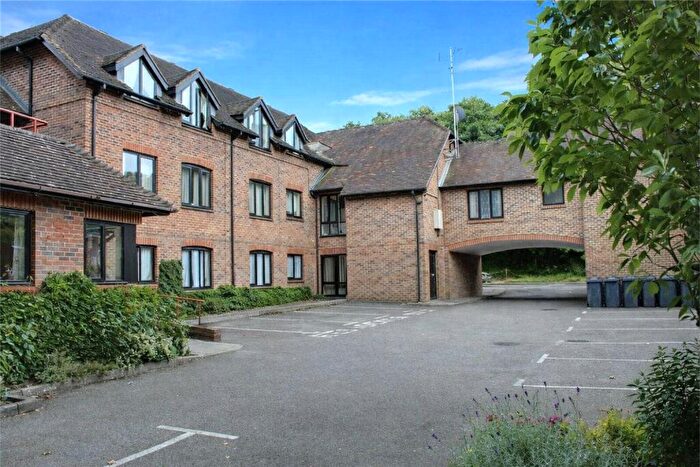
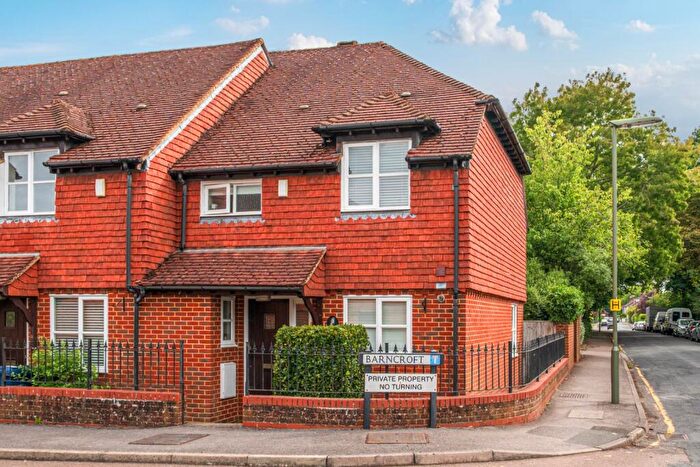
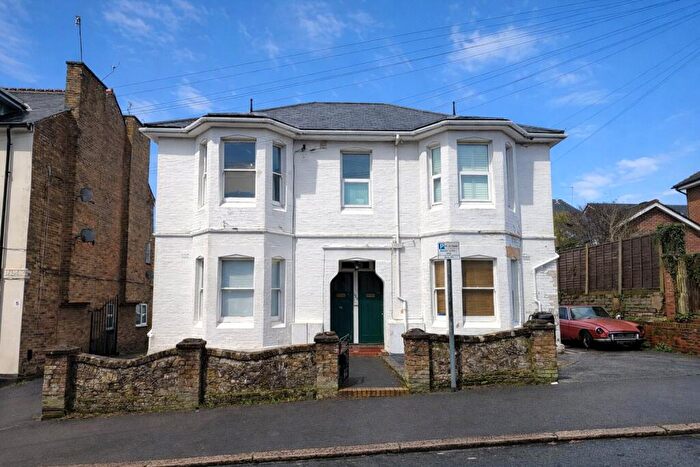
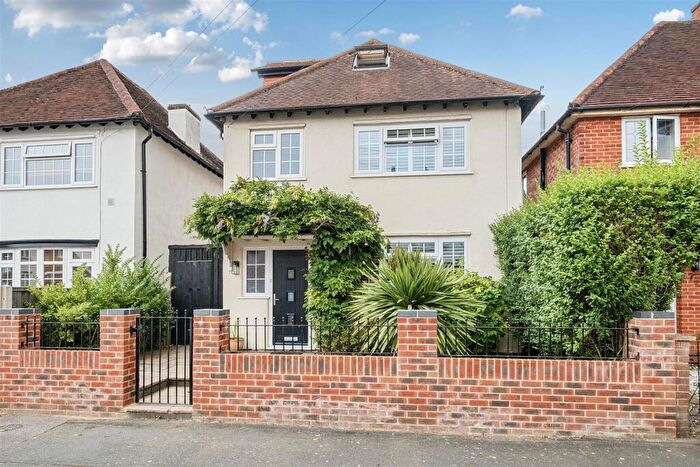
Houses for sale & to rent in Farnham, Surrey
House Prices in Farnham
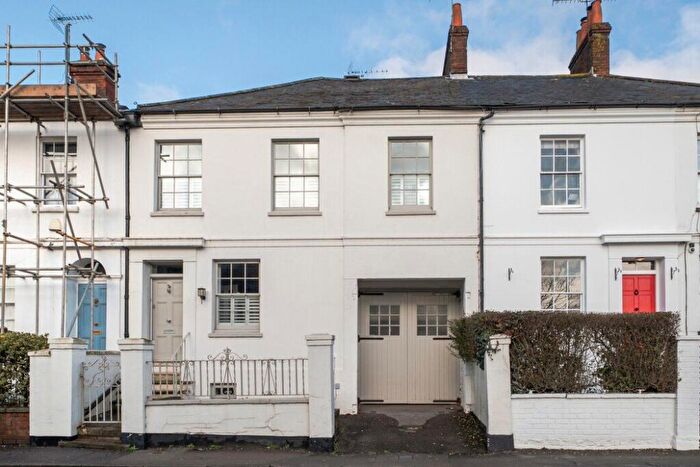
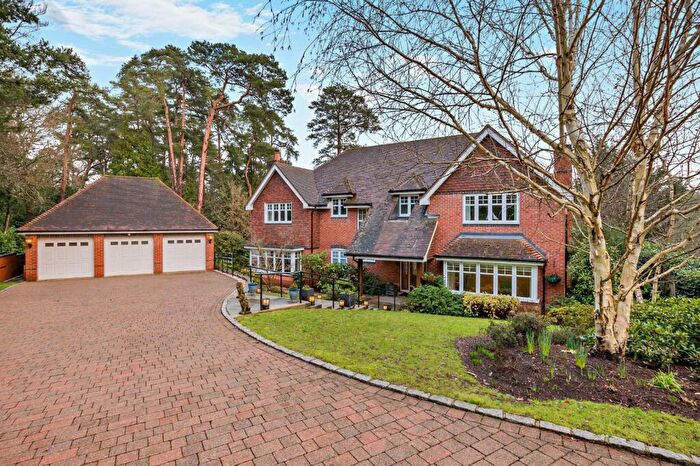
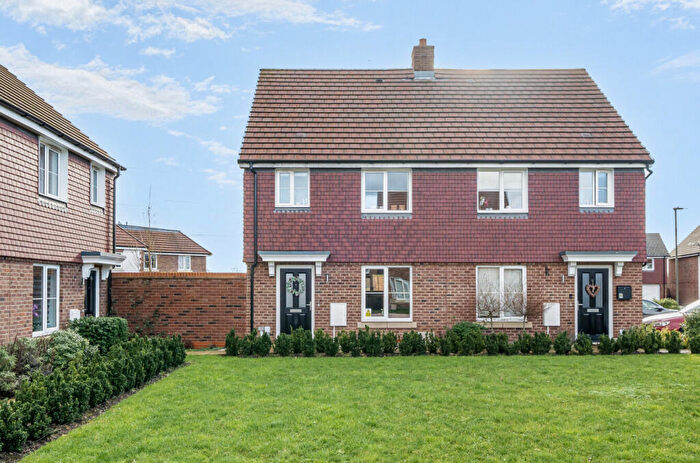
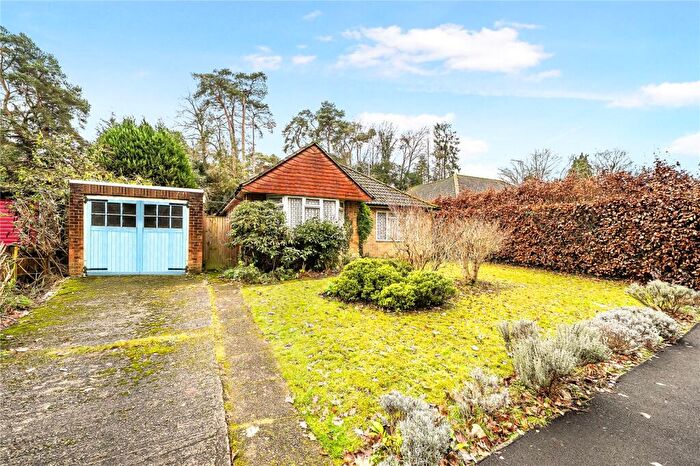
Properties in Farnham have an average house price of £651,462.00 and had 1,983 Property Transactions within the last 3 years.¹
Farnham is an area in Surrey with 19,391 households², where the most expensive property was sold for £6,000,000.00.
Properties for sale in Farnham
Neighbourhoods in Farnham
Navigate through our locations to find the location of your next house in Farnham, Surrey for sale or to rent.
- Ash South And Tongham
- Elstead And Thursley
- Farnham Bourne
- Farnham Castle
- Farnham Firgrove
- Farnham Hale And Heath End
- Farnham Moor Park
- Farnham Shortheath And Boundstone
- Farnham Upper Hale
- Farnham Weybourne And Badshot Lea
- Farnham Wrecclesham And Rowledge
- Frensham, Dockenfield And Tilford
- Hindhead
- Pilgrims
- Ash South
- Western Commons
- Farnham Rowledge
- Farnham North West
- Farnham Weybourne
Transport in Farnham
Please see below transportation links in this area:
- FAQ
- Price Paid By Year
- Property Type Price
Frequently asked questions about Farnham
What is the average price for a property for sale in Farnham?
The average price for a property for sale in Farnham is £651,462. This amount is 7% higher than the average price in Surrey. There are more than 10,000 property listings for sale in Farnham.
What locations have the most expensive properties for sale in Farnham?
The locations with the most expensive properties for sale in Farnham are Elstead And Thursley at an average of £1,375,000, Pilgrims at an average of £1,287,673 and Frensham, Dockenfield And Tilford at an average of £1,196,564.
What locations have the most affordable properties for sale in Farnham?
The locations with the most affordable properties for sale in Farnham are Ash South And Tongham at an average of £438,306, Hindhead at an average of £440,000 and Farnham Weybourne And Badshot Lea at an average of £456,194.
Which train stations are available in or near Farnham?
Some of the train stations available in or near Farnham are Farnham, Aldershot and Bentley.
Property Price Paid in Farnham by Year
The average sold property price by year was:
| Year | Average Sold Price | Price Change |
Sold Properties
|
|---|---|---|---|
| 2025 | £638,739 | -2% |
591 Properties |
| 2024 | £649,794 | -2% |
708 Properties |
| 2023 | £664,183 | -5% |
684 Properties |
| 2022 | £696,923 | 11% |
779 Properties |
| 2021 | £621,914 | 0,5% |
1,113 Properties |
| 2020 | £619,098 | 13% |
834 Properties |
| 2019 | £537,323 | -5% |
827 Properties |
| 2018 | £565,448 | 4% |
781 Properties |
| 2017 | £542,549 | 4% |
805 Properties |
| 2016 | £518,880 | 7% |
873 Properties |
| 2015 | £483,424 | 7% |
1,016 Properties |
| 2014 | £449,891 | 7% |
940 Properties |
| 2013 | £417,724 | -0,1% |
886 Properties |
| 2012 | £418,278 | 2% |
739 Properties |
| 2011 | £408,069 | 2% |
689 Properties |
| 2010 | £400,688 | 13% |
826 Properties |
| 2009 | £348,495 | -12% |
787 Properties |
| 2008 | £389,869 | 3% |
588 Properties |
| 2007 | £379,554 | 9% |
1,202 Properties |
| 2006 | £344,648 | 7% |
1,267 Properties |
| 2005 | £320,520 | 5% |
987 Properties |
| 2004 | £304,294 | 9% |
1,025 Properties |
| 2003 | £276,629 | 11% |
969 Properties |
| 2002 | £247,287 | 9% |
1,151 Properties |
| 2001 | £224,120 | 8% |
1,129 Properties |
| 2000 | £205,509 | 18% |
1,022 Properties |
| 1999 | £168,781 | 9% |
1,207 Properties |
| 1998 | £153,117 | 15% |
1,112 Properties |
| 1997 | £130,193 | 14% |
1,189 Properties |
| 1996 | £112,095 | 5% |
1,098 Properties |
| 1995 | £106,610 | - |
857 Properties |
Property Price per Property Type in Farnham
Here you can find historic sold price data in order to help with your property search.
The average Property Paid Price for specific property types in the last three years are:
| Property Type | Average Sold Price | Sold Properties |
|---|---|---|
| Semi Detached House | £553,967.00 | 519 Semi Detached Houses |
| Terraced House | £403,849.00 | 408 Terraced Houses |
| Detached House | £991,522.00 | 749 Detached Houses |
| Flat | £315,701.00 | 307 Flats |

