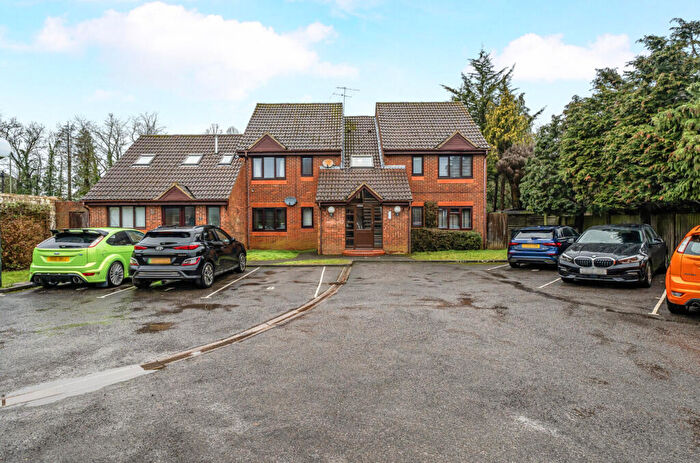
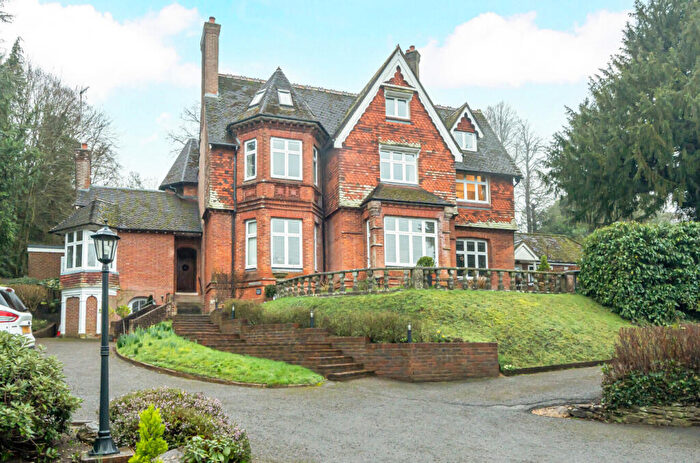
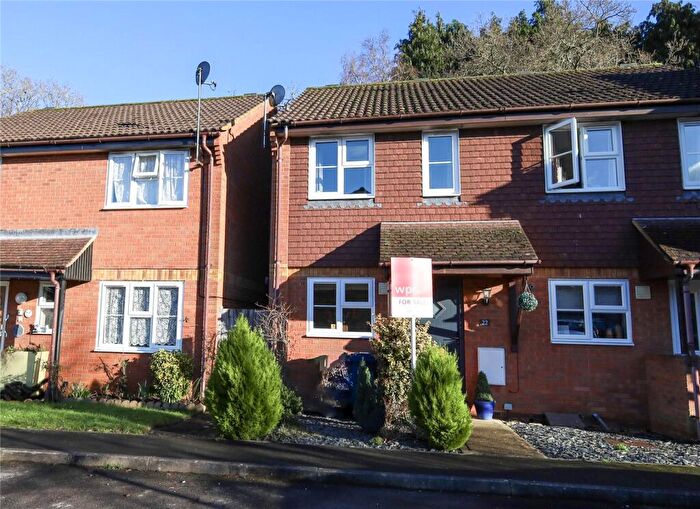
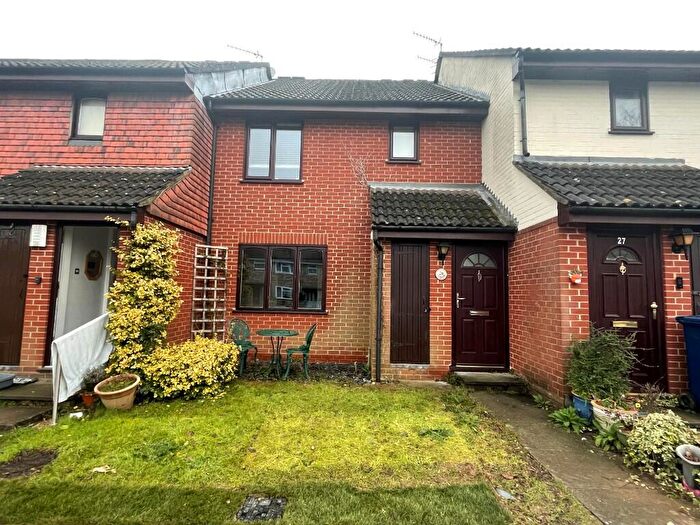
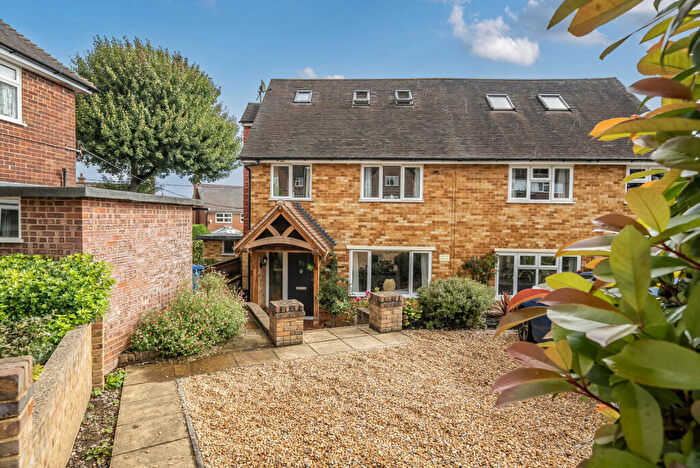
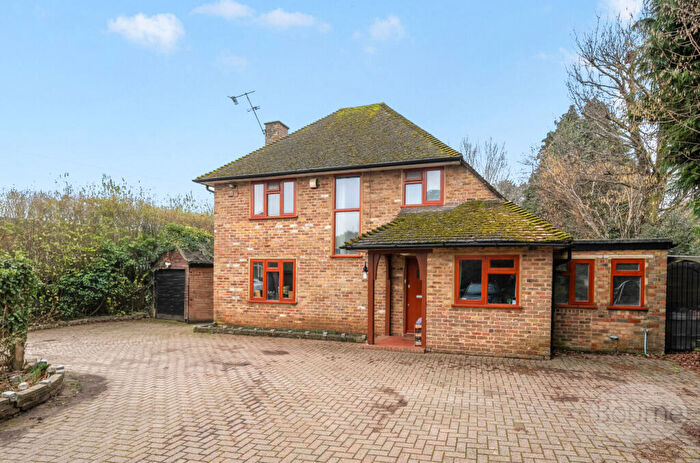
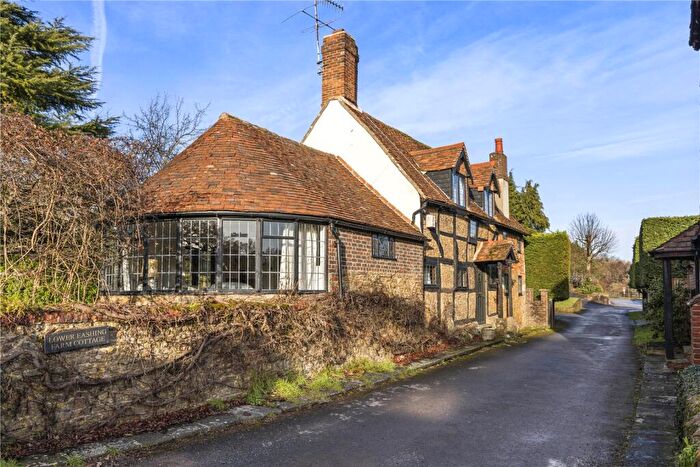
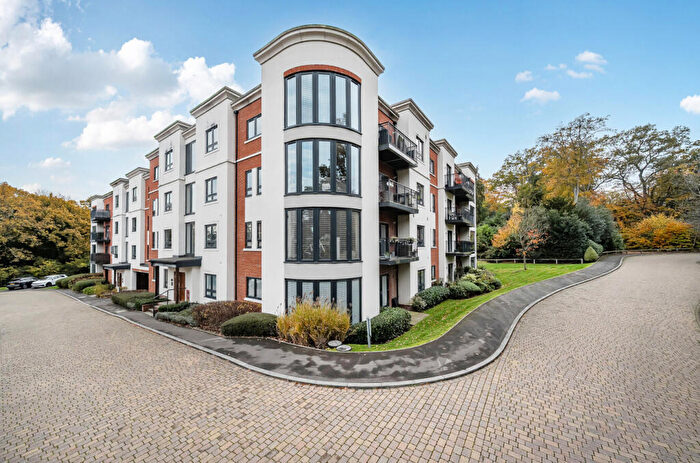
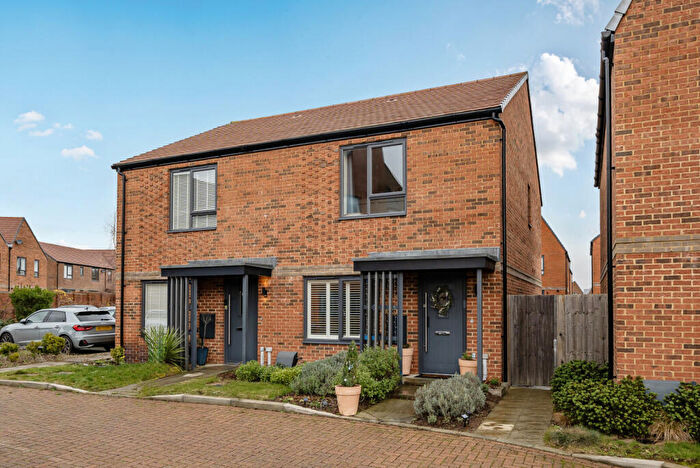
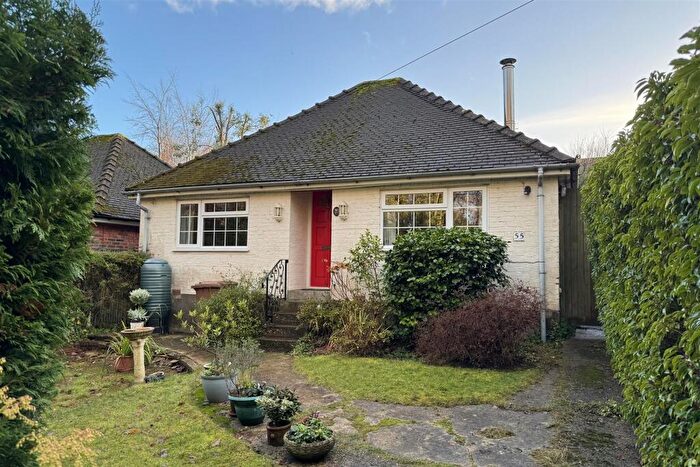
Houses for sale & to rent in Milford, Godalming
House Prices in Milford
Properties in Milford have an average house price of £551,042.00 and had 176 Property Transactions within the last 3 years¹.
Milford is an area in Godalming, Surrey with 1,743 households², where the most expensive property was sold for £2,500,000.00.
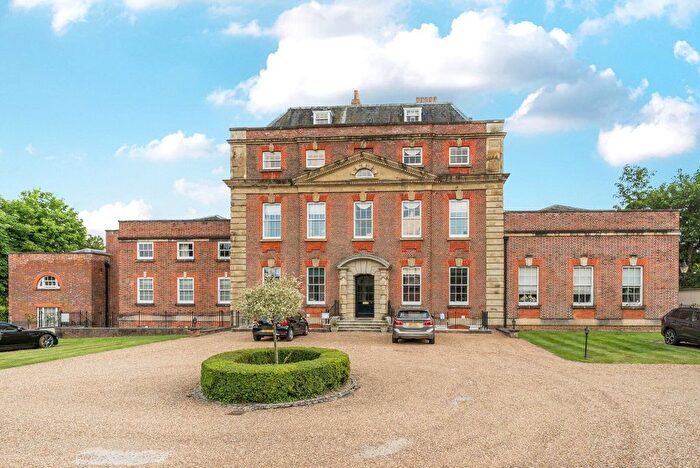
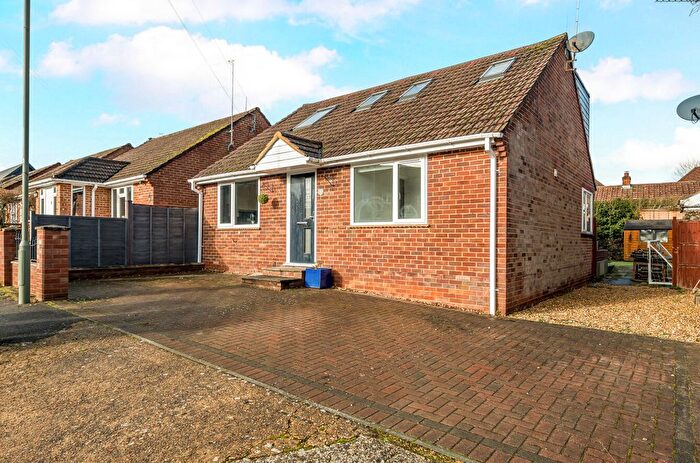
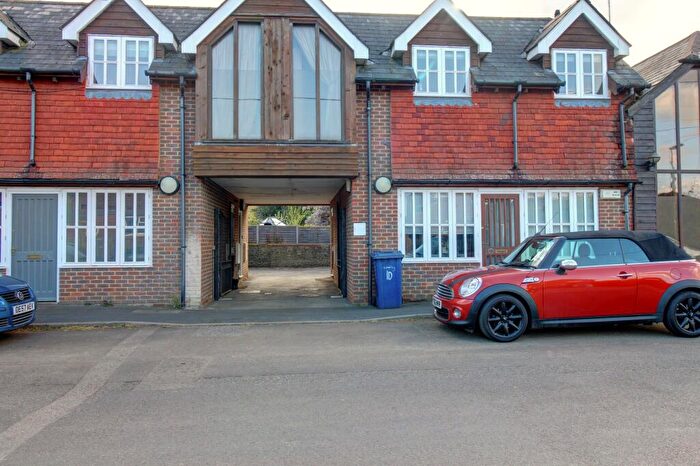
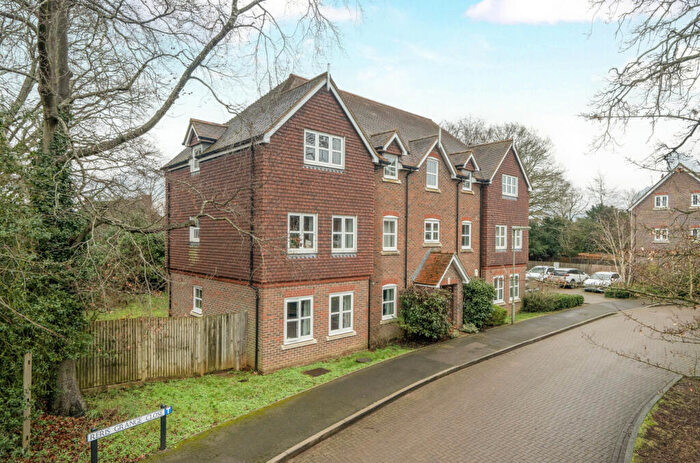
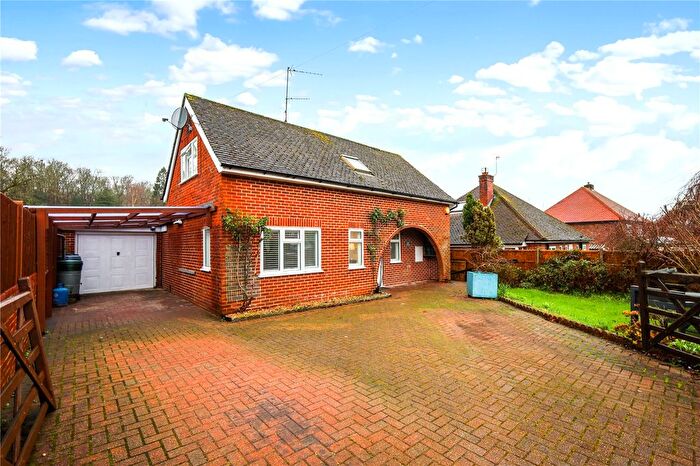
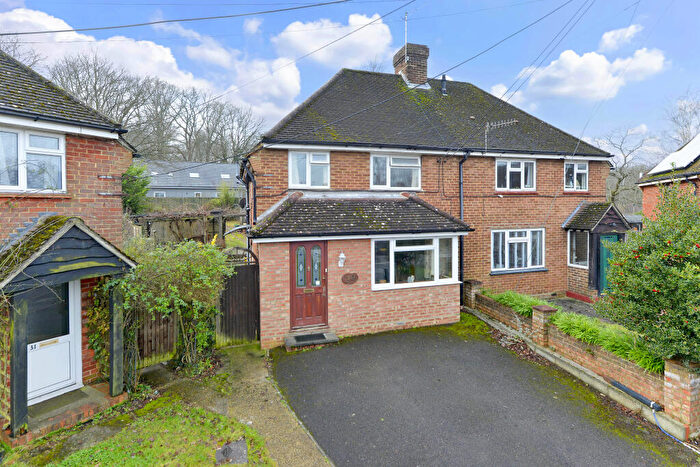
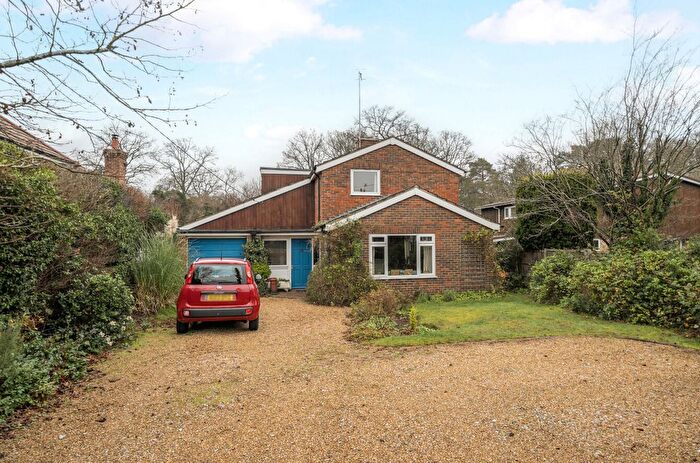
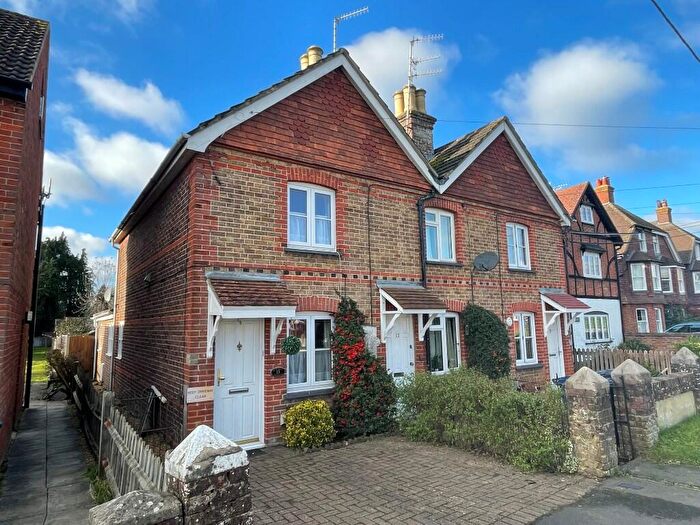
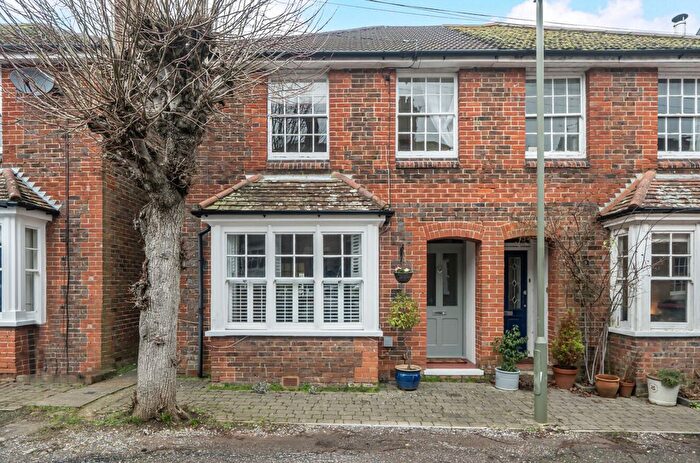
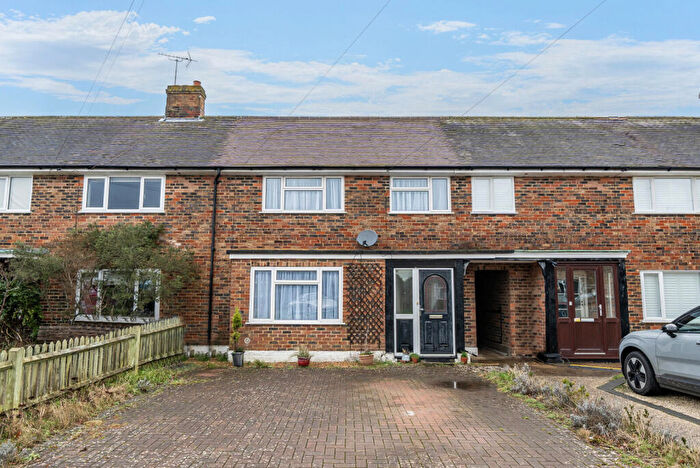
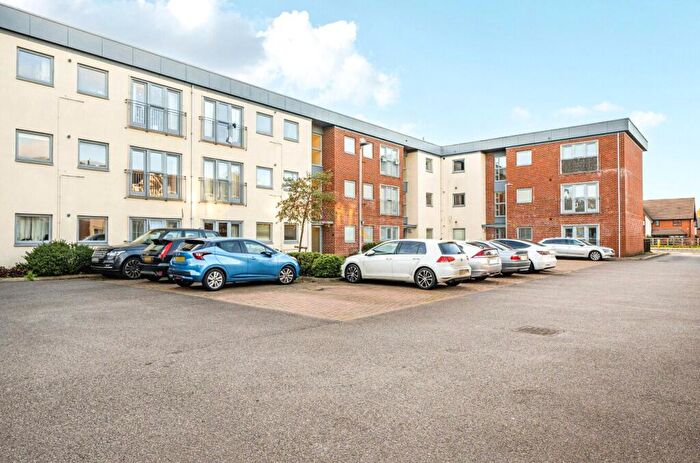
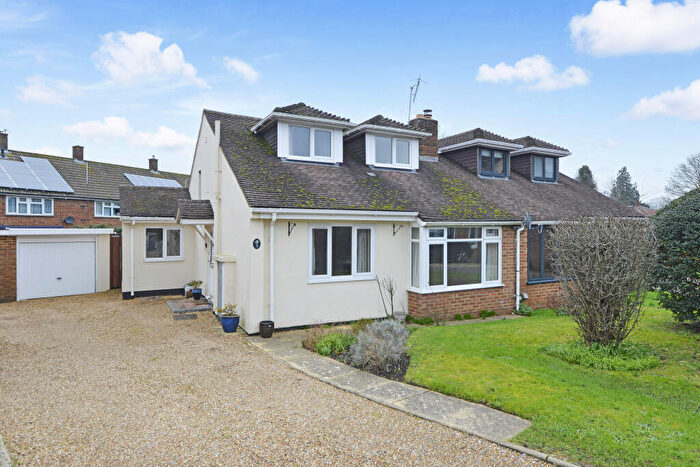
Properties for sale in Milford
Roads and Postcodes in Milford
Navigate through our locations to find the location of your next house in Milford, Godalming for sale or to rent.
| Streets | Postcodes |
|---|---|
| Amberley Lane | GU8 5EB |
| Amberley Road | GU8 5ED |
| Badgers Cross | GU8 5DW |
| Beech Walk | GU8 5FF |
| Borough Farm Road | GU8 5JZ |
| Brook Mead | GU8 5HD |
| Busdens Close | GU8 5JS |
| Busdens Lane | GU8 5JR |
| Busdens Way | GU8 5JP |
| By-pass Road | GU8 5EL |
| Canada Copse | GU8 5AL |
| Chapel Close | GU8 5EW |
| Chapel Lane | GU8 5ES GU8 5EU GU8 5HB GU8 5HG GU8 5HU GU8 5EZ GU8 5HE |
| Cherry Tree Road | GU8 5AX |
| Church Close | GU8 5HQ |
| Church Road | GU8 5JA GU8 5JB |
| Coombes Cottages | GU8 5BU |
| Cramhurst Lane | GU8 5QZ GU8 5RA GU8 5RD GU8 5RE |
| Elmside | GU8 5EG |
| Elstead Road | GU8 5EE |
| Flitwick Grange | GU8 5DN |
| George Road | GU8 5HA |
| Green Lane | GU8 5BG |
| Guildford Road | GU8 5FP |
| Haslemere Road | GU8 5BN GU8 5BP GU8 5BW |
| Heathview Road | GU8 5DF |
| Highcroft | GU8 5AZ |
| Hurst Farm Close | GU8 5ER |
| Khartoum Road | GU8 5RB |
| Kynance Close | GU8 5FL |
| Ladycross | GU8 5DQ |
| Leehurst | GU8 5BF |
| Lower Manor Road | GU8 5JH |
| Lower Moushill Lane | GU8 5EA GU8 5JX |
| Manor Fields | GU8 5EQ |
| Manor Green | GU8 5JQ |
| Manor Lea Close | GU8 5EH |
| Manor Lea Road | GU8 5EF |
| Martins Wood | GU8 5DB |
| Meadow Close | GU8 5HN |
| Merryacres | GU8 5RG |
| Midleton Close | GU8 5ET |
| Milford Heath | GU8 5BT GU8 5BX |
| Milford Lodge | GU8 5JF GU8 5JG GU8 5JE GU8 5LJ |
| Moushill Lane | GU8 5BH GU8 5BQ |
| Myrtle Cottages | GU8 5DX |
| New Road | GU8 5BE |
| Oak Tree Road | GU8 5JJ GU8 5JN |
| Ockfields | GU8 5JT |
| Old Elstead Road | GU8 5EJ |
| Oxted Green | GU8 5DA GU8 5DD GU8 5DE GU8 5DG |
| Petworth Road | GU8 5BA GU8 5BS GU8 5BY |
| Pheasant Close | GU8 5FA |
| Pilgrim Court | GU8 5JU |
| Pinks Mews | GU8 5JD |
| Portsmouth Road | GU8 5BB GU8 5BD GU8 5BJ GU8 5DP GU8 5DR GU8 5DS GU8 5DU GU8 5DY GU8 5EX GU8 5HH GU8 5HJ GU8 5HP GU8 5HW GU8 5HX GU8 5HZ GU8 5JY GU8 5AU GU8 5DZ GU8 5HL |
| Potters Close | GU8 5EY |
| Rake Lane | GU8 5BZ |
| Reris Grange Close | GU8 5FD |
| Ridgway Cottages | GU8 5DT |
| Rodborough Hill Park | GU8 5RY |
| Sandy Lane | GU8 5BL |
| Springwood | GU8 5HR |
| Star Cottages | GU8 6LA |
| Station Lane | GU8 5AD GU8 5AE GU8 5HS GU8 5HT GU8 5AA |
| Swallow Close | GU8 5DJ |
| The Cedars | GU8 5DH |
| The Lawns | GU8 5HY |
| The Manor | GU8 5JL |
| Upper Manor Road | GU8 5JW |
| White Lion Gardens | GU8 5FN |
| Woodpeckers | GU8 5DL |
| Yew Tree Road | GU8 5RH GU8 5RQ |
Transport near Milford
- FAQ
- Price Paid By Year
- Property Type Price
Frequently asked questions about Milford
What is the average price for a property for sale in Milford?
The average price for a property for sale in Milford is £551,042. This amount is 14% lower than the average price in Godalming. There are 1,059 property listings for sale in Milford.
What streets have the most expensive properties for sale in Milford?
The streets with the most expensive properties for sale in Milford are Station Lane at an average of £1,950,000, Milford Heath at an average of £1,000,000 and Haslemere Road at an average of £950,000.
What streets have the most affordable properties for sale in Milford?
The streets with the most affordable properties for sale in Milford are Manor Green at an average of £200,000, Ladycross at an average of £203,000 and Badgers Cross at an average of £322,333.
Which train stations are available in or near Milford?
Some of the train stations available in or near Milford are Milford (Surrey), Godalming and Witley.
Property Price Paid in Milford by Year
The average sold property price by year was:
| Year | Average Sold Price | Price Change |
Sold Properties
|
|---|---|---|---|
| 2025 | £563,595 | 4% |
55 Properties |
| 2024 | £542,453 | -1% |
58 Properties |
| 2023 | £547,990 | -11% |
63 Properties |
| 2022 | £605,956 | 15% |
74 Properties |
| 2021 | £515,201 | 9% |
84 Properties |
| 2020 | £466,476 | 1% |
55 Properties |
| 2019 | £461,385 | 2% |
68 Properties |
| 2018 | £450,375 | -5% |
41 Properties |
| 2017 | £471,696 | 6% |
69 Properties |
| 2016 | £444,251 | 13% |
61 Properties |
| 2015 | £384,553 | 5% |
75 Properties |
| 2014 | £365,312 | -4% |
80 Properties |
| 2013 | £380,323 | -11% |
58 Properties |
| 2012 | £421,686 | 28% |
55 Properties |
| 2011 | £303,989 | -29% |
54 Properties |
| 2010 | £392,003 | 15% |
69 Properties |
| 2009 | £332,728 | -14% |
66 Properties |
| 2008 | £380,622 | 16% |
39 Properties |
| 2007 | £320,227 | 9% |
102 Properties |
| 2006 | £290,080 | 10% |
89 Properties |
| 2005 | £261,110 | -4% |
83 Properties |
| 2004 | £271,360 | -6% |
78 Properties |
| 2003 | £287,544 | 25% |
83 Properties |
| 2002 | £216,912 | 10% |
120 Properties |
| 2001 | £195,422 | -3% |
106 Properties |
| 2000 | £201,351 | 22% |
114 Properties |
| 1999 | £156,788 | 11% |
86 Properties |
| 1998 | £138,843 | 15% |
78 Properties |
| 1997 | £117,998 | 8% |
90 Properties |
| 1996 | £109,119 | 12% |
71 Properties |
| 1995 | £96,055 | - |
76 Properties |
Property Price per Property Type in Milford
Here you can find historic sold price data in order to help with your property search.
The average Property Paid Price for specific property types in the last three years are:
| Property Type | Average Sold Price | Sold Properties |
|---|---|---|
| Semi Detached House | £511,287.00 | 62 Semi Detached Houses |
| Detached House | £798,754.00 | 54 Detached Houses |
| Terraced House | £448,511.00 | 36 Terraced Houses |
| Flat | £250,187.00 | 24 Flats |

