
Houses for sale & to rent in Bletchingley And Nutfield, Godstone
House Prices in Bletchingley And Nutfield
Properties in Bletchingley And Nutfield have an average house price of £539k and had 5 Property Transactions within the last 3 years¹.
Bletchingley And Nutfield is an area in Godstone, Surrey with 85 households², where the most expensive property was sold for £850k.
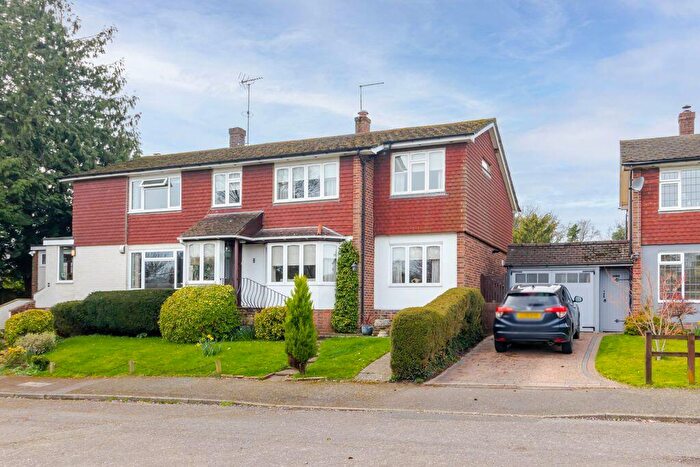
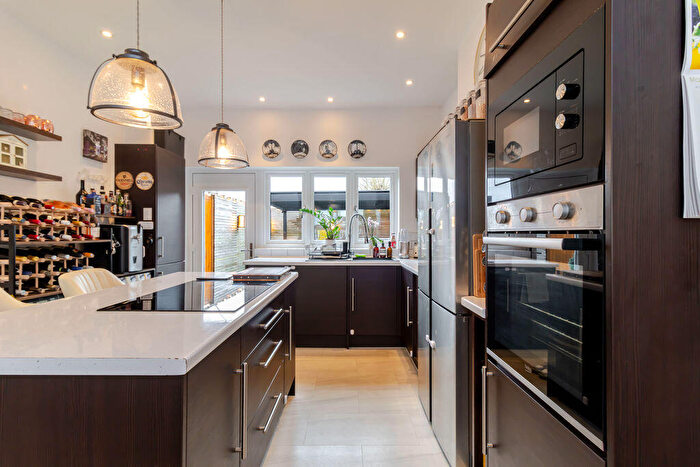
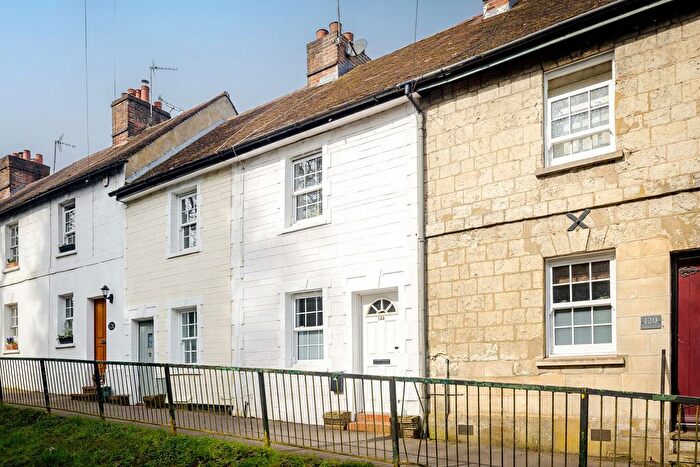
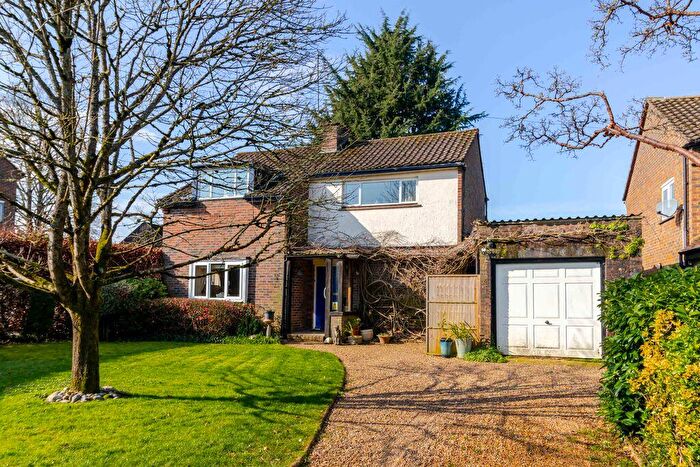
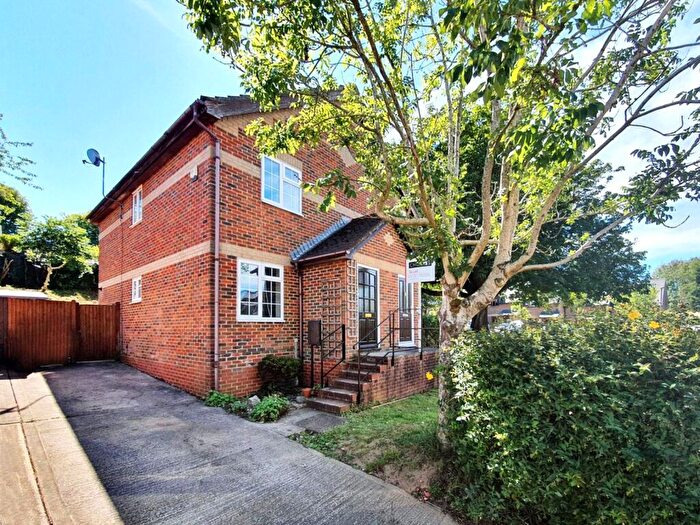
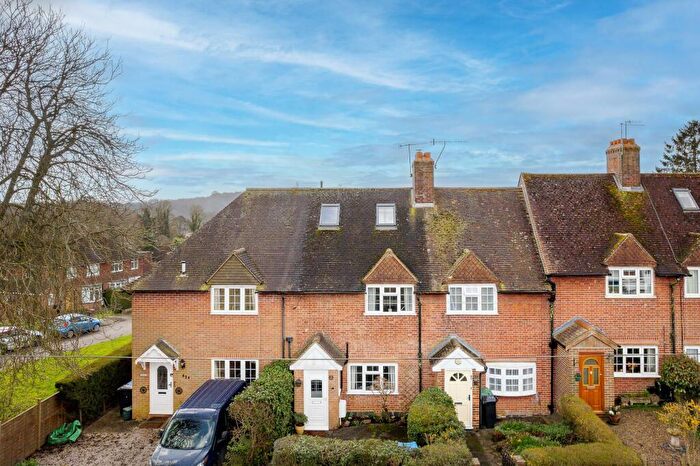
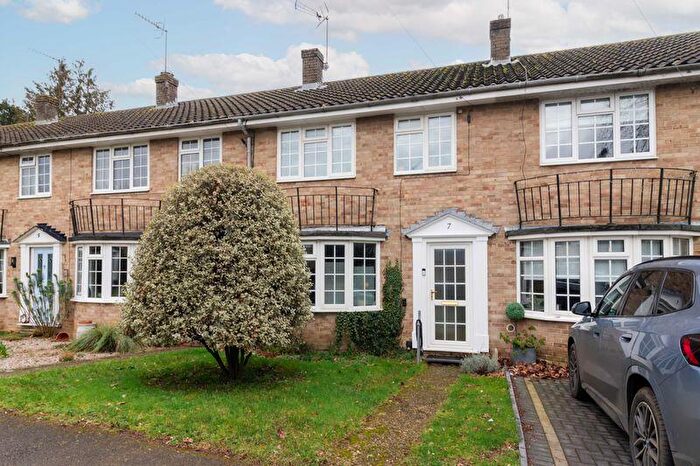
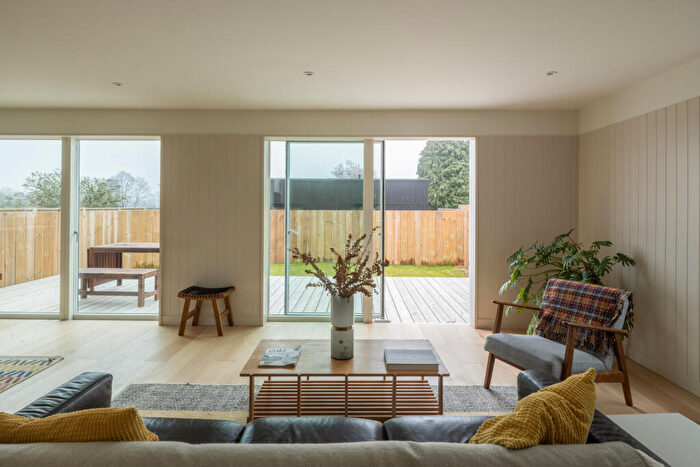
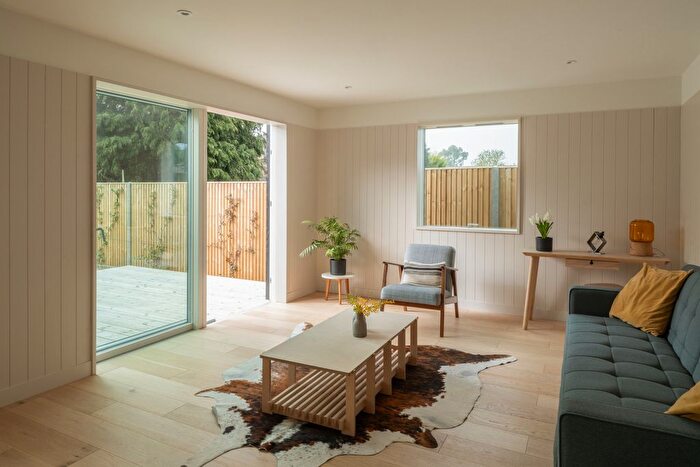
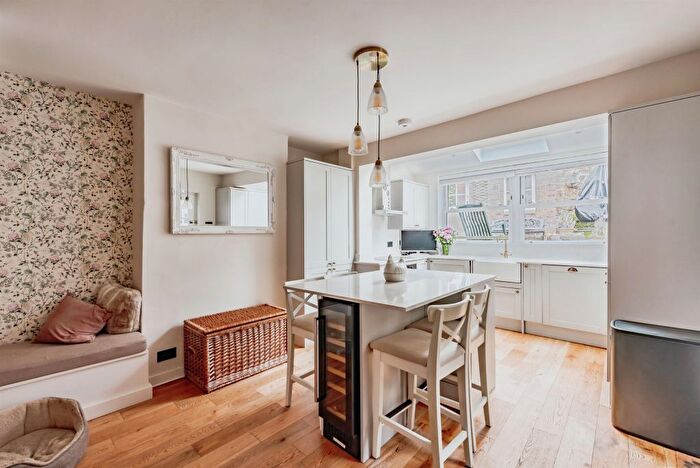
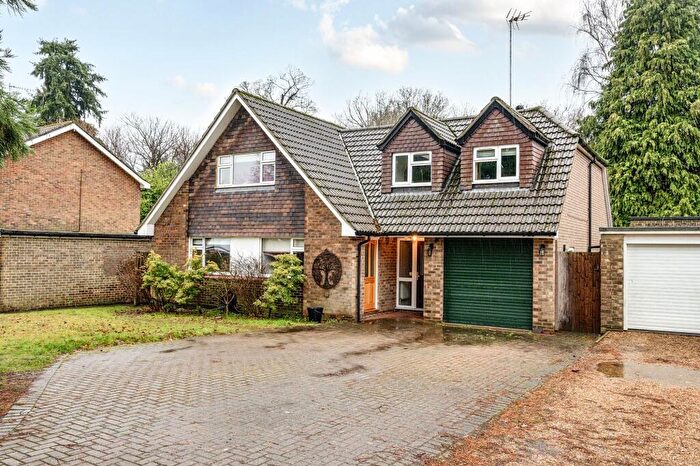
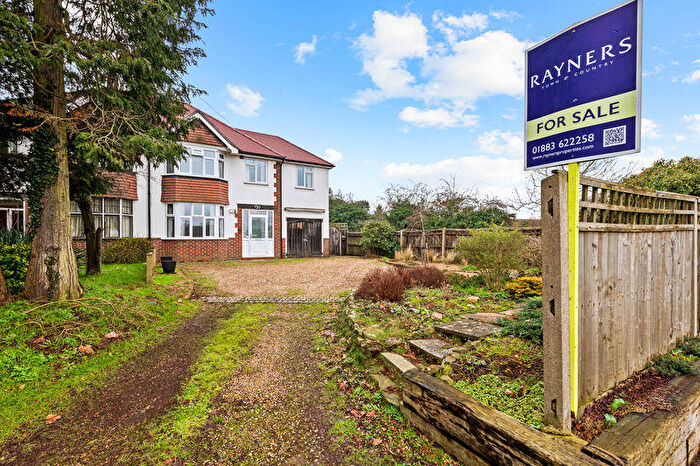
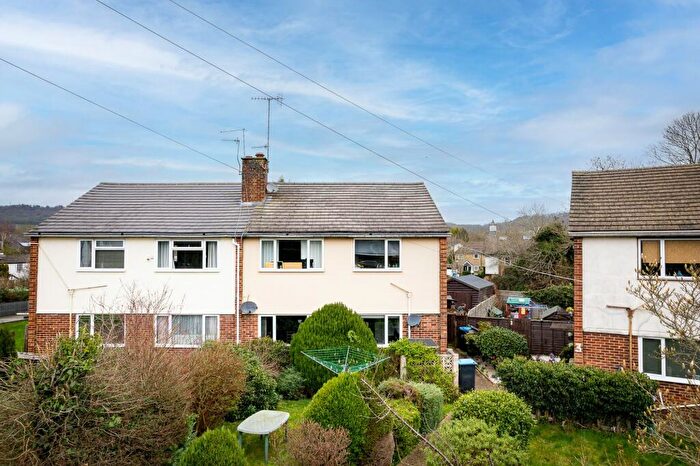
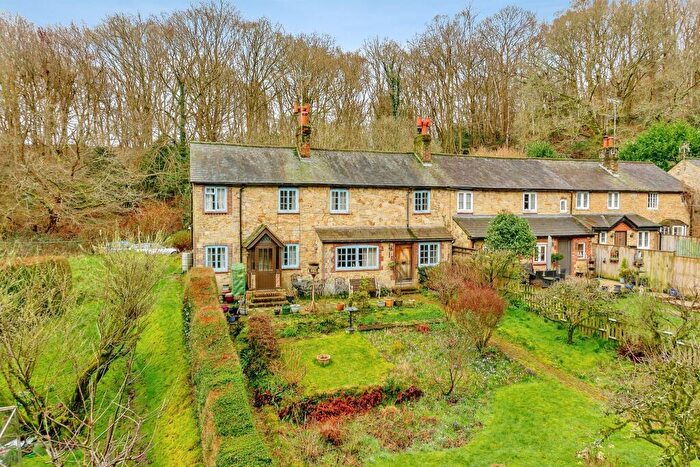
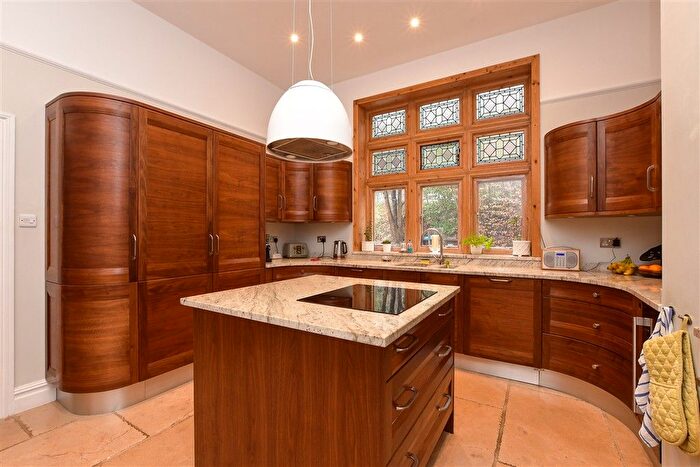
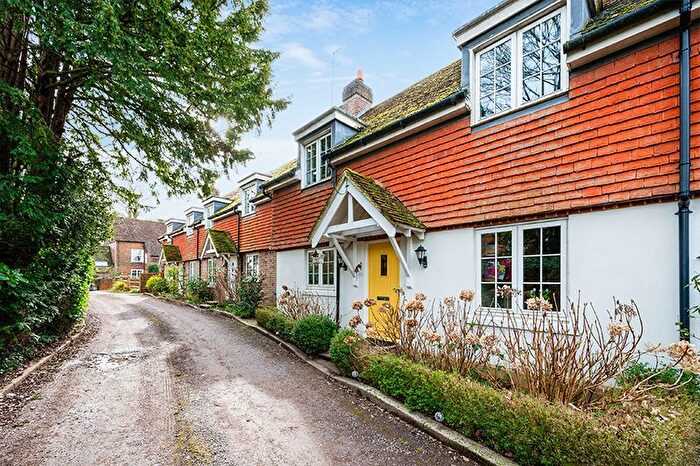
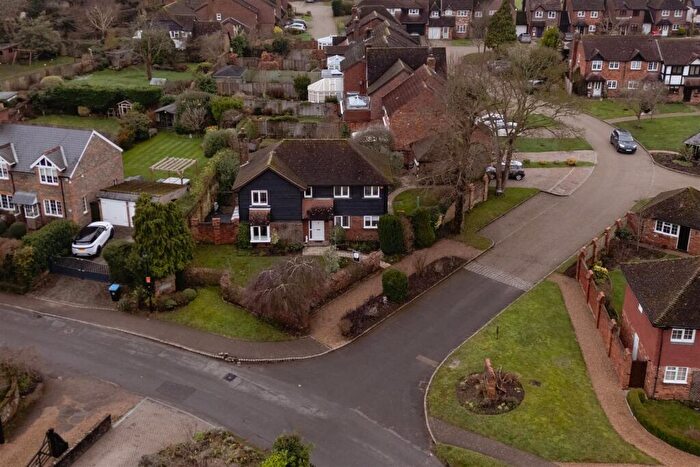
Properties for sale in Bletchingley And Nutfield
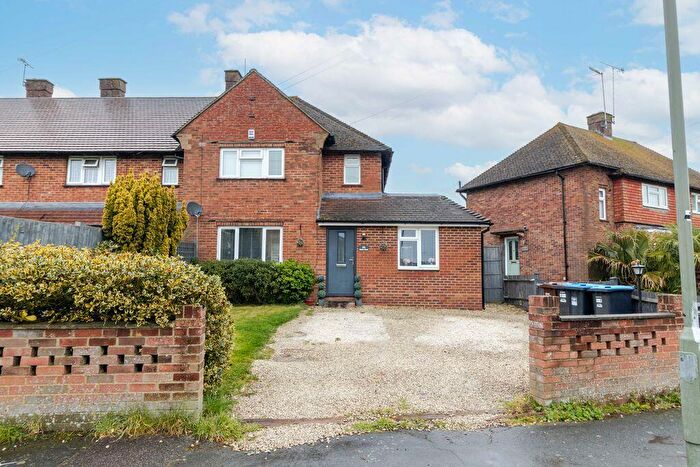
![]()
If you are looking to sell your house, let it out, or receive a property valuation, an expert can help you.
Click the button below to get started.
Roads and Postcodes in Bletchingley And Nutfield
Navigate through our locations to find the location of your next house in Bletchingley And Nutfield, Godstone for sale or to rent.
| Streets | Postcodes |
|---|---|
| Bletchingley Road | RH9 8NB |
| Ivy Mill Lane | RH9 8NE RH9 8NR RH9 8NS |
| Knights Way | RH9 8FD |
| Lower South Park | RH9 8LF |
| North Park Lane | RH9 8ND RH9 8FE |
Transport near Bletchingley And Nutfield

- FAQ
- Price Paid By Year
- Property Type Price
Frequently asked questions about Bletchingley And Nutfield
What is the average price for a property for sale in Bletchingley And Nutfield?
The average price for a property for sale in Bletchingley And Nutfield is £538,900. This amount is 1% higher than the average price in Godstone. There are 401 property listings for sale in Bletchingley And Nutfield.
What streets have the most expensive properties for sale in Bletchingley And Nutfield?
The street with the most expensive properties for sale in Bletchingley And Nutfield is Lower South Park at an average of £700,000.
What streets have the most affordable properties for sale in Bletchingley And Nutfield?
The street with the most affordable properties for sale in Bletchingley And Nutfield is Bletchingley Road at an average of £381,500.
Which train stations are available in or near Bletchingley And Nutfield?
Some of the train stations available in or near Bletchingley And Nutfield are Godstone, Nutfield and Caterham.
Property Price Paid in Bletchingley And Nutfield by Year
The average sold property price by year was:
| Year | Average Sold Price | Price Change |
Sold Properties
|
|---|---|---|---|
| 2025 | £417,000 | -34% |
1 Property |
| 2024 | £557,500 | -4% |
2 Properties |
| 2023 | £581,250 | 20% |
2 Properties |
| 2022 | £462,250 | 15% |
4 Properties |
| 2021 | £391,666 | -1% |
3 Properties |
| 2020 | £395,000 | -35% |
1 Property |
| 2019 | £535,000 | -44% |
1 Property |
| 2018 | £770,785 | 13% |
7 Properties |
| 2017 | £667,466 | 11% |
15 Properties |
| 2016 | £595,000 | -24% |
2 Properties |
| 2015 | £735,000 | 31% |
1 Property |
| 2014 | £508,125 | -20% |
4 Properties |
| 2013 | £608,333 | 28% |
3 Properties |
| 2012 | £437,250 | 52% |
2 Properties |
| 2011 | £209,000 | -97% |
2 Properties |
| 2009 | £412,000 | 6% |
6 Properties |
| 2008 | £388,975 | 7% |
2 Properties |
| 2007 | £362,571 | 7% |
7 Properties |
| 2006 | £335,500 | 15% |
4 Properties |
| 2005 | £286,150 | -3% |
2 Properties |
| 2004 | £295,000 | -49% |
2 Properties |
| 2003 | £439,983 | 51% |
3 Properties |
| 2002 | £215,000 | 34% |
1 Property |
| 2001 | £142,500 | -34% |
2 Properties |
| 2000 | £191,250 | 21% |
4 Properties |
| 1999 | £150,375 | 37% |
4 Properties |
| 1998 | £94,000 | -179% |
2 Properties |
| 1997 | £262,475 | 71% |
2 Properties |
| 1996 | £76,000 | -157% |
1 Property |
| 1995 | £195,000 | - |
2 Properties |
Property Price per Property Type in Bletchingley And Nutfield
Here you can find historic sold price data in order to help with your property search.
The average Property Paid Price for specific property types in the last three years are:
| Property Type | Average Sold Price | Sold Properties |
|---|---|---|
| Flat | £312,500.00 | 1 Flat |
| Detached House | £655,666.00 | 3 Detached Houses |
| Terraced House | £415,000.00 | 1 Terraced House |