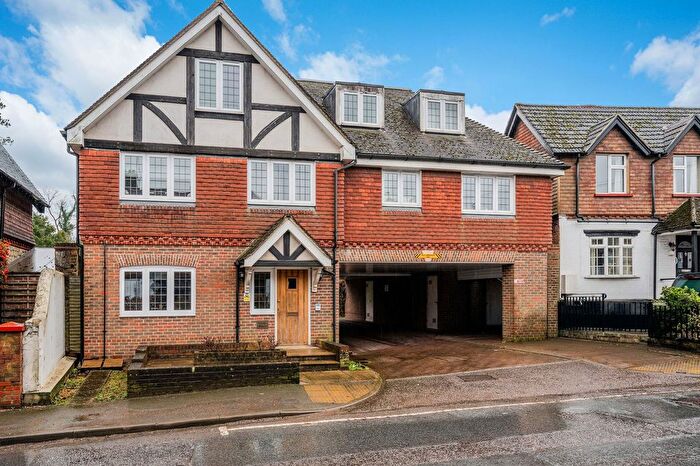
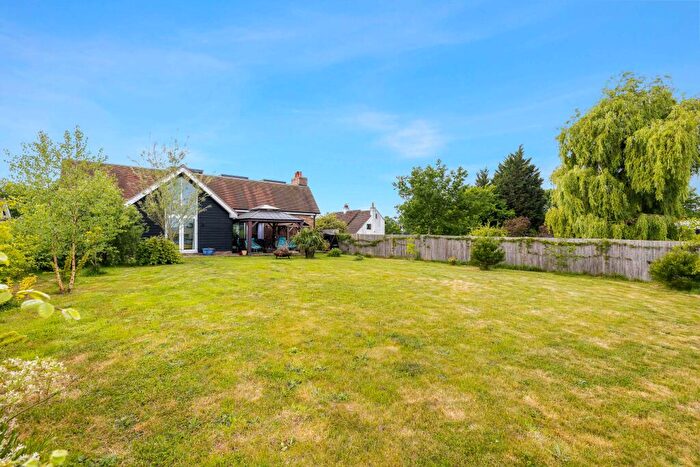
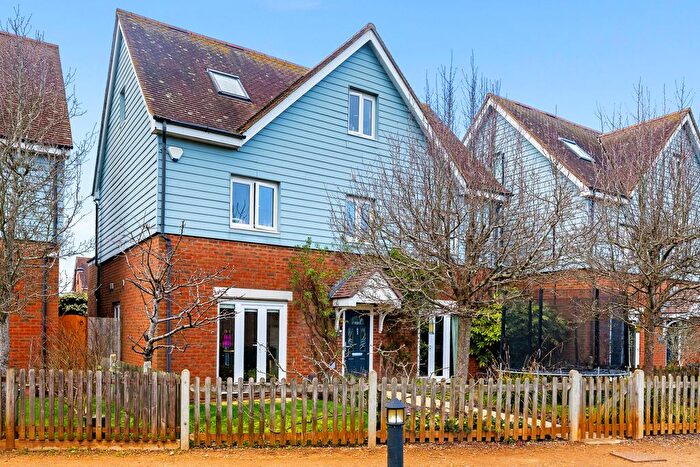
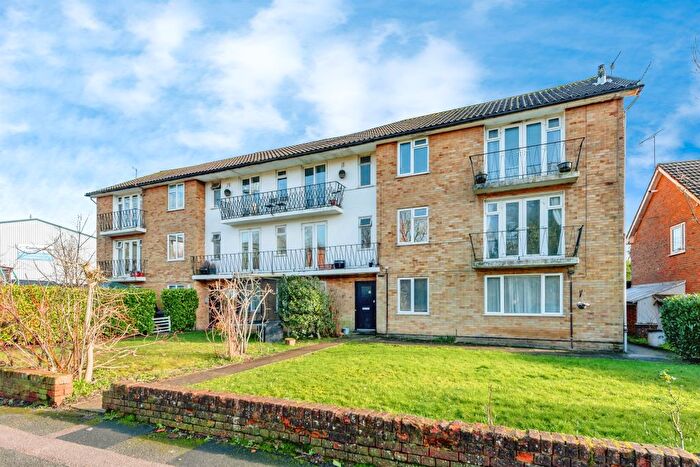
Houses for sale & to rent in Bletchingley And Nutfield, Redhill
House Prices in Bletchingley And Nutfield
Properties in Bletchingley And Nutfield have an average house price of £593,281.00 and had 194 Property Transactions within the last 3 years¹.
Bletchingley And Nutfield is an area in Redhill, Surrey with 2,211 households², where the most expensive property was sold for £2,000,000.00.
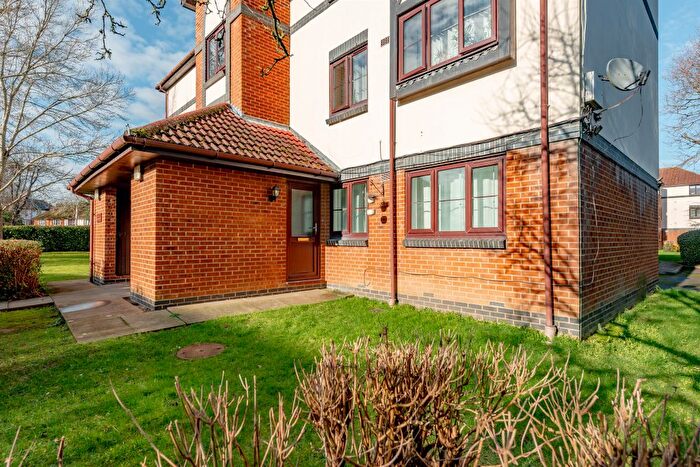
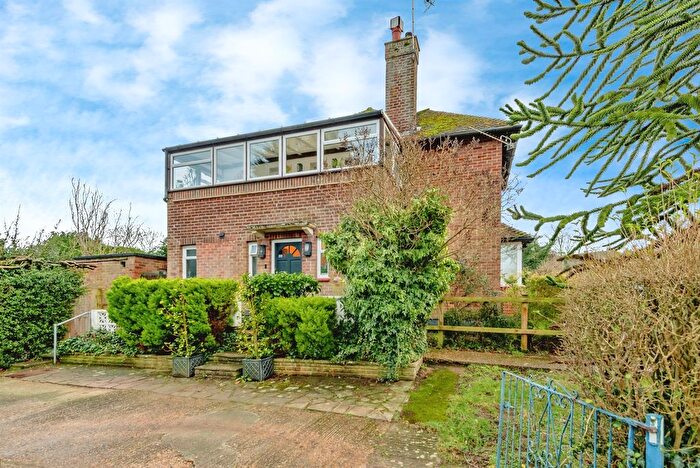
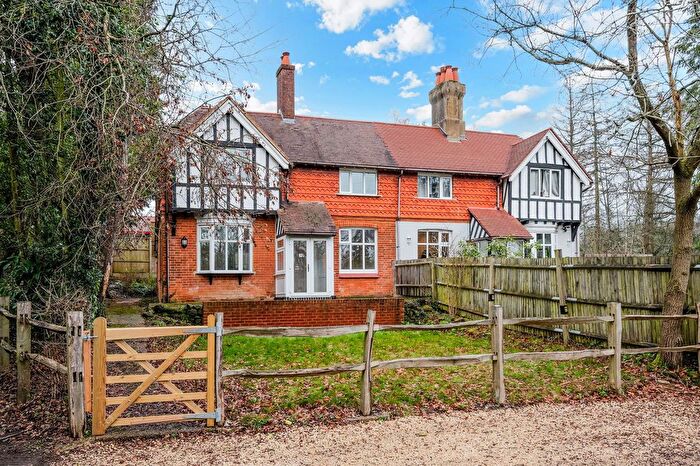
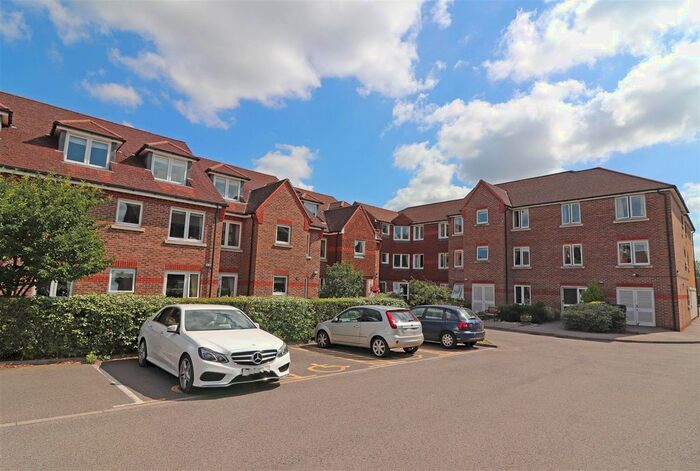
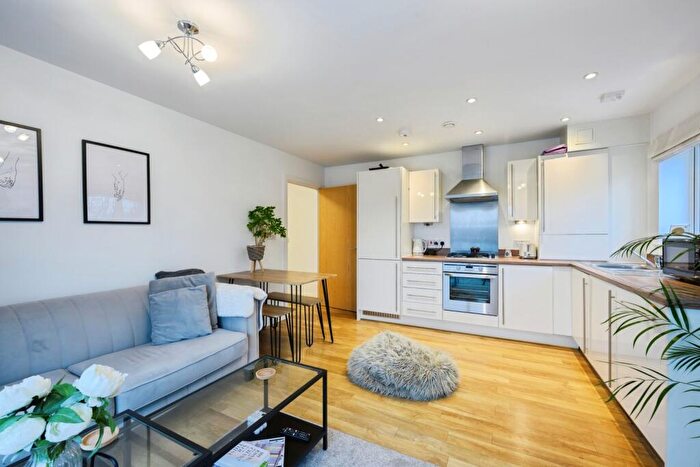
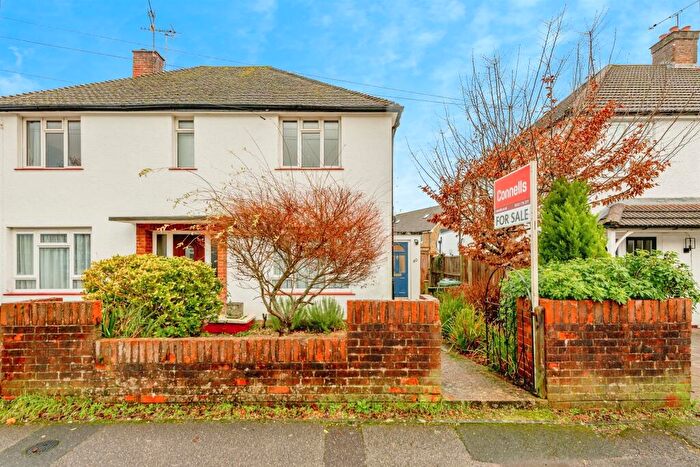
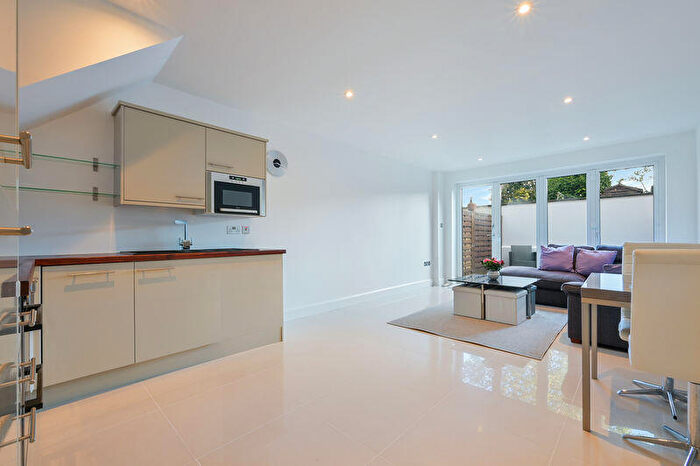
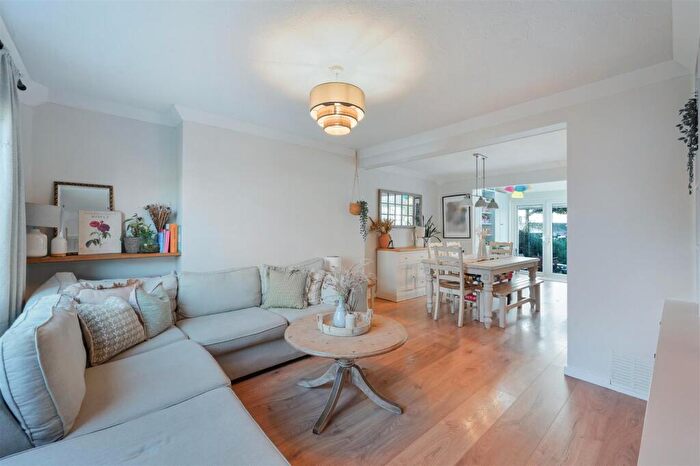
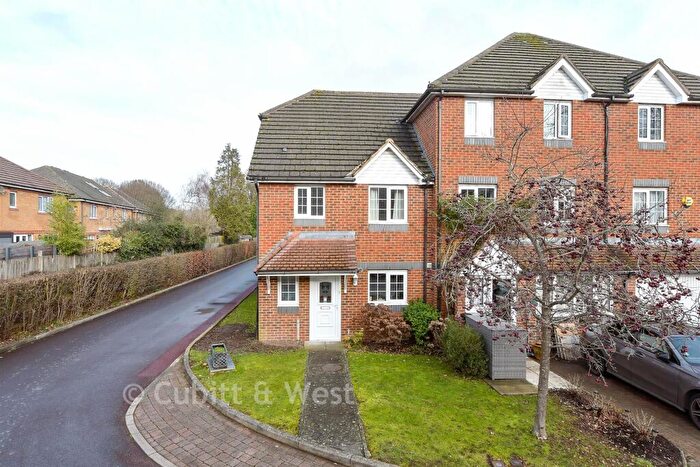
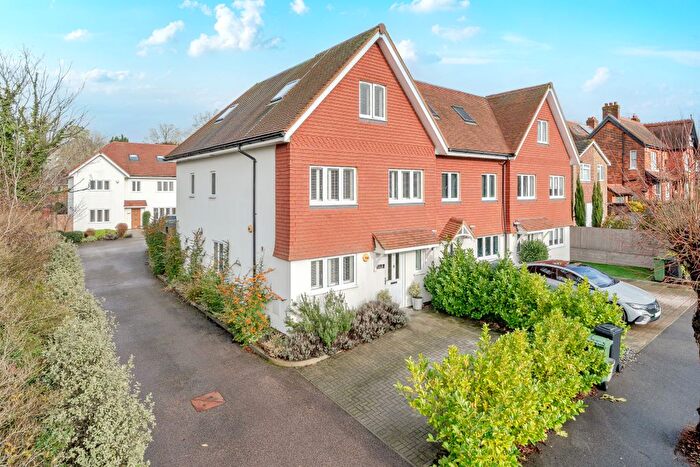
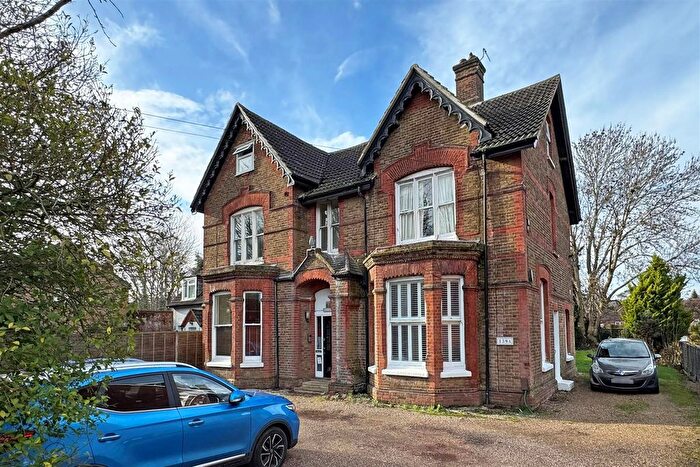
Properties for sale in Bletchingley And Nutfield
Roads and Postcodes in Bletchingley And Nutfield
Navigate through our locations to find the location of your next house in Bletchingley And Nutfield, Redhill for sale or to rent.
| Streets | Postcodes |
|---|---|
| Adlington Cottages | RH1 4HB |
| Anns Walk | RH1 4PG |
| Barfields | RH1 4RA RH1 4RD |
| Big Common Lane | RH1 4QE |
| Blacklands Meadow | RH1 4EW |
| Bletchingley Road | RH1 4HN RH1 4HP RH1 4HW |
| Boterys Cross | RH1 4QB |
| Bower Hill Close | RH1 5NQ |
| Bower Hill Lane | RH1 4EH |
| Braes Mead | RH1 4JR |
| Brakey Hill | RH1 4PT |
| Brewer Street | RH1 4QP |
| Castle Close | RH1 4LG |
| Castle Cottages | RH1 4NX |
| Castle Square | RH1 4LB RH1 4LD |
| Castle Street | RH1 4NS RH1 4NU RH1 4QA RH1 4LA RH1 4QD |
| Church Hill | RH1 4JA |
| Church Lane | RH1 4LP |
| Church Walk | RH1 4PD |
| Clare Cottages | RH1 4RE |
| Clay Lane | RH1 4EG |
| Clerks Croft | RH1 4LH |
| Cleves Way | RH1 4EZ |
| Coldharbour Lane | RH1 4NA |
| Coldstream Close | RH1 4BY |
| Coneybury | RH1 4PP RH1 4PR RH1 4PS |
| Coopers Hill Road | RH1 4HS RH1 4HX RH1 4HY RH1 4HZ RH1 5PD |
| Crab Hill Lane | RH1 5NR RH1 5PG |
| Crescent Road | RH1 4RB |
| Cricket Hill | RH1 5SE |
| Cuckseys Lane | RH1 4NH |
| De Clare Court | RH1 4GA |
| Deans Lane | RH1 4HR |
| Eastfield Road | RH1 4DY RH1 4DX |
| Edwards Villas | RH1 4JQ |
| Gayler Close | RH1 4RG |
| Godstone Road | RH1 4LT RH1 4PL |
| Grange Close | RH1 4LW |
| Greensand Close | RH1 4FU |
| Hart Close | RH1 4RH |
| Hawthorn Way | RH1 4DU |
| Hextalls Lane | RH1 4QT |
| High Street | RH1 4HE RH1 4HF RH1 4HG RH1 4HH RH1 4HQ RH1 4LJ RH1 4PA RH1 4PB RH1 4PE RH1 4PH |
| Hilltop Lane | RH1 3DF |
| Holmesdale Park | RH1 4NW |
| Holmesdale Road | RH1 4JE |
| Hunters Gate | RH1 4HT |
| Kenrick Square | RH1 4PU |
| Kentwyns Rise | RH1 4JP |
| Kings Cross Lane | RH1 5NG RH1 5NJ RH1 5NP RH1 5NS RH1 5NT RH1 5NU RH1 5NY RH1 5RL |
| Kings Mill Lane | RH1 5NB RH1 5JY RH1 5JZ |
| Kingsmead | RH1 5NN |
| Kingsmill Lane | RH1 5YP |
| Little Common Lane | RH1 4QF RH1 4QG |
| Mid Street | RH1 4JD RH1 4JH RH1 4JJ RH1 4JU RH1 4JX RH1 5RP RH1 4JY |
| Morris Road | RH1 5SA RH1 5SB |
| Netherleigh Park | RH1 5NH |
| Nightingale Way | RH1 4RF |
| North Station Approach | RH1 4JF RH1 4JS |
| Nutfield Marsh Road | RH1 4ES RH1 4EU RH1 4JB RH1 4ET |
| Nutfield Park | RH1 5PA |
| Nutfield Road | RH1 4EL |
| Oakwood Close | RH1 5RX |
| Oakwood Road | RH1 3DH RH1 3BU |
| Outwood Lane | RH1 4LR RH1 4LS RH1 4NJ RH1 4NL RH1 4GD |
| Overdale | RH1 4AG |
| Parkwood Road | RH1 4HD |
| Pendell Road | RH1 4QH RH1 4QL RH1 4QJ |
| Pimlico Cottages | RH1 4HA |
| Place Farm Road | RH1 4QR |
| Pottersgate Cottages | RH1 4NF |
| Queens Court | RH1 5GZ |
| Rabies Heath Road | RH1 4LX RH1 4LY RH1 4LZ RH1 4NB RH1 4PN |
| Ridge Green | RH1 5RN |
| Ridge Green Close | RH1 5RW |
| Rockshaw Road | RH1 3DE |
| Roughets Lane | RH1 4QX |
| Sandy Lane | RH1 4QW RH1 4EJ RH1 4QN |
| Shortacres | RH1 4HJ |
| South Park Lane | RH1 4NE RH1 4ND RH1 4NG |
| South Station Approach | RH1 5RU |
| Springbottom Lane | RH1 4QZ |
| St Catherines Cross | RH1 4PX |
| St Marys Walk | RH1 4LF |
| Stychens Close | RH1 4NY |
| Stychens Lane | RH1 4LL RH1 4LN |
| The Avenue | RH1 5RY |
| The Conduit | RH1 4QU |
| The Copse | RH1 5RR |
| The Old Yard | RH1 4GW |
| Thepps Close | RH1 5NX |
| Tilgate Common | RH1 4NP |
| Town Mead | RH1 4LQ |
| Trindles Road | RH1 4JG RH1 4JL RH1 4JN |
| Warwick Wold Road | RH1 3DG RH1 3DQ |
| Waterhouse Lane | RH1 4LU |
| White Hill Lane | RH1 4QS RH1 4QY |
| White Post Cottages | RH1 4PJ |
| RH1 3DL |
Transport near Bletchingley And Nutfield
- FAQ
- Price Paid By Year
- Property Type Price
Frequently asked questions about Bletchingley And Nutfield
What is the average price for a property for sale in Bletchingley And Nutfield?
The average price for a property for sale in Bletchingley And Nutfield is £593,281. This amount is 29% higher than the average price in Redhill. There are 5,373 property listings for sale in Bletchingley And Nutfield.
What streets have the most expensive properties for sale in Bletchingley And Nutfield?
The streets with the most expensive properties for sale in Bletchingley And Nutfield are South Park Lane at an average of £1,500,000, Sandy Lane at an average of £1,493,800 and Nutfield Park at an average of £1,380,000.
What streets have the most affordable properties for sale in Bletchingley And Nutfield?
The streets with the most affordable properties for sale in Bletchingley And Nutfield are Stychens Close at an average of £210,000, Blacklands Meadow at an average of £363,888 and Gayler Close at an average of £376,250.
Which train stations are available in or near Bletchingley And Nutfield?
Some of the train stations available in or near Bletchingley And Nutfield are Nutfield, Redhill and Merstham.
Property Price Paid in Bletchingley And Nutfield by Year
The average sold property price by year was:
| Year | Average Sold Price | Price Change |
Sold Properties
|
|---|---|---|---|
| 2025 | £604,631 | -0,3% |
61 Properties |
| 2024 | £606,534 | 5% |
58 Properties |
| 2023 | £573,802 | -7% |
75 Properties |
| 2022 | £612,746 | 12% |
82 Properties |
| 2021 | £540,347 | -4% |
117 Properties |
| 2020 | £563,326 | 6% |
68 Properties |
| 2019 | £529,725 | 2% |
93 Properties |
| 2018 | £521,368 | 2% |
51 Properties |
| 2017 | £511,725 | 1% |
59 Properties |
| 2016 | £504,091 | 0,2% |
96 Properties |
| 2015 | £503,059 | 9% |
84 Properties |
| 2014 | £457,628 | 15% |
105 Properties |
| 2013 | £389,583 | 2% |
85 Properties |
| 2012 | £382,061 | -5% |
77 Properties |
| 2011 | £401,599 | 7% |
69 Properties |
| 2010 | £373,199 | 2% |
71 Properties |
| 2009 | £365,666 | -7% |
59 Properties |
| 2008 | £391,058 | 5% |
51 Properties |
| 2007 | £370,390 | 12% |
129 Properties |
| 2006 | £325,418 | -4% |
125 Properties |
| 2005 | £337,452 | 8% |
92 Properties |
| 2004 | £309,176 | 3% |
125 Properties |
| 2003 | £299,124 | 14% |
103 Properties |
| 2002 | £258,720 | 19% |
133 Properties |
| 2001 | £209,346 | 15% |
121 Properties |
| 2000 | £177,949 | -8% |
115 Properties |
| 1999 | £191,413 | 11% |
122 Properties |
| 1998 | £169,876 | 24% |
117 Properties |
| 1997 | £129,845 | 7% |
112 Properties |
| 1996 | £120,462 | 4% |
82 Properties |
| 1995 | £115,851 | - |
87 Properties |
Property Price per Property Type in Bletchingley And Nutfield
Here you can find historic sold price data in order to help with your property search.
The average Property Paid Price for specific property types in the last three years are:
| Property Type | Average Sold Price | Sold Properties |
|---|---|---|
| Flat | £348,250.00 | 22 Flats |
| Semi Detached House | £546,171.00 | 70 Semi Detached Houses |
| Detached House | £871,346.00 | 52 Detached Houses |
| Terraced House | £477,864.00 | 50 Terraced Houses |

