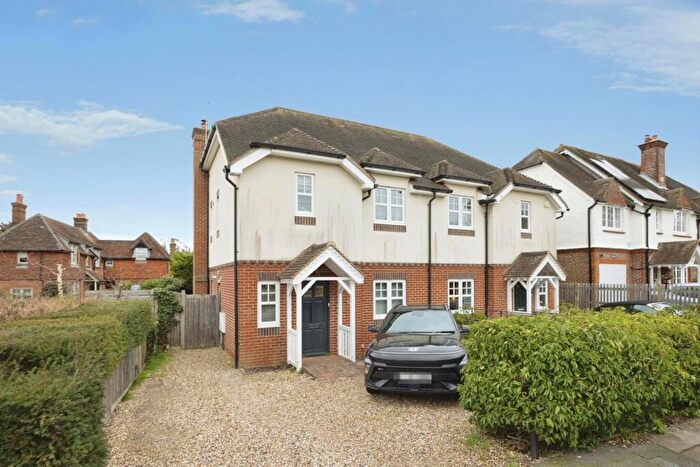
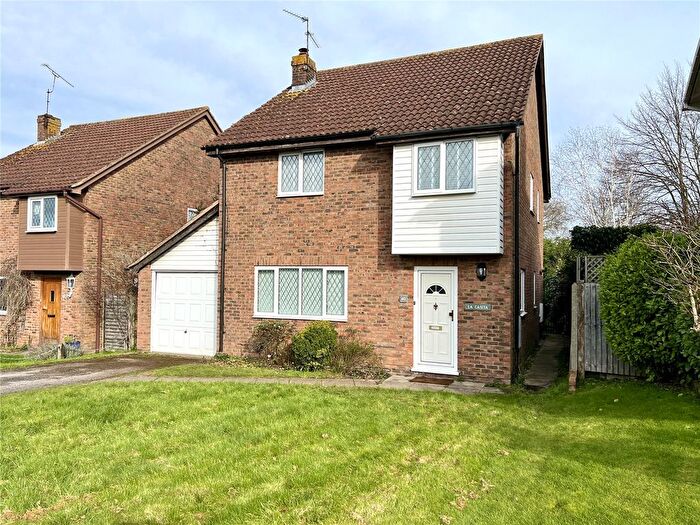
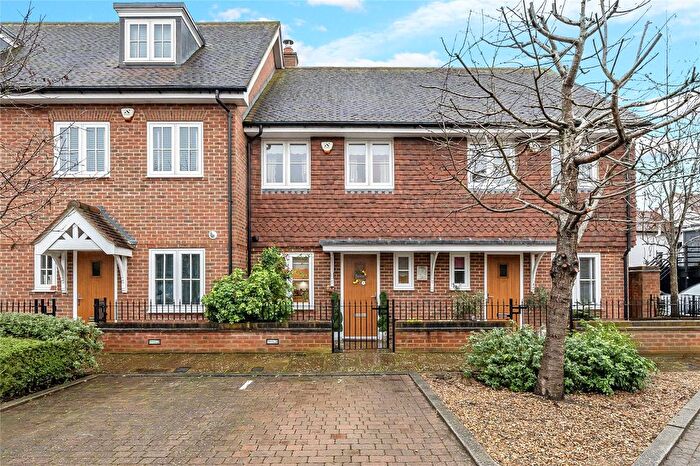
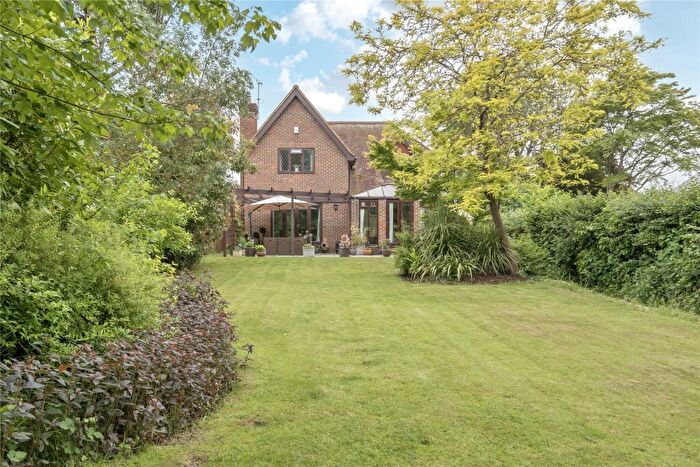
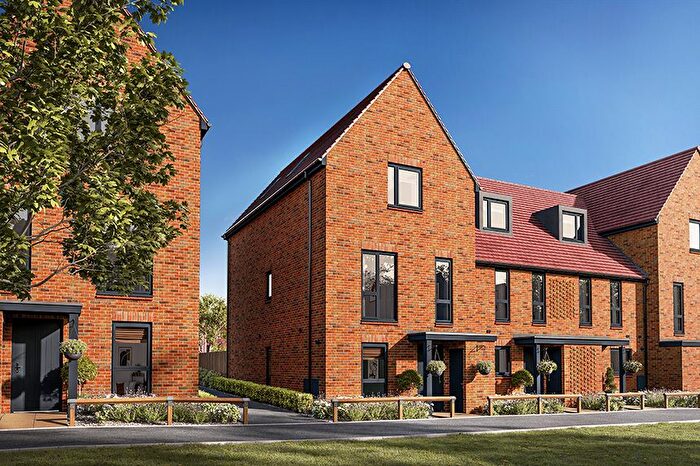
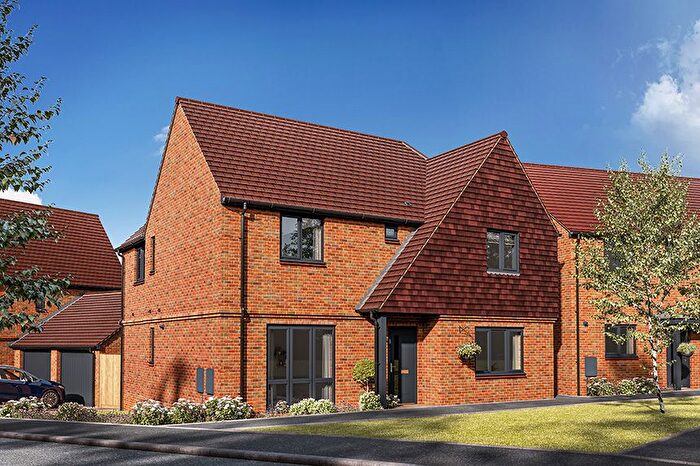
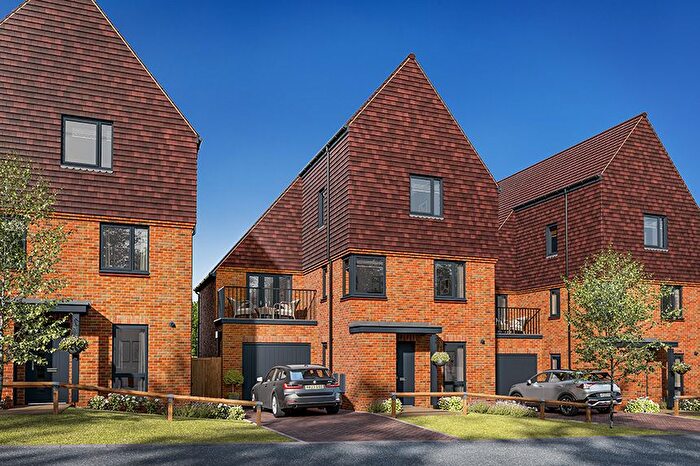
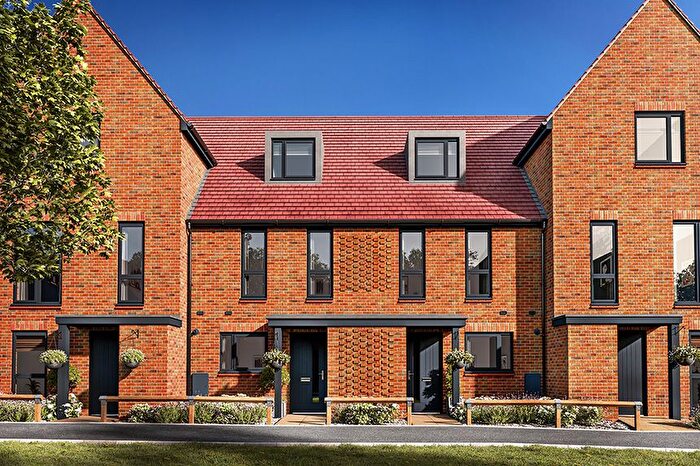
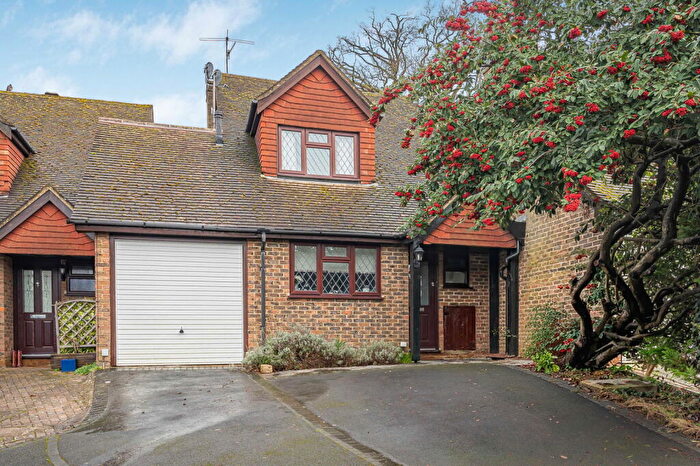
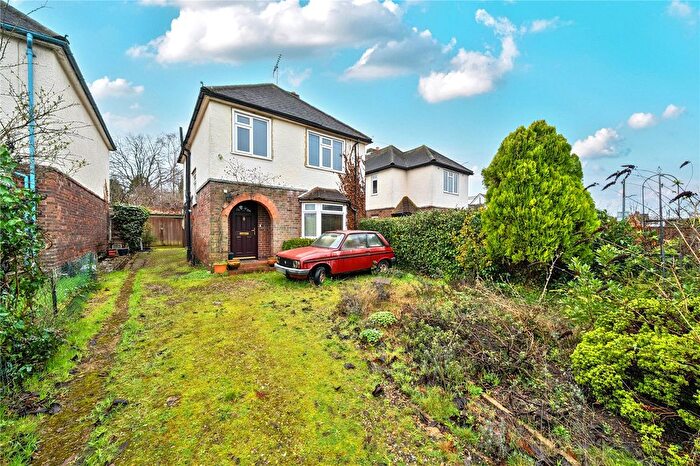
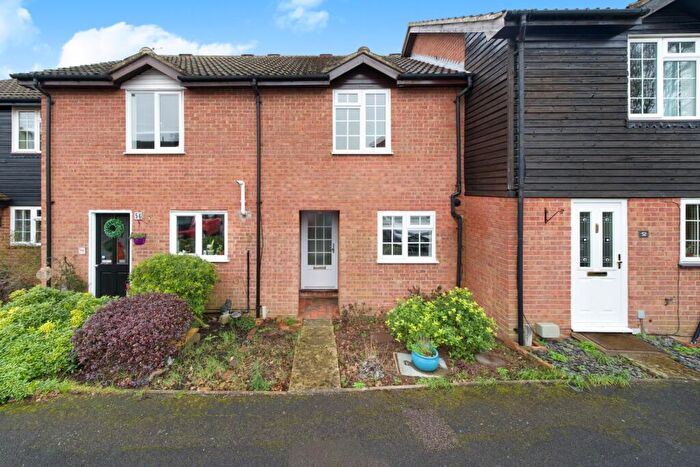
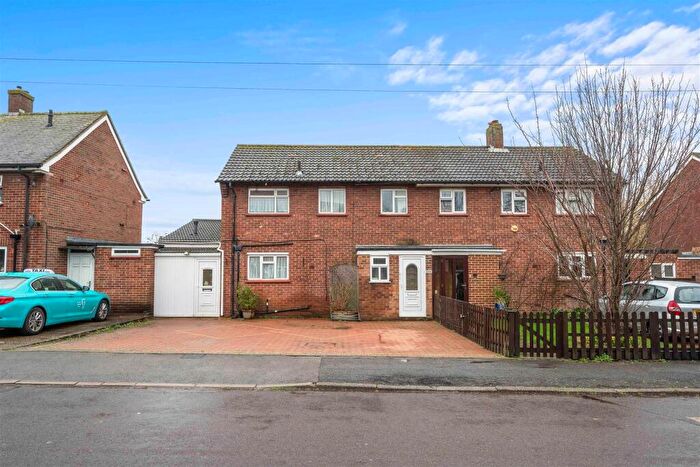
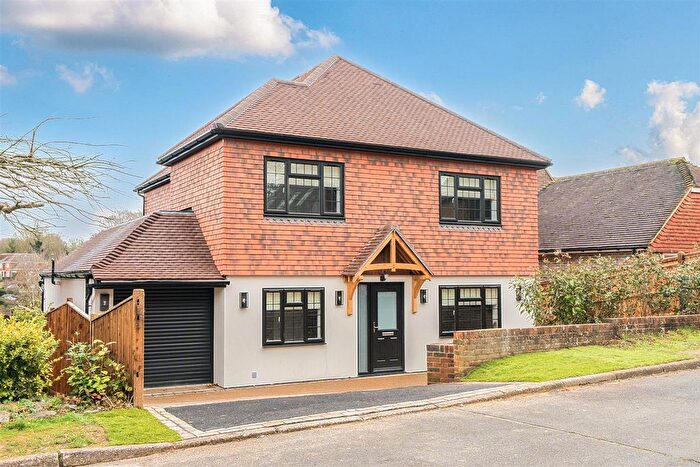
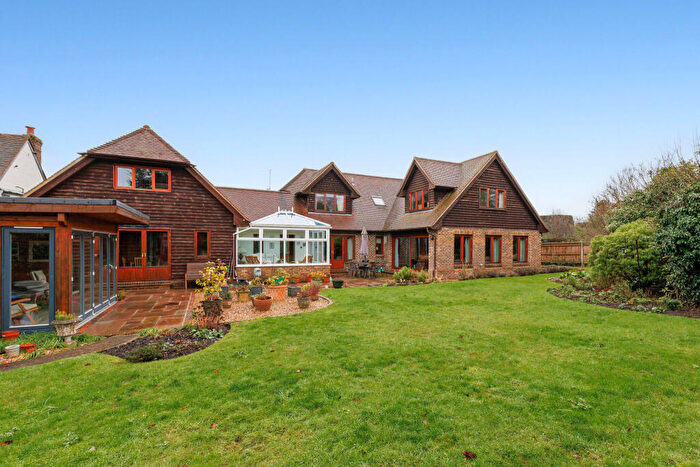
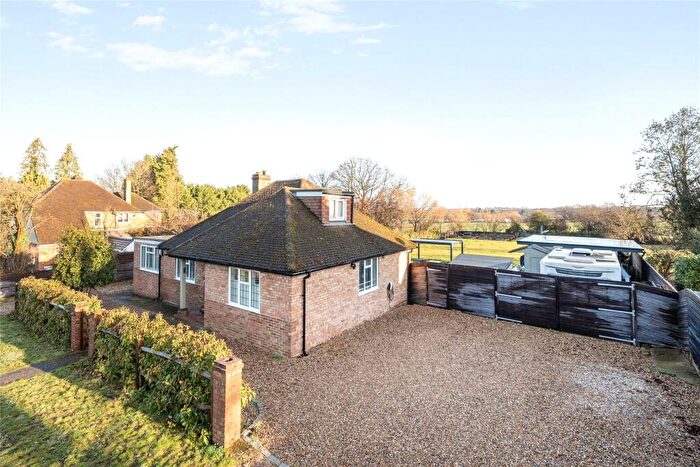
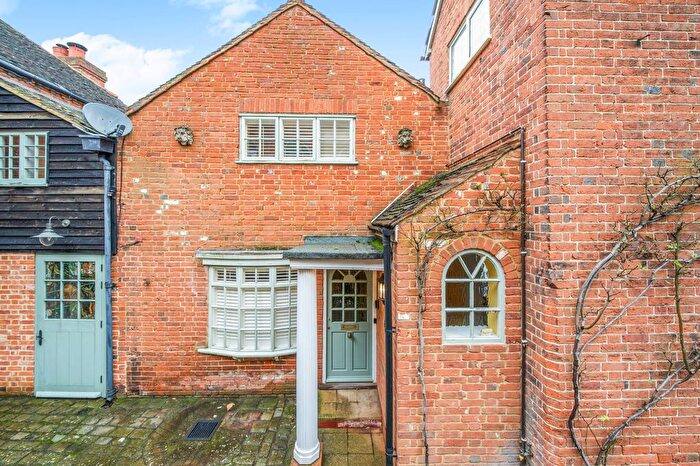
Houses for sale & to rent in Clandon And Horsley, Guildford
House Prices in Clandon And Horsley
Properties in Clandon And Horsley have an average house price of £1,254,926.00 and had 41 Property Transactions within the last 3 years¹.
Clandon And Horsley is an area in Guildford, Surrey with 612 households², where the most expensive property was sold for £2,100,000.00.
Properties for sale in Clandon And Horsley
Roads and Postcodes in Clandon And Horsley
Navigate through our locations to find the location of your next house in Clandon And Horsley, Guildford for sale or to rent.
| Streets | Postcodes |
|---|---|
| Back Lane | GU4 7SA GU4 7SD GU4 7SB |
| Bennett Way | GU4 7TN |
| Blakes Lane | GU4 7RR |
| Clandon Park | GU4 7RQ |
| Clandon Road | GU4 7TL GU4 7UU GU4 7UW GU4 7UN GU4 7UX |
| Dedswell Drive | GU4 7TQ |
| Epsom Road | GU4 7RL GU4 7RN GU4 7FN GU4 7SJ GU4 7TT |
| Felix Drive | GU4 7TH |
| Glebe Cottages | GU4 7RJ |
| Green Lane | GU4 7UP GU4 7UR |
| Hatchlands | GU4 7RT |
| High Clandon | GU4 7RP |
| Highcotts Lane | GU4 7XA |
| Lime Close | GU4 7UL |
| Lime Grove | GU4 7UH GU4 7UT |
| Malacca Farm | GU4 7UG GU4 7UQ |
| Meadowlands | GU4 7SZ GU4 7TA GU4 7TB |
| Merrow Lane | GU4 7LE |
| Oak Grange Road | GU4 7TZ GU4 7UA GU4 7UB GU4 7UD GU4 7UE GU4 7UF |
| Parkside Cottages | GU4 7ST |
| Ripley Road | GU4 7SE GU4 7SF GU4 7SG GU4 7SQ GU4 7SH |
| School Lane | GU4 7RS |
| Shere Road | GU4 8SF GU4 8SG GU4 8SQ |
| St Thomas Drive | GU4 7RZ |
| Staple Lane | GU4 7FP |
| The Street | GU4 7RG GU4 7RU GU4 7RX GU4 7RY GU4 7SY GU4 7TD GU4 7TE GU4 7TF GU4 7TG GU4 7TJ GU4 7SU GU4 7SX |
| Waterfields | GU4 7TU |
| Woodstock | GU4 7UJ |
Transport near Clandon And Horsley
-
Clandon Station
-
Horsley Station
-
London Road Guildford Station
-
Chilworth Station
-
Gomshall Station
-
Effingham Junction Station
-
Guildford Station
-
Worplesdon Station
-
Shalford Station
-
Woking Station
- FAQ
- Price Paid By Year
- Property Type Price
Frequently asked questions about Clandon And Horsley
What is the average price for a property for sale in Clandon And Horsley?
The average price for a property for sale in Clandon And Horsley is £1,254,926. This amount is 104% higher than the average price in Guildford. There are 1,447 property listings for sale in Clandon And Horsley.
What streets have the most expensive properties for sale in Clandon And Horsley?
The streets with the most expensive properties for sale in Clandon And Horsley are Shere Road at an average of £1,830,000, Highcotts Lane at an average of £1,800,000 and Dedswell Drive at an average of £1,645,000.
What streets have the most affordable properties for sale in Clandon And Horsley?
The streets with the most affordable properties for sale in Clandon And Horsley are Epsom Road at an average of £465,000, Meadowlands at an average of £486,666 and Parkside Cottages at an average of £678,333.
Which train stations are available in or near Clandon And Horsley?
Some of the train stations available in or near Clandon And Horsley are Clandon, Horsley and London Road Guildford.
Property Price Paid in Clandon And Horsley by Year
The average sold property price by year was:
| Year | Average Sold Price | Price Change |
Sold Properties
|
|---|---|---|---|
| 2025 | £1,421,466 | 22% |
15 Properties |
| 2024 | £1,115,000 | -9% |
14 Properties |
| 2023 | £1,210,000 | 5% |
12 Properties |
| 2022 | £1,145,837 | -1% |
21 Properties |
| 2021 | £1,159,064 | 7% |
27 Properties |
| 2020 | £1,079,222 | 21% |
20 Properties |
| 2019 | £852,201 | 1% |
13 Properties |
| 2018 | £844,725 | -7% |
20 Properties |
| 2017 | £901,964 | -9% |
14 Properties |
| 2016 | £986,321 | 29% |
14 Properties |
| 2015 | £695,522 | -31% |
22 Properties |
| 2014 | £911,573 | 2% |
19 Properties |
| 2013 | £889,200 | 18% |
10 Properties |
| 2012 | £731,214 | -4% |
21 Properties |
| 2011 | £757,060 | -35% |
24 Properties |
| 2010 | £1,025,138 | 30% |
20 Properties |
| 2009 | £717,458 | -8% |
12 Properties |
| 2008 | £775,388 | -18% |
18 Properties |
| 2007 | £917,912 | 27% |
29 Properties |
| 2006 | £671,258 | 26% |
23 Properties |
| 2005 | £498,878 | -13% |
21 Properties |
| 2004 | £564,601 | -10% |
26 Properties |
| 2003 | £621,982 | 42% |
28 Properties |
| 2002 | £362,593 | -44% |
17 Properties |
| 2001 | £520,960 | 38% |
20 Properties |
| 2000 | £323,657 | -19% |
19 Properties |
| 1999 | £384,798 | 17% |
38 Properties |
| 1998 | £319,198 | 14% |
26 Properties |
| 1997 | £274,900 | 26% |
23 Properties |
| 1996 | £204,177 | -9% |
27 Properties |
| 1995 | £222,391 | - |
13 Properties |
Property Price per Property Type in Clandon And Horsley
Here you can find historic sold price data in order to help with your property search.
The average Property Paid Price for specific property types in the last three years are:
| Property Type | Average Sold Price | Sold Properties |
|---|---|---|
| Semi Detached House | £674,111.00 | 9 Semi Detached Houses |
| Detached House | £1,449,032.00 | 31 Detached Houses |
| Terraced House | £465,000.00 | 1 Terraced House |

