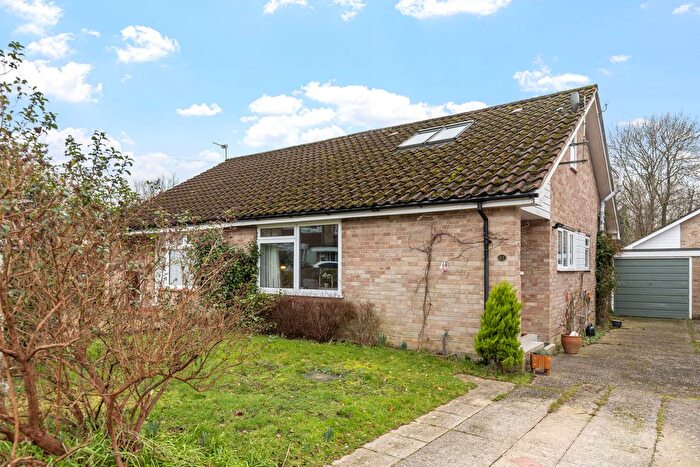
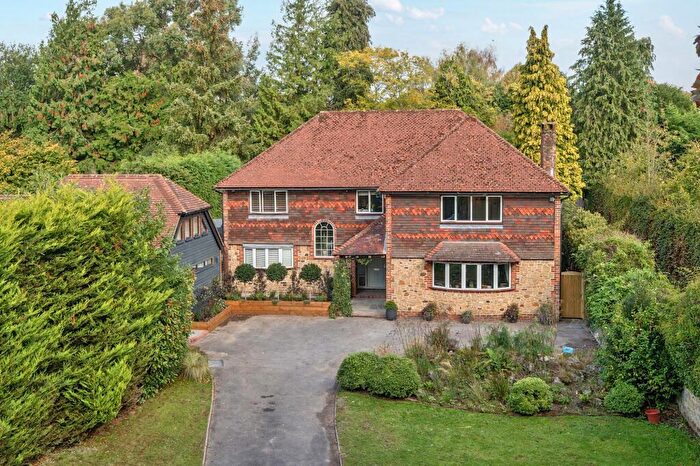
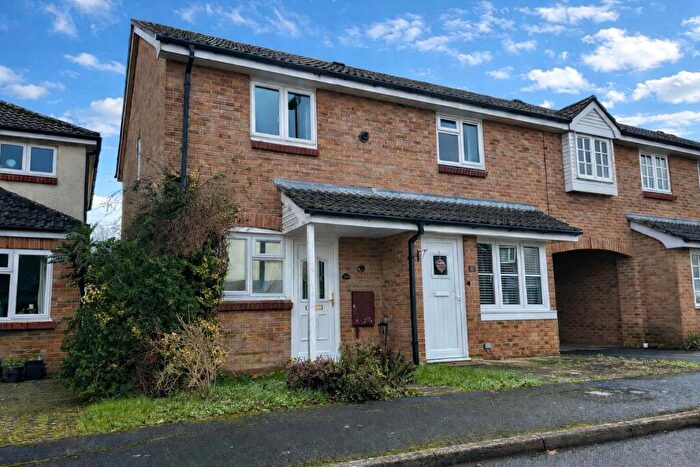
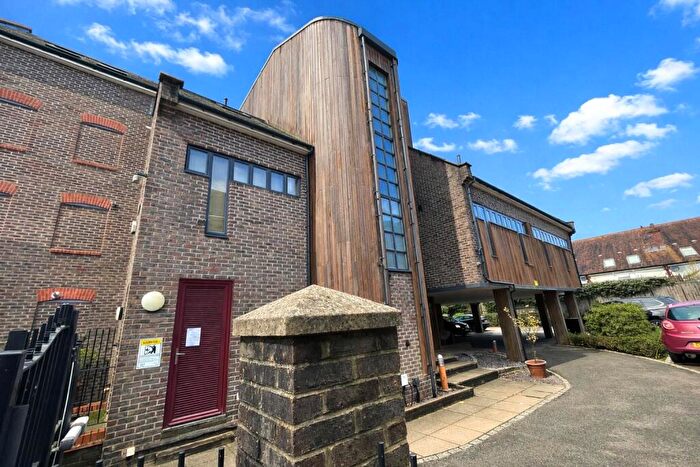
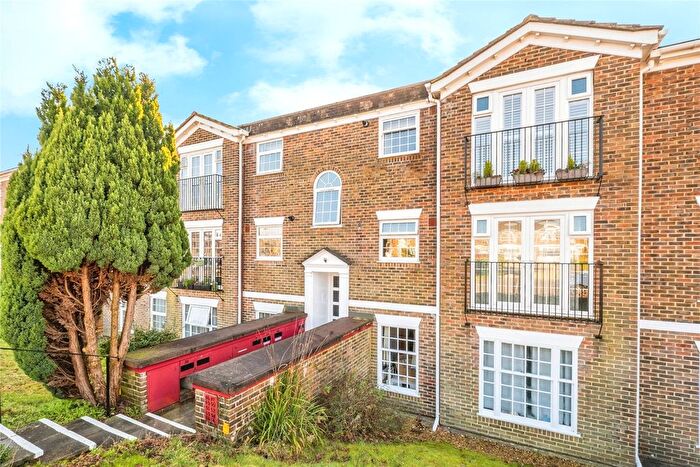
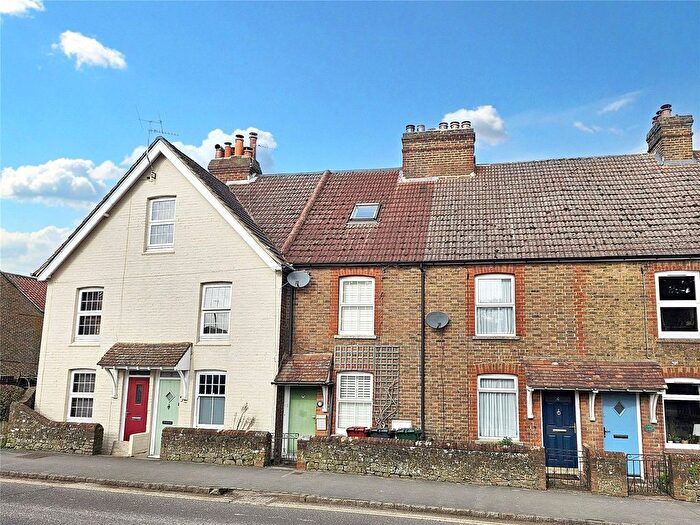
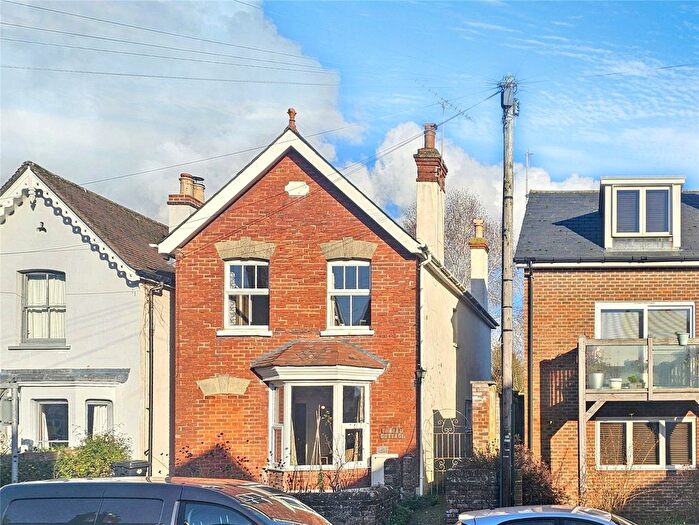
Houses for sale & to rent in Easebourne, Midhurst
House Prices in Easebourne
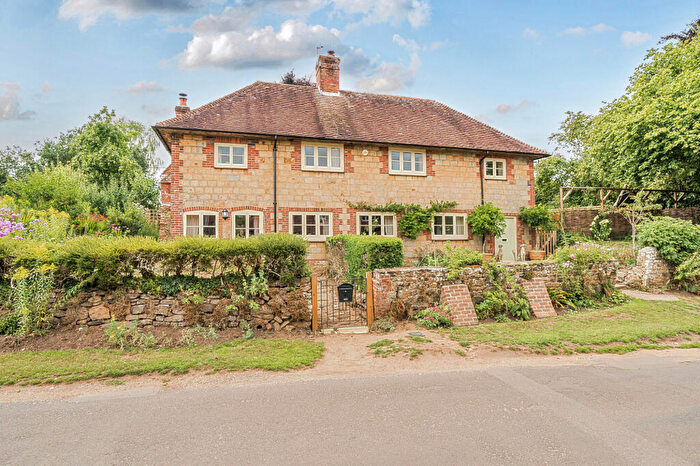
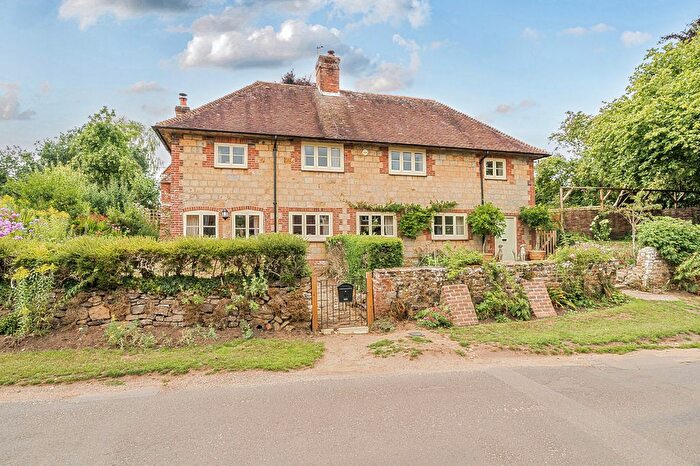
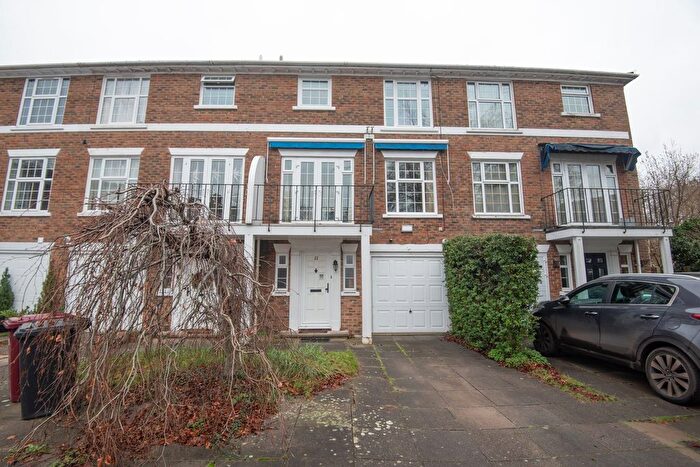
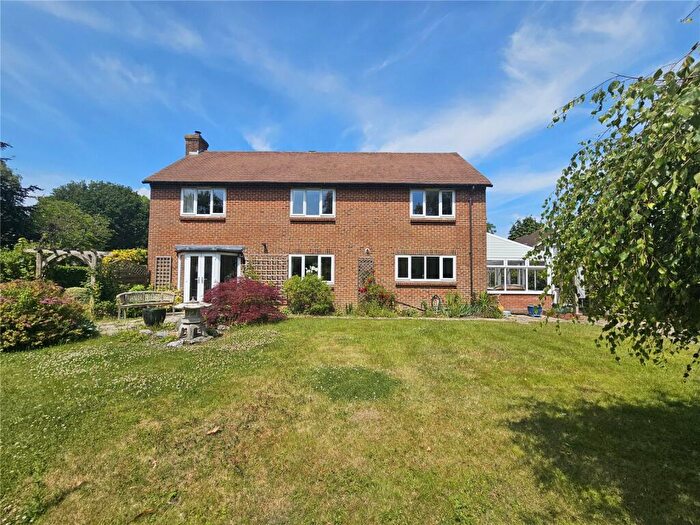
Properties in Easebourne have an average house price of £726,036.00 and had 76 Property Transactions within the last 3 years¹.
Easebourne is an area in Midhurst, Surrey with 781 households², where the most expensive property was sold for £2,050,000.00.
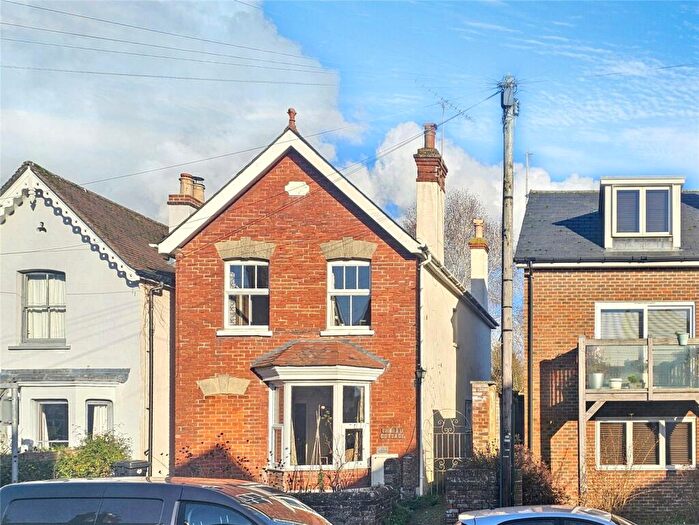
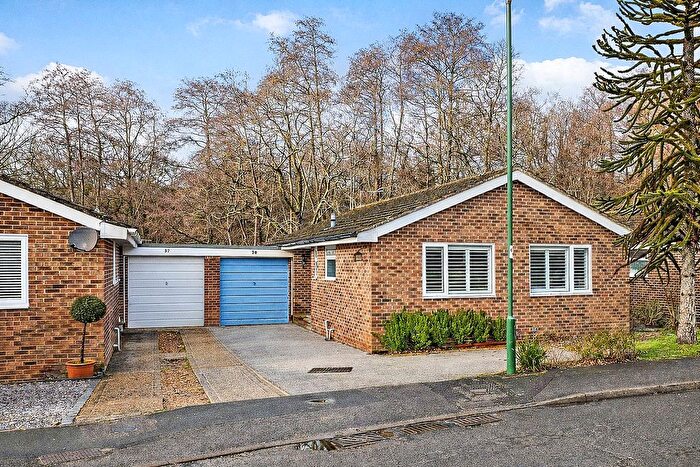
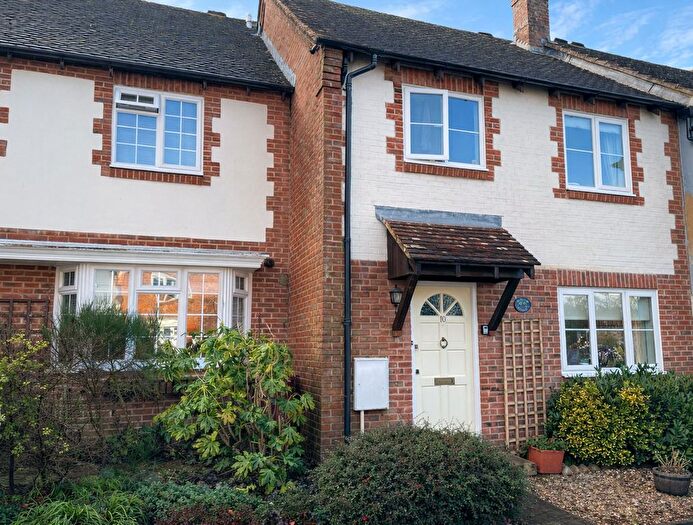
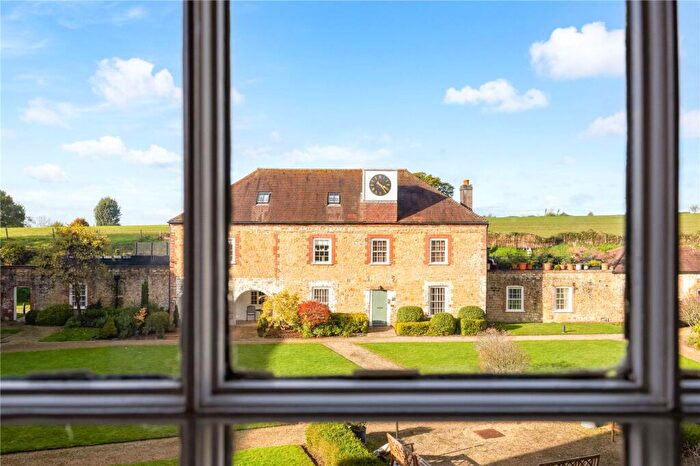
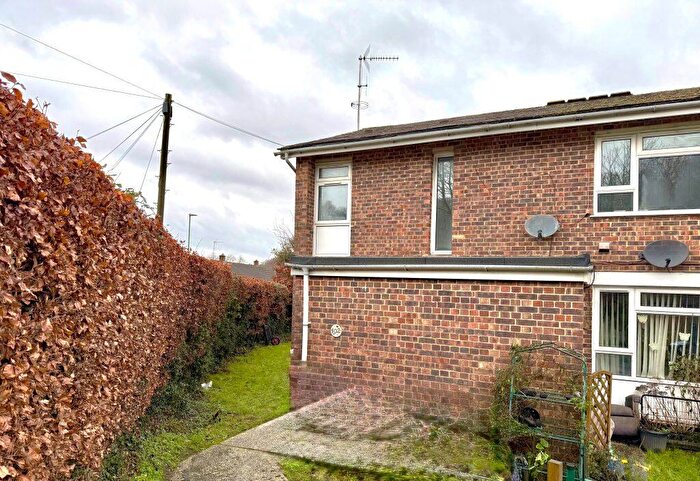
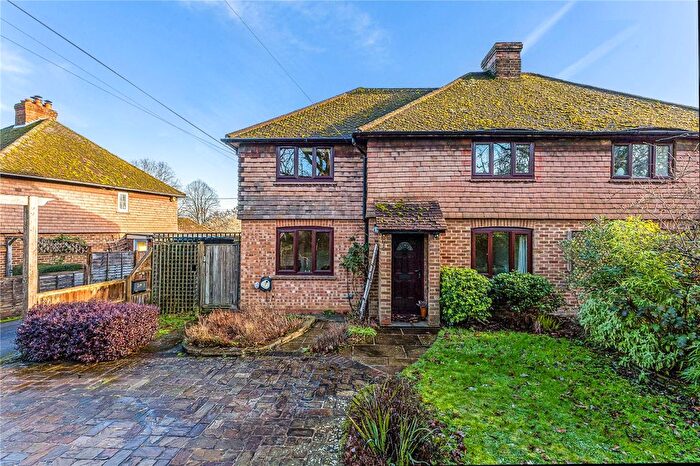
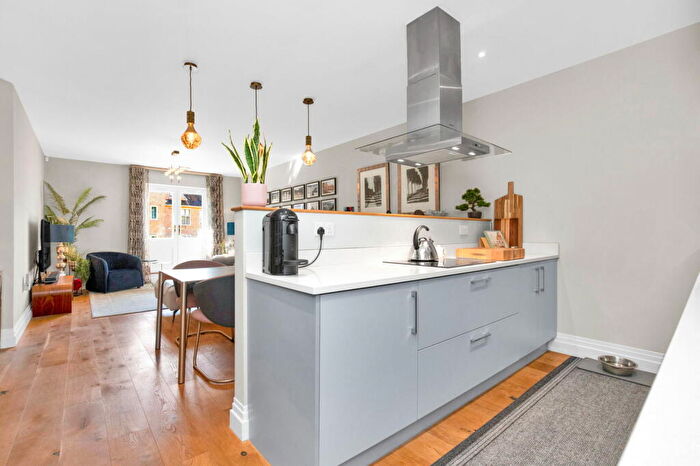
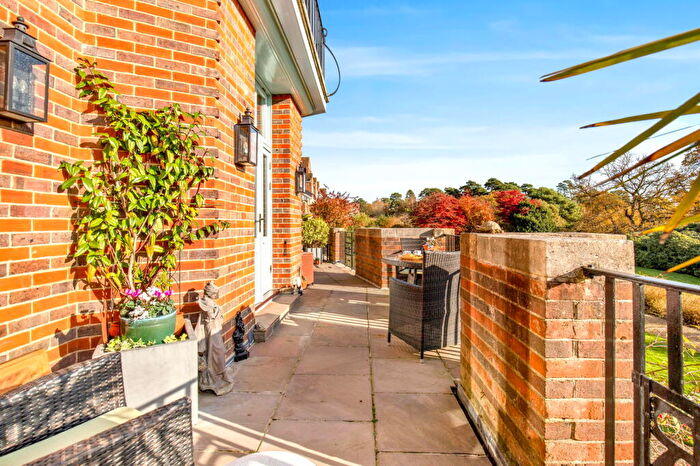
Properties for sale in Easebourne
Roads and Postcodes in Easebourne
Navigate through our locations to find the location of your next house in Easebourne, Midhurst for sale or to rent.
| Streets | Postcodes |
|---|---|
| Adams Walk | GU29 0FE GU29 0FF |
| Barons Court Mews | GU29 9RS |
| Brackenwood | GU29 0FB |
| Buddington Lane | GU29 0QP |
| Budgenor | GU29 0AB |
| Canada Cottages | GU29 0AA |
| Canada Grove | GU29 9AF |
| Church Path | GU29 0HL |
| Cowdray Park | GU29 0AX GU29 0AY GU29 0AZ GU29 0BA |
| Cowdray Road | GU29 9BQ |
| Cowdray Ruins | GU29 9AL |
| Crossways | GU29 9AA |
| Dodsley Grove | GU29 9AB GU29 9BE |
| Dodsley Lane | GU29 0AD GU29 9AP GU29 9AR GU29 9AS GU29 9BB GU29 9AN GU29 9AW |
| Easebourne Lane | GU29 9AY GU29 9AZ GU29 9BN GU29 9BW |
| Easebourne Street | GU29 0AL GU29 0BD GU29 0BE GU29 0BQ GU29 0BG |
| Egmont Road | GU29 9BG GU29 9AH |
| Fox Road | GU29 9BH GU29 9FE |
| Glaziers Lane | GU29 0AN GU29 0AR |
| Hazelwood Close | GU29 9BF |
| High Path | GU29 9BD GU29 9BP |
| Highfield Close | GU29 9AQ |
| Hollist Lane | GU29 0QN GU29 9AD |
| Hoyle Lane | GU29 0DS |
| Hurst Park | GU29 0BP |
| Kings Drive | GU29 0BH GU29 0BJ GU29 0EX GU29 0EY GU29 0FA GU29 0FH |
| Lutener Road | GU29 9AT |
| Mill Lane | GU29 0ED |
| Montague Road | GU29 9BJ |
| North Street | GU29 9AJ |
| Old Buddington Lane | GU29 0QW |
| Park Gates | GU29 0AH |
| Parkway | GU29 0AW |
| Perceval Close | GU29 9FF |
| Pine Walk | GU29 0AS |
| Selham Road | GU29 0BU |
| Sir Geoffrey Todd Walk | GU29 0FD |
| Snowhill | GU29 9BL |
| St Margarets Terrace | GU29 9AX |
| Strathmoor Gardens | GU29 9RT |
| Upperfield | GU29 9AE |
| Vanzell Road | GU29 9BA |
| Victoria Avenue | GU29 9AU |
| Weavers Close | GU29 9RU |
| Wheelbarrow Castle | GU29 9AG |
| GU29 0AJ GU29 0AE GU29 0AF GU29 0AG GU29 0AQ GU29 0BB GU29 0DD GU29 0DR GU29 0DY GU29 0DZ |
Transport near Easebourne
- FAQ
- Price Paid By Year
- Property Type Price
Frequently asked questions about Easebourne
What is the average price for a property for sale in Easebourne?
The average price for a property for sale in Easebourne is £726,036. This amount is 34% higher than the average price in Midhurst. There are 1,336 property listings for sale in Easebourne.
What streets have the most expensive properties for sale in Easebourne?
The streets with the most expensive properties for sale in Easebourne are Brackenwood at an average of £1,284,500, Hurst Park at an average of £1,262,500 and Upperfield at an average of £1,233,750.
What streets have the most affordable properties for sale in Easebourne?
The streets with the most affordable properties for sale in Easebourne are Victoria Avenue at an average of £308,333, Dodsley Lane at an average of £404,856 and Lutener Road at an average of £442,000.
Which train stations are available in or near Easebourne?
Some of the train stations available in or near Easebourne are Liphook, Haslemere and Liss.
Property Price Paid in Easebourne by Year
The average sold property price by year was:
| Year | Average Sold Price | Price Change |
Sold Properties
|
|---|---|---|---|
| 2025 | £791,666 | 22% |
21 Properties |
| 2024 | £619,296 | -32% |
32 Properties |
| 2023 | £814,619 | 6% |
23 Properties |
| 2022 | £762,417 | 31% |
44 Properties |
| 2021 | £523,060 | -7% |
75 Properties |
| 2020 | £559,032 | 14% |
67 Properties |
| 2019 | £478,507 | -16% |
55 Properties |
| 2018 | £554,947 | -15% |
58 Properties |
| 2017 | £639,992 | -1% |
61 Properties |
| 2016 | £645,135 | 1% |
66 Properties |
| 2015 | £638,804 | 19% |
46 Properties |
| 2014 | £516,312 | 17% |
40 Properties |
| 2013 | £427,646 | 4% |
30 Properties |
| 2012 | £410,293 | -17% |
22 Properties |
| 2011 | £480,043 | 30% |
22 Properties |
| 2010 | £333,935 | -22% |
24 Properties |
| 2009 | £408,813 | -20% |
27 Properties |
| 2008 | £489,421 | 9% |
19 Properties |
| 2007 | £443,427 | 1% |
42 Properties |
| 2006 | £438,500 | 16% |
29 Properties |
| 2005 | £370,376 | 2% |
25 Properties |
| 2004 | £361,549 | -0,5% |
23 Properties |
| 2003 | £363,346 | -19% |
29 Properties |
| 2002 | £430,595 | 45% |
40 Properties |
| 2001 | £238,247 | 5% |
22 Properties |
| 2000 | £226,243 | 33% |
22 Properties |
| 1999 | £152,593 | -25% |
41 Properties |
| 1998 | £190,989 | 40% |
24 Properties |
| 1997 | £113,918 | 27% |
22 Properties |
| 1996 | £83,684 | -11% |
25 Properties |
| 1995 | £93,187 | - |
24 Properties |
Property Price per Property Type in Easebourne
Here you can find historic sold price data in order to help with your property search.
The average Property Paid Price for specific property types in the last three years are:
| Property Type | Average Sold Price | Sold Properties |
|---|---|---|
| Semi Detached House | £590,714.00 | 7 Semi Detached Houses |
| Detached House | £1,054,991.00 | 31 Detached Houses |
| Terraced House | £494,038.00 | 13 Terraced Houses |
| Flat | £476,659.00 | 25 Flats |

