
Houses for sale in Easebourne, Petworth
House Prices in Easebourne
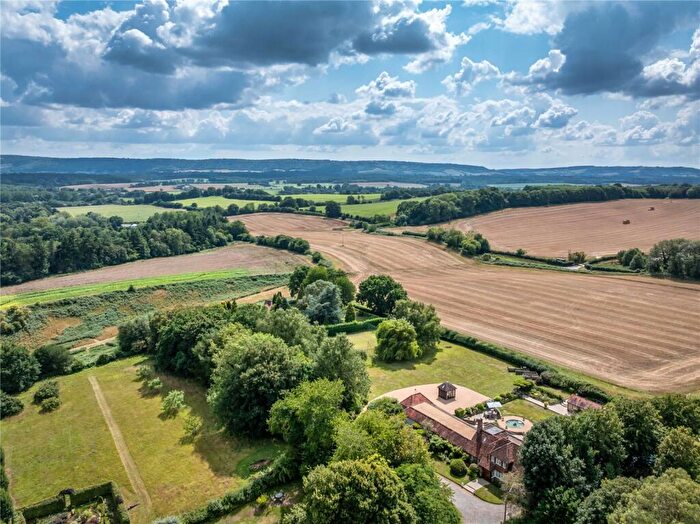
Properties in Easebourne have an average house price of £1.14M and had 25 Property Transactions within the last 3 years¹.
Easebourne is an area in Petworth, Surrey with 263 households², where the most expensive property was sold for £2.28M.
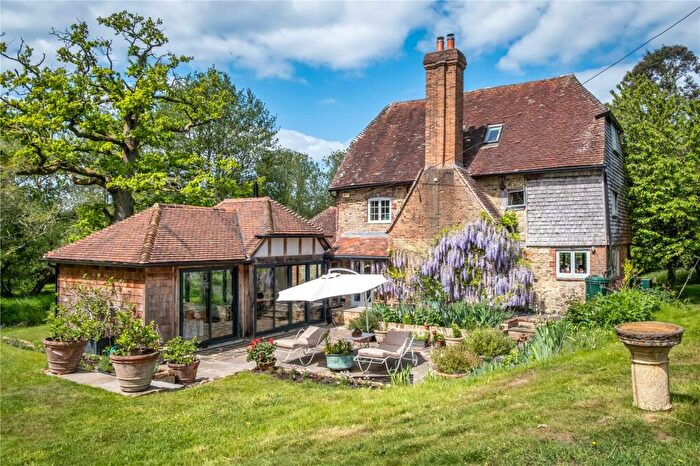
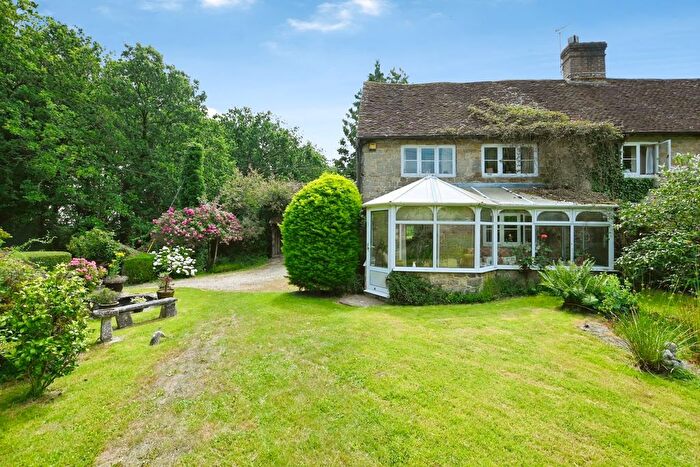
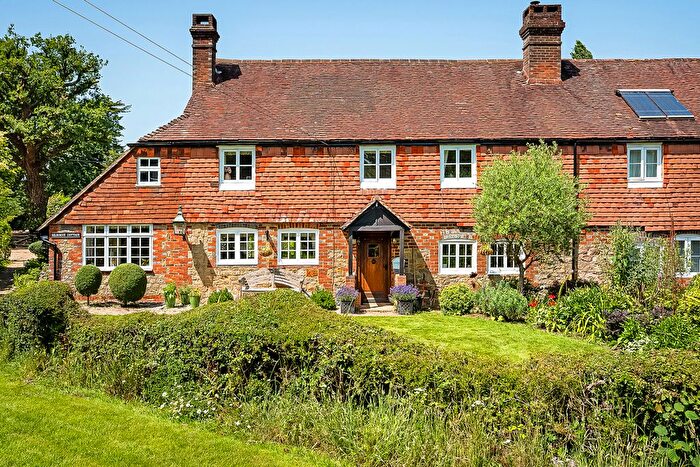
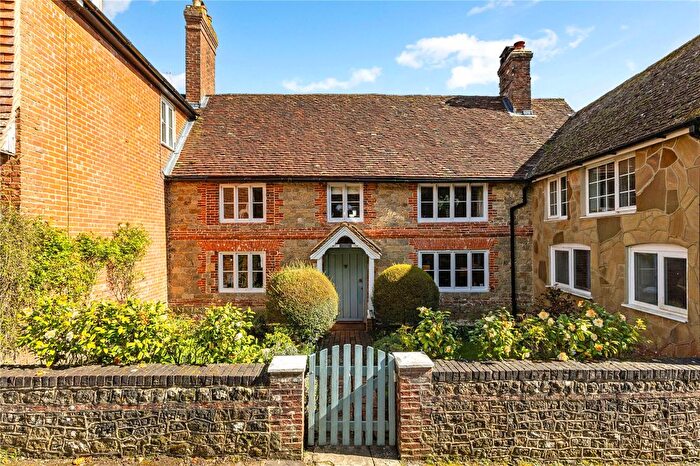
Properties for sale in Easebourne
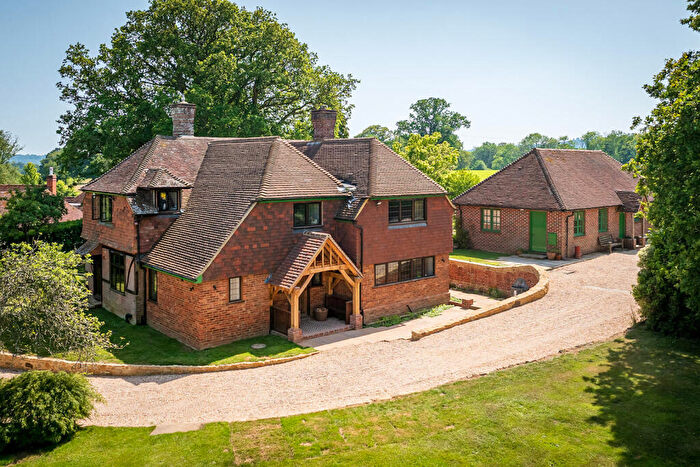
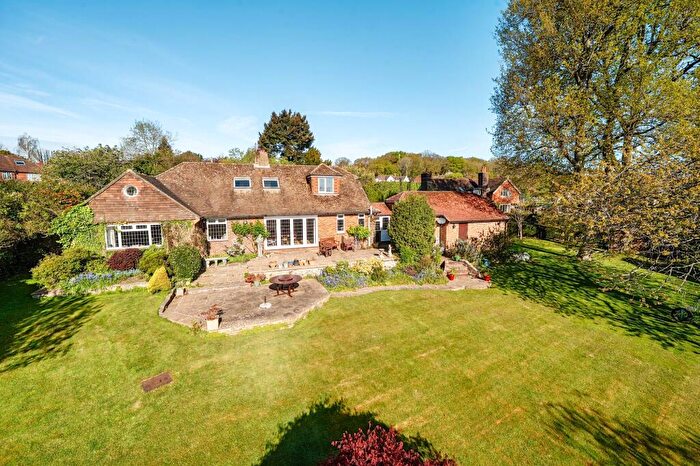
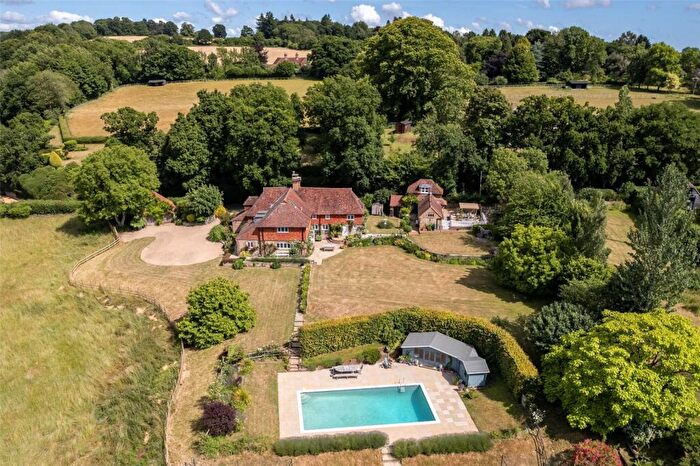

![]()
If you are looking to sell your house, let it out, or receive a property valuation, an expert can help you.
Click the button below to get started.
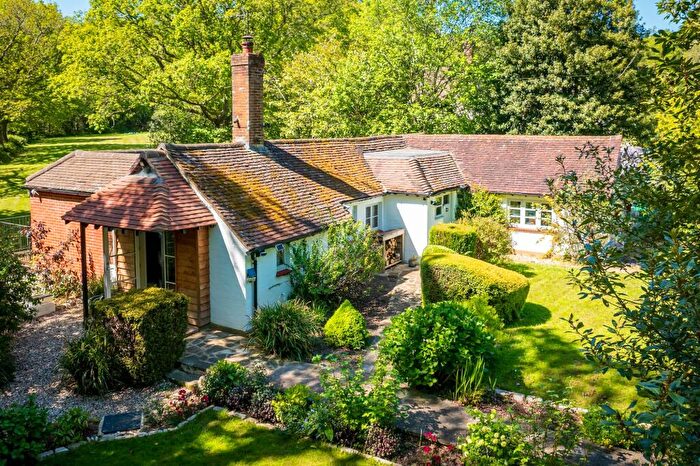
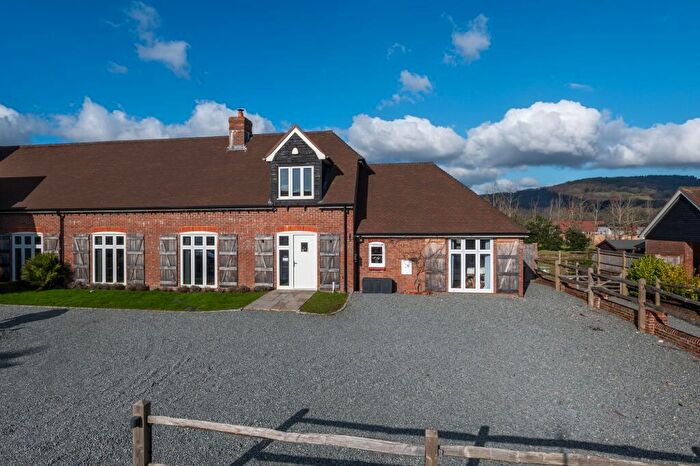
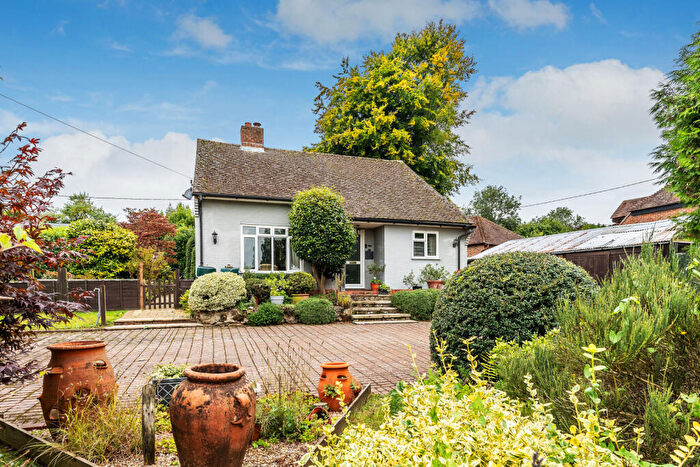
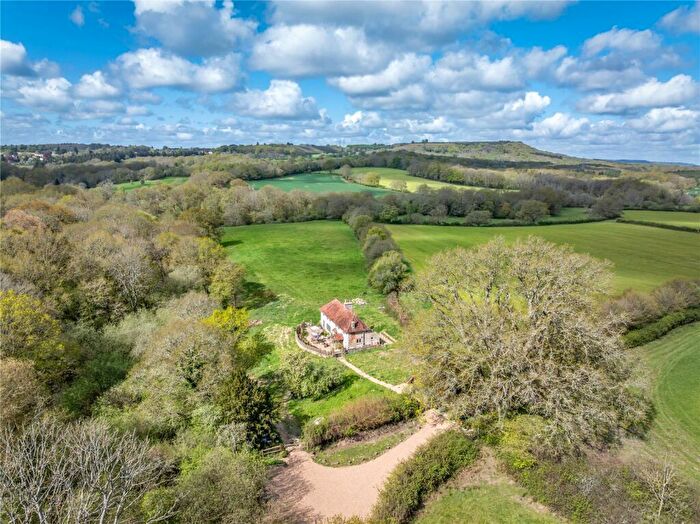
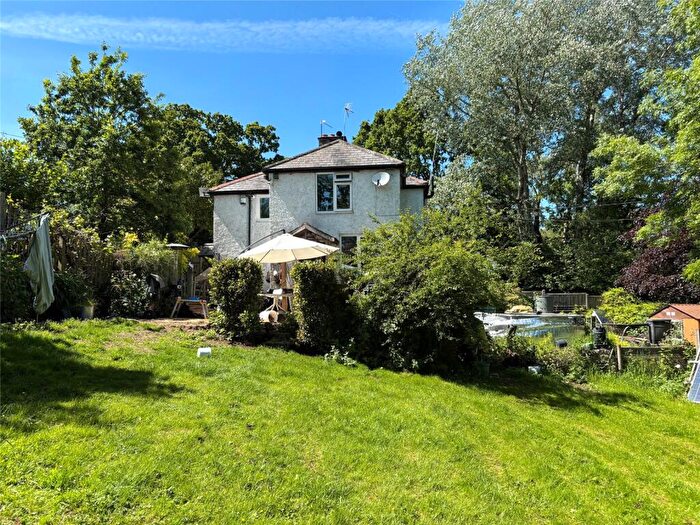
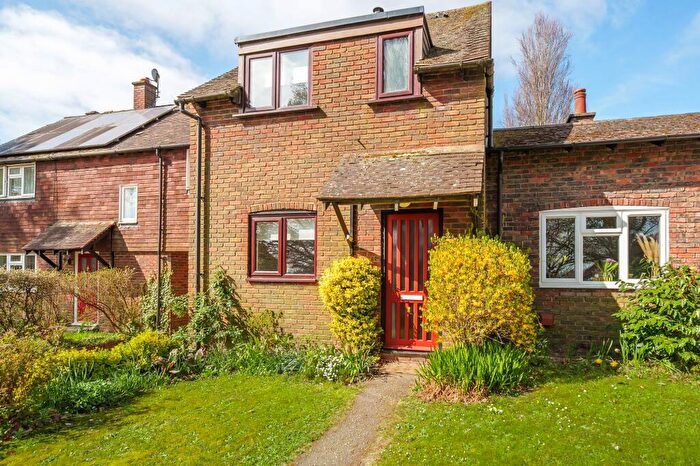
Previously listed properties in Easebourne
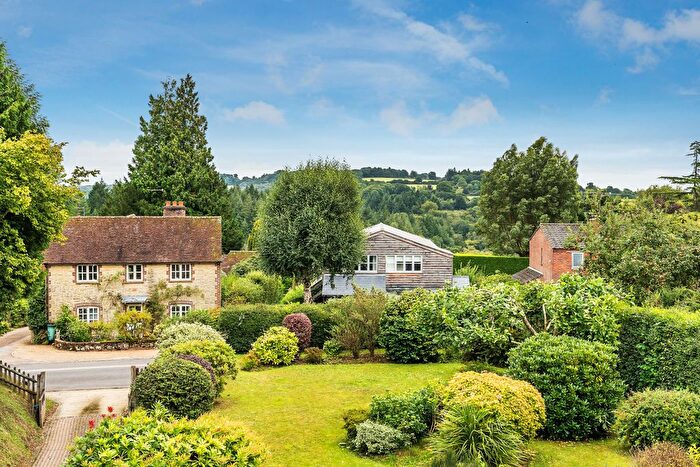
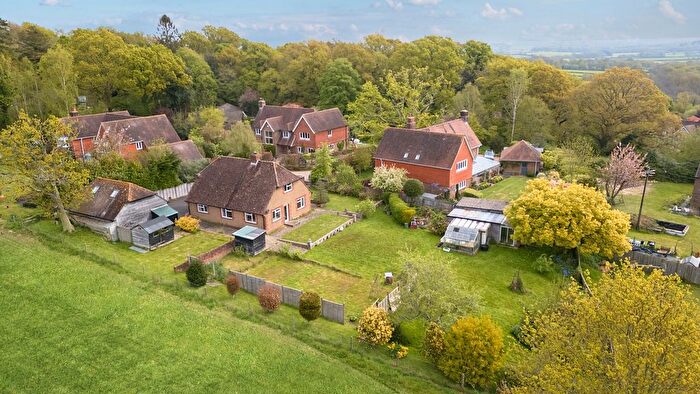
![]()
If you are looking to sell your house, let it out, or receive a property valuation, an expert can help you.
Click the button below to get started.


Roads and Postcodes in Easebourne
Navigate through our locations to find the location of your next house in Easebourne, Petworth for sale or to rent.
| Streets | Postcodes |
|---|---|
| Barnfield Cottages | GU28 0PL |
| Bexley Hill | GU28 9DZ GU28 9EA |
| Church Lane | GU28 9DD |
| Halfway Bridge | GU28 9BP |
| Hollihurst Road | GU28 9BT |
| Leggatt Hill | GU28 9DN GU28 9DP |
| Oakfield | GU28 9BL |
| School Lane | GU28 9DH GU28 9DQ |
| Selham Road | GU28 0RH |
| Shepherds Lane | GU28 9BN |
| The Croft | GU28 9BW |
| The Street | GU28 9BZ |
| Vicarage Lane | GU28 9DF |
| GU28 0PJ GU28 0PN GU28 0PS GU28 9BU GU28 9BX GU28 9BY GU28 9DA GU28 9DB GU28 9DE GU28 9DG GU28 9DJ GU28 9DL GU28 9DR GU28 9DS GU28 9DT GU28 9DU GU28 9DW GU28 9DX GU28 9DY GU28 9EY |
Property price trends in Easebourne
According to the latest Land Registry data, the average home in Easebourne sold for £754,166 in 2026. That figure comes from 358 sales logged over the past 31 years.
Prices have fallen back over the last three years. Compared with 2023, when the typical sale came in around £884,166, that's a fall of roughly 14.7%.
Looking back five years, average prices are down about 23.2% since 2021, a drop of around £227,927 in cash terms.
Zoom out to the past decade for the fuller picture. Back in 2016, homes here averaged £874,406, so the typical sold price has fallen about 13.8% since then, around 1.5% a year lower. Stretch the view to fifteen years and that annual pace edges up closer to 1.5%.
Frequently asked questions about Easebourne
What is the average price for a property for sale in Easebourne?
The average price for a property for sale in Easebourne is £1,139,200. This amount is 55% higher than the average price in Petworth. There are 119 property listings for sale in Easebourne.
What streets have the most expensive properties for sale in Easebourne?
The streets with the most expensive properties for sale in Easebourne are Bexley Hill at an average of £1,675,000, The Street at an average of £1,398,750 and Hollihurst Road at an average of £1,150,000.
What streets have the most affordable properties for sale in Easebourne?
The streets with the most affordable properties for sale in Easebourne are Church Lane at an average of £875,000, Leggatt Hill at an average of £962,500 and School Lane at an average of £1,065,000.
Which train stations are available in or near Easebourne?
Some of the train stations available in or near Easebourne are Haslemere, Liphook and Pulborough.
Property Price Paid in Easebourne by Year
The average sold property price by year was:
| Year | Average Sold Price | Price Change |
Sold Properties
|
|---|---|---|---|
| 2026 | £754,166 | -106% |
3 Properties |
| 2025 | £1,555,312 | 32% |
8 Properties |
| 2024 | £1,058,750 | 16% |
8 Properties |
| 2023 | £884,166 | -88% |
6 Properties |
| 2022 | £1,658,055 | 41% |
9 Properties |
| 2021 | £982,093 | 29% |
16 Properties |
| 2020 | £696,250 | -31% |
2 Properties |
| 2019 | £914,000 | -25% |
5 Properties |
| 2018 | £1,140,625 | 15% |
8 Properties |
| 2017 | £969,125 | 10% |
8 Properties |
Property Price per Property Type in Easebourne
Here you can find historic sold price data in order to help with your property search.
The average Property Paid Price for specific property types in the last three years are:
| Property Type | Average Sold Price | Sold Properties |
|---|---|---|
| Semi Detached House | £538,000.00 | 5 Semi Detached Houses |
| Terraced House | £410,000.00 | 1 Terraced House |
| Detached House | £1,335,789.00 | 19 Detached Houses |
